 An official website of the United States government
Federal R&D Obligations Increased 10% in 2019; Largest Year-to-Year Change since 2009
Federal obligations for research and experimental development totaled $142.4 billion in FY 2019, an increase of 10.0% from FY 2018 obligations of $129.4 billion (figure 1). This is the largest year-to-year increase in federal R&D obligations since 2009, when many agencies received additional funds through the American Recovery and Reinvestment Act. In FY 2019, federal obligations for research showed an 8.8% year-to-year increase to $81.1 billion while experimental development increased 11.8% to $61.3 billion. Obligations for R&D plant increased 13.6% to $4.4 billion during the same period (table 1). Preliminary estimates for FY 2020 obligations indicate a further increase although at a lower rate of 5.9%, totaling $150.9 billion. Research is estimated to increase 5.1% to $85.3 billion, experimental development 7.0% to $65.6 billion, and R&D plant 8.7% to $4.8 billion (table 1). Data presented in this InfoBrief are in current dollars.
Federal R&D obligations, by type of R&D: FY 2000–20
| Fiscal year | Basic research | Applied research | Development |
|---|---|---|---|
| 2000 | 19.6 | 18.9 | 37.4 |
| 2001 | 22.0 | 22.8 | 39.8 |
| 2002 | 23.7 | 24.3 | 45.7 |
| 2003 | 24.8 | 26.3 | 52.5 |
| 2004 | 26.1 | 27.2 | 58.7 |
| 2005 | 27.1 | 26.6 | 65.1 |
| 2006 | 26.6 | 27.0 | 68.2 |
| 2007 | 26.9 | 27.2 | 73.2 |
| 2008 | 27.2 | 26.7 | 73.2 |
| 2009 | 32.9 | 30.8 | 77.4 |
| 2010 | 31.8 | 31.9 | 76.6 |
| 2011 | 29.3 | 28.8 | 77.5 |
| 2012 | 31.0 | 31.0 | 76.5 |
| 2013 | 29.8 | 29.8 | 66.2 |
| 2014 | 31.6 | 31.6 | 67.4 |
| 2015 | 31.5 | 32.3 | 64.9 |
| 2016 | 32.3 | 34.8 | 48.7 |
| 2017 | 33.3 | 36.6 | 49.1 |
| 2018 | 36.2 | 38.4 | 54.8 |
| 2019 | 40.0 | 41.1 | 61.3 |
| 2020 | 41.8 | 43.5 | 65.6 |
| Fiscal year | % change total annual R&D |
|---|---|
| 2000 | - |
| 2001 | 11.3 |
| 2002 | 10.9 |
| 2003 | 10.5 |
| 2004 | 8.3 |
| 2005 | 6.0 |
| 2006 | 2.4 |
| 2007 | 4.5 |
| 2008 | -0.1 |
| 2009 | 11.0 |
| 2010 | -0.5 |
| 2011 | -3.4 |
| 2012 | 2.2 |
| 2013 | -9.2 |
| 2014 | 3.9 |
| 2015 | -1.4 |
| 2016 | -10.0 |
| 2017 | 2.7 |
| 2018 | 8.8 |
| 2019 | 10.0 |
| 2020 | 5.9 |
Note(s):
Detail may not add to total because of rounding. FYs 2009 and 2010 obligations include additional funding provided by the American Recovery and Reinvestment Act of 2009. Beginning with FY 2016, the totals reported for development obligations represent a refinement to this category by more narrowly defining it to be “experimental development.” Most notably, totals for development in FY 2016 and on do not include the Department of Defense (DOD) Budget Activity 7 (Operational Systems Development) obligations. Those funds, previously included in DOD’s development obligation totals, support the development efforts to upgrade systems that have been fielded or have received approval for full-rate production and anticipate production funding in the current or subsequent fiscal year. Therefore, the data are not directly comparable with totals reported prior to FY 2016.
Source(s):
National Center for Science and Engineering Statistics, Survey of Federal Funds for Research and Development.
Data are from the latest edition of the Survey of Federal Funds for Research and Development, sponsored by the National Center for Science and Engineering Statistics (NCSES) within the National Science Foundation (NSF). Data for FY 2019 are actual amounts; FY 2020 data are preliminary and subject to revision.
Federal obligations for research, experimental development, and R&D plant, by type of R&D, performer, and field of science and engineering: FYs 2016–20
FFRDC = federally funded research and development center; nec = not elsewhere classified.
a Intramural activities cover costs associated with the administration of intramural R&D programs, extramural R&D procurements by federal personnel, and intramural performance.
Note(s):
Detail may not add to total because of rounding. Percentages are computed using actual dollars reported.
Source(s):
National Center for Science and Engineering Statistics, Survey of Federal Funds for Research and Development.
Federal Funding for Research
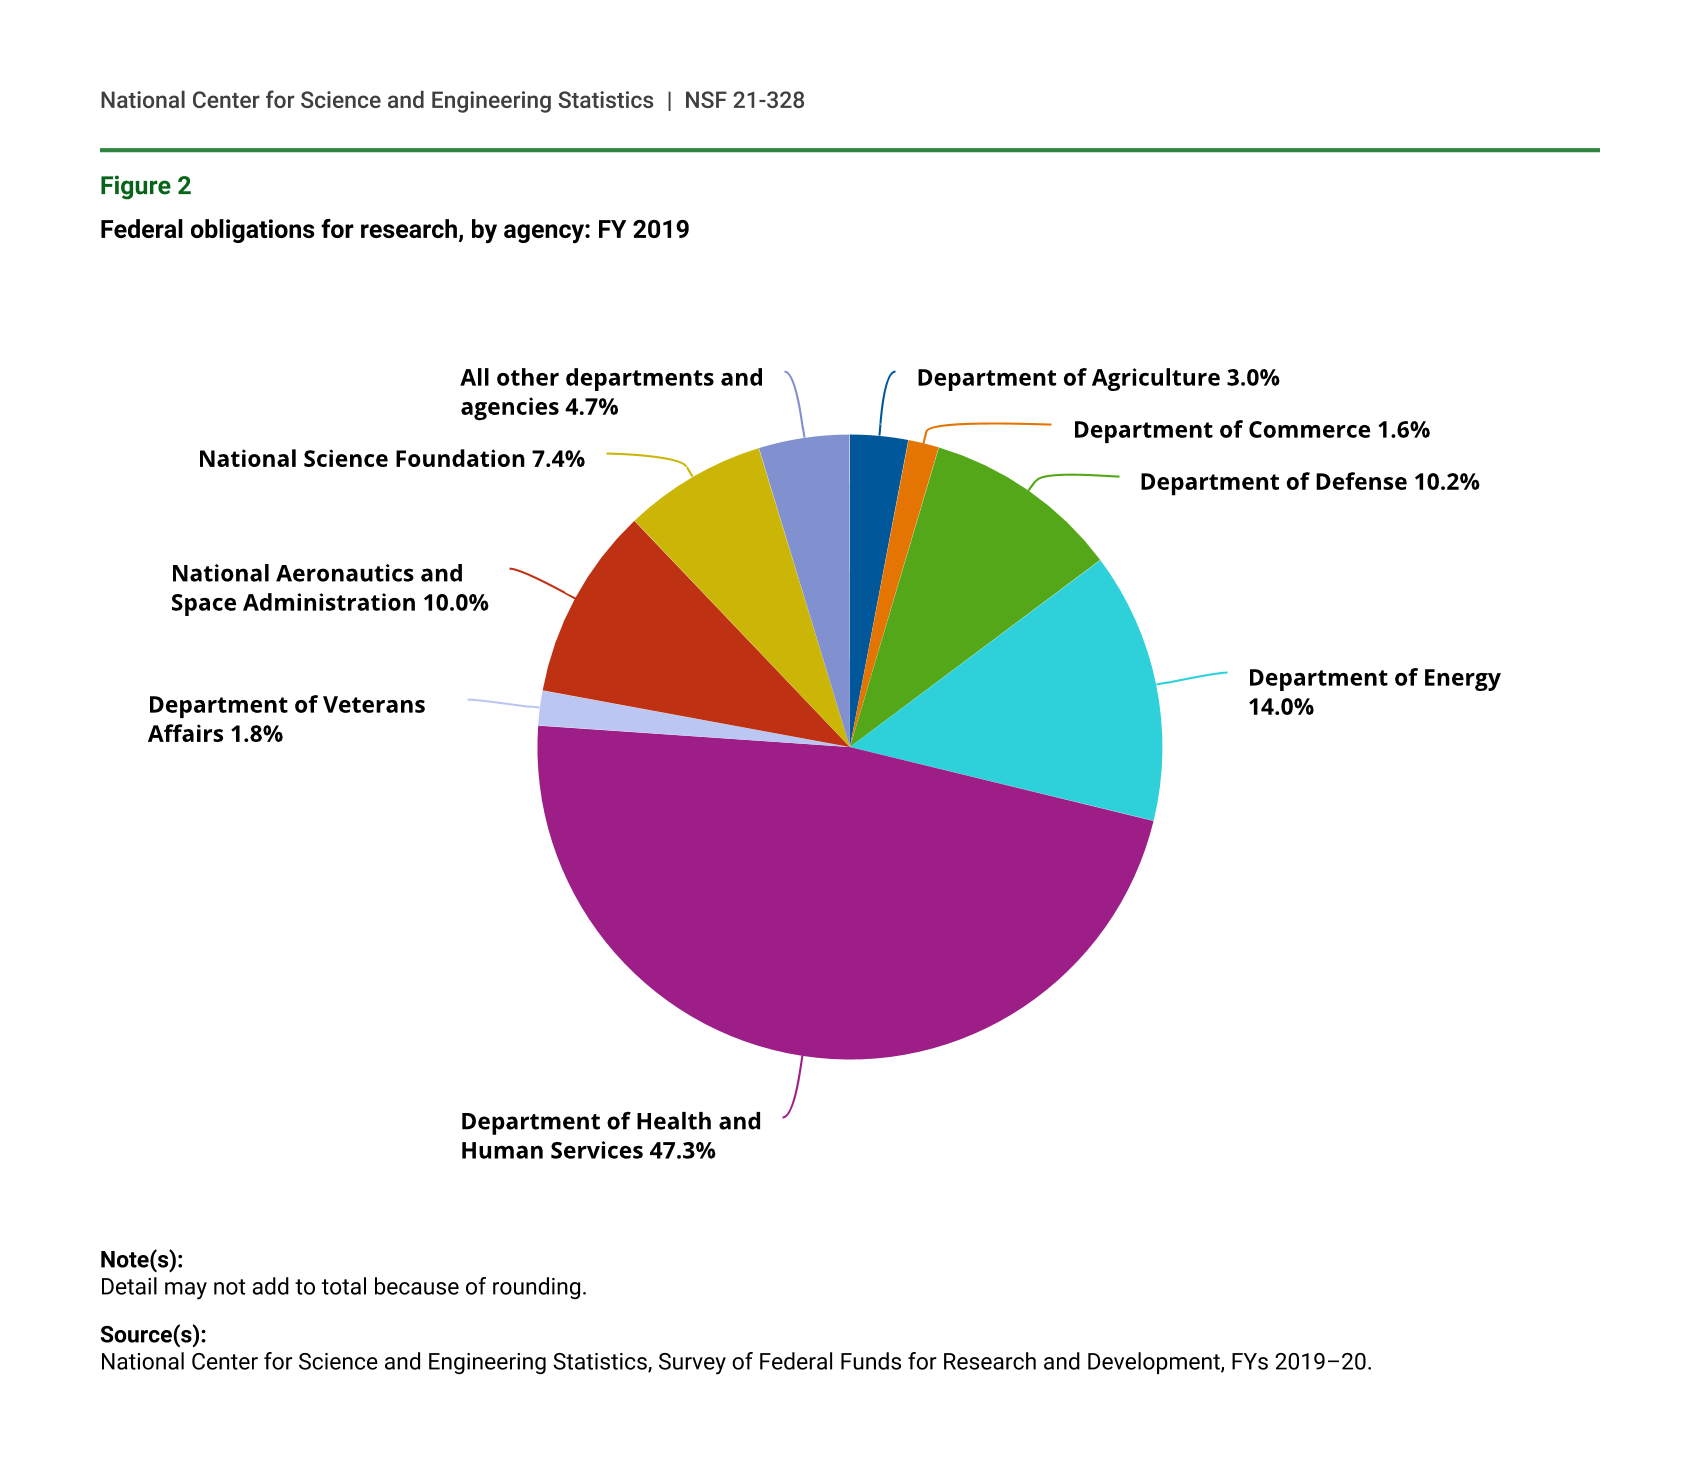
In FY 2019, federal obligations for research, including both basic research and applied research, accounted for 57% ($81.1 billion) of all federal R&D obligations ($142.4 billion) (table 1). The Department of Health and Human Services (HHS), which includes the National Institutes of Health (NIH), accounted for nearly half (47%) of all federal research obligations in FY 2019 with $38.4 billion (figure 2) (NIH accounted for $36.9 billion). The Department of Energy (DOE) accounted for 14% ($11.4 billion) of the FY 2019 research total, followed by the Department of Defense (DOD) with 10% ($8.3 billion), the National Aeronautics and Space Administration (NASA) with 10% ($8.1 billion), NSF with 7% ($6.0 billion), and the Department of Agriculture (USDA) with 3% ($2.4 billion). Together these six agencies accounted for 92% ($74.5 billion) of all federal research obligations in FY 2019. Individual agency shares of basic research compared with applied research vary according to agency mission and objectives.
Life sciences continues to be the predominate field of federal science and engineering research with $38.3 billion in obligations for FY 2019, or 47% of all federally funded research. HHS alone constituted 83% of all federally funded life sciences research in FY 2019, while the second and third largest funders of life sciences, USDA and the Department of Veterans Affairs (VA), had a 5% and 3% share respectively. Life sciences research is estimated to increase more than 6% in FY 2020 to $40.7 billion.
Federal obligations for research, by agency: FY 2019
| Agency | % of total |
|---|---|
| Department of Agriculture | 3.0 |
| Department of Commerce | 1.6 |
| Department of Defense | 10.2 |
| Department of Energy | 14.0 |
| Department of Health and Human Services | 47.3 |
| Department of Veterans Affairs | 1.8 |
| National Aeronautics and Space Administration | 10.0 |
| National Science Foundation | 7.4 |
| All other departments and agencies | 4.7 |
Note(s):
Detail may not add to total because of rounding.
Source(s):
National Center for Science and Engineering Statistics, Survey of Federal Funds for Research and Development, FYs 2019–20.
Federal Funding for Basic Research
Federal obligations for basic research increased 10.6%, from $36.2 billion in FY 2018 to $40.0 billion in FY 2019, while estimated obligations for FY 2020 show further growth, increasing an additional 4.3% to $41.8 billion (table 1). In FY 2019, the six largest R&D agencies accounted for 97% ($38.6 billion) of all federal obligations for basic research (figure 3). Nearly half (48%) of all federal obligations for basic research were made by HHS ($19.1 billion). NASA was the second largest funder of basic research in FY 2019 with 14% ($5.7 billion), and NSF was the third largest, with a 13% share ($5.2 billion) of total obligations.
Federal obligations for basic research, by agency: FY 2019
| Department or agency | % of total |
|---|---|
| Department of Agriculture | 2.3 |
| Department of Defense | 6.3 |
| Department of Energy | 12.7 |
| Department of Health and Human Services | 47.7 |
| Department of Veterans Affairs | 1.6 |
| National Aeronautics and Space Administration | 14.2 |
| National Science Foundation | 13 |
| All other departments and agencies | 1.9 |
Note(s):
Detail may not add to total because of rounding.
Source(s):
National Center for Science and Engineering Statistics, Survey of Federal Funds for Research and Development, FYs 2019–20.
Agency mission and objectives are important factors in understanding federal funding for research. In the case of basic research, for example, NASA’s funding was highly concentrated with 70% of funds directed toward physical sciences (table 2), while NSF’s funding for basic research was much more diversified, reflecting the agency’s broader, legislatively determined role in balancing the nation’s basic research portfolio among multiple science and engineering fields.
Federal obligations for basic research, by agency and field of science and engineering: FY 2019
nec = not elsewhere classified.
Note(s):
Detail may not add to total because of rounding. Only those agencies that had obligations in variables represented by this table appear in the table.
Source(s):
National Center for Science and Engineering Statistics, Survey of Federal Funds for Research and Development, FYs 2019–20.
Federal Funding for Applied Research
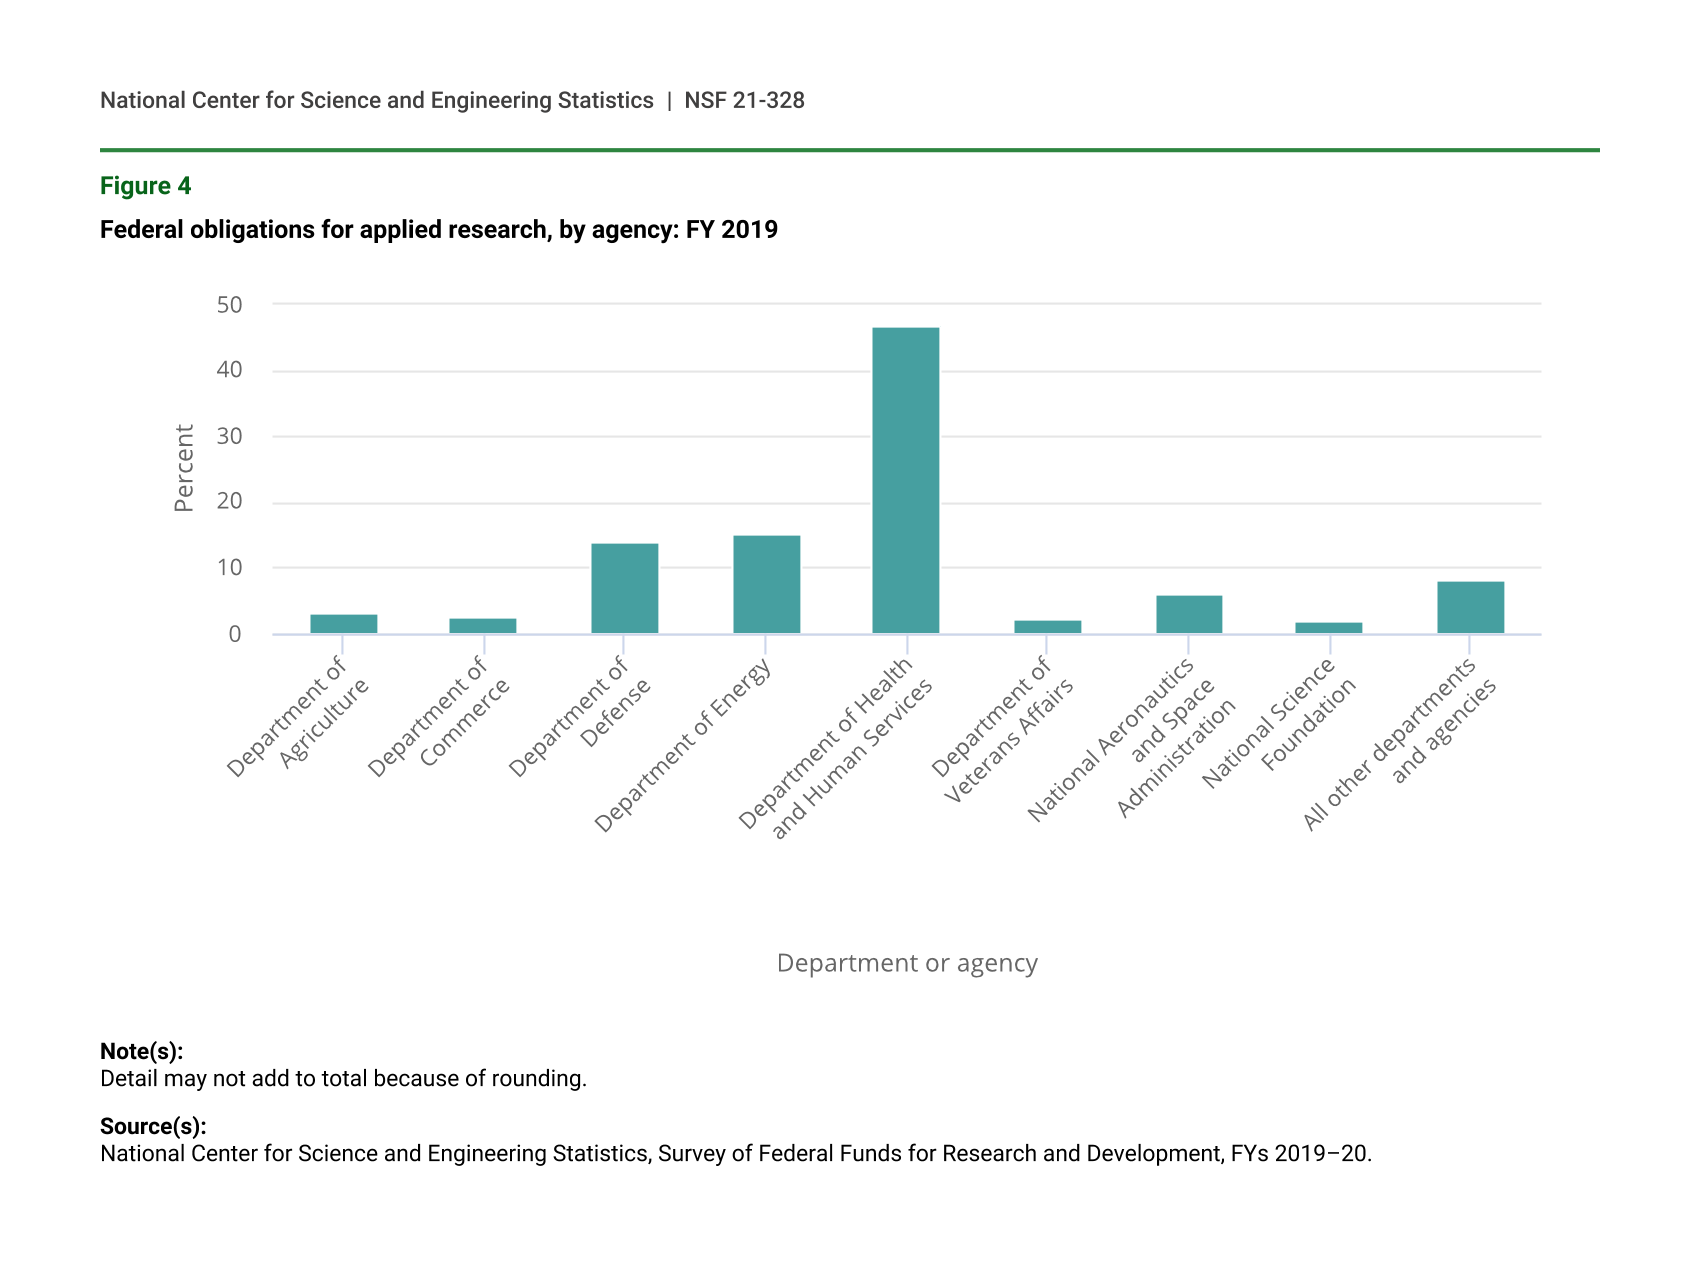
Federal obligations for applied research increased 7.1% between FY 2018 and FY 2019, to $41.1 billion, and estimated FY 2020 obligations show increases of 5.9% to $43.5 billion (table 1). Although the share of total applied research was not as concentrated as the share of basic research among the six largest R&D funding agencies, combined these agencies still accounted for 87% ($35.9 billion) of all applied research obligations in FY 2019 (figure 4). As with basic research, HHS still accounts for the largest share of applied research, with 47% ($19.3 billion) in FY 2019. DOE and DOD were the second and third largest funders of applied research in FY 2019, with 15% ($6.3 billion) and 14% ($5.8 billion), respectively.
Federal obligations for applied research, by agency: FY 2019
| Department or agency | % of total |
|---|---|
| Department of Agriculture | 3.3 |
| Department of Commerce | 2.5 |
| Department of Defense | 14.0 |
| Department of Energy | 15.3 |
| Department of Health and Human Services | 46.8 |
| Department of Veterans Affairs | 2.1 |
| National Aeronautics and Space Administration | 5.9 |
| National Science Foundation | 1.9 |
| All other departments and agencies | 8.2 |
Note(s):
Detail may not add to total because of rounding.
Source(s):
National Center for Science and Engineering Statistics, Survey of Federal Funds for Research and Development, FYs 2019–20.
The applied research funded by HHS was primarily (82%) for life sciences. Most of DOE’s (75%) and DOD’s (43%) investments in applied research were concentrated in engineering (table 3). DOE and DOD combined account for 62% ($7.2 billion) of the FY 2019 federal funding for applied research in engineering ($11.7 billion).
Federal obligations for applied research, by agency and field of science and engineering: FY 2019
nec = not elsewhere classified.
Note(s):
Detail may not add to total because of rounding. Only those agencies and subdivisions that had obligations in variables represented by this table appear in the table.
Source(s):
National Center for Science and Engineering Statistics, Survey of Federal Funds for Research and Development, FYs 2019–20.
Federal Funding for Experimental Development
Although DOD’s share of obligations for research constituted 10% ($8.3 billion) of total federal research obligations ($81.1 billion) in FY 2019, their share of obligations for experimental development was much larger at 82% ($50.5 billion of the $61.3 billion total) (table 4). DOD reports two categories of experimental development to NCSES: advanced technology development (that supports science and key enabling technologies, including technologies for military and nondefense applications) and major systems development (that primarily supports testing and evaluation, mostly of defense-related systems). Between FY 2016 and FY 2019 DOD’s share of all federal experimental development obligations increased from 77% to 82%, driven by the growth in both major systems development (35.7%) and advanced technology development (26.7%) during this period. DOD estimates growth in advanced technology and major systems development will continue in FY 2020, by 5.5% and 7.1%, respectively. NASA provided the second largest share of the government’s experimental development support. NASA’s share of total obligations for experimental development was 9% ($5.4 billion) in FY 2019, down from 14% ($6.8 billion) in FY 2016.
DOE had the third largest amount of federal obligations for experimental development at $3.0 billion in FY 2019, up from $2.7 billion in FY 2016. The National Nuclear Security Administration (NNSA) accounted for 70% ($2.1 billion) of DOE’s experimental development in FY 2019, which was a major increase from the $1.4 billion in obligations from the NNSA in FY 2018.
Federal obligations for experimental development, by agency: FYs 2016–20
NA = not available; data were not collected for that fiscal year.
Note(s):
Detail may not add to total because of rounding. Only those agencies and subdivisions that had obligations in variables represented by this table appear in the table.
Source(s):
National Center for Science and Engineering Statistics, Survey of Federal Funds for Research and Development.
Federal Funding to Performers
Federal R&D funds are obligated to a variety of different performers (table 5). Most (77%) federally funded R&D in FY 2019 was obligated to extramural performers, of which the industry sector accounted for 31% ($44.4 billion) of total federal R&D obligations. Federal intramural performers accounted for 28% ($39.3 billion), followed by higher education at 24% ($34.0 billion), federally funded research and development centers (FFRDCs) at 10% ($14.7 billion) and nonprofits at 6% ($8.5 billion). However, certain sectors are more highly dependent on specific agencies than others. For example, while the industry sector was the largest recipient of federal R&D, nearly 73% ($32.2 billion) of all obligations to industry were from DOD. NASA was the second largest funder of industry with $5.8 billion in FY 2019, 13% of all funding to the sector. HHS and DOE contribute 6% ($2.7 billion) and 5% ($2.1 billion) to industry, respectively.
The federal sector itself received the second largest share of FY 2019 federal R&D obligations, with $39.3 billion. More than half (52%) of all federal intramural R&D obligations in FY 2019 were from DOD ($20.3 billion), followed by 20% ($7.8 billion) from HHS and 11% ($4.1 billion) from NASA. Some federal agencies’ R&D activities are primarily centered around their federal labs and facilities; for example, in FY 2019, 95% ($1.4 billion) of the VA’s R&D was intramural and 100% of the Smithsonian’s R&D ($236 million) was intramural. Sources of obligations to FFRDCs are also highly concentrated, with 66% ($9.6 billion) from DOE in FY 2019. The second largest funder of FFRDCs in FY 2019 was NASA with a 16% share ($9.4 billion), followed by DOD at 11% ($1.6 billion). Universities and colleges receive 64% ($21.6 billion) of R&D obligations from HHS, 14% ($4.9 billion) from NSF, and 10% ($3.3 billion) from DOD.
Federal obligations for research and development, by performer and selected agency: FYs 2019
na = not applicable; agency did not obligate funding to this type of performer.
FFRDC = federally funded research and development center.
a Intramural activities cover costs associated with the administration of intramural R&D programs, extramural R&D procurements by federal personnel, and intramural performance.
Note(s):
Detail may not add to total because of rounding.
Source(s):
National Center for Science and Engineering Statistics, Survey of Federal Funds for Research and Development, FYs 2019–20.
Data Sources, Limitations, and Availability
The survey is a census of all federal agencies that fund R&D programs, as identified from information in the president’s budget submission to Congress, excluding the Central Intelligence Agency. Federal agencies that fund R&D are identified in the budget’s Analytical Perspectives section and the detailed budget estimates by agency section of the appendix. Data were obtained from 33 federal agencies (15 federal departments and 18 independent agencies) that had obligations for R&D during FY 2019 or FY 2020. Because multiple subdivisions of some federal departments completed the survey, there were 83 agency-level responses: 5 federal departments, 60 agencies (within another 10 federal departments), and 18 independent agencies. However, lower offices could also be authorized to enter data: in Federal Funds Survey nomenclature, agency-level offices could authorize program offices, program offices could authorize field offices, and field offices could authorize branch offices. When these sub-offices are included, there were 699 total respondents: 83 agencies, 169 program offices, 81 field offices, and 366 branch offices.
The survey collects data on outlays for total R&D and R&D plant; obligations for R&D by type of R&D, by type of performer, by state-area by type of performer, by foreign country; and research by fields of science and engineering.
Volume 69 of the Survey of Federal Funds for Research and Development collected final FY 2019 data and preliminary FY 2020 totals. Starting in March 2020, a series of supplemental appropriations bills were passed in response to the COVID-19 pandemic: the Coronavirus Preparedness and Response Supplemental Appropriations Act, 2020 (H.R. 6074, 6 March 2020), the Families First Coronavirus Response Act (H.R. 6201, 18 March 2020), the Coronavirus Aid, Relief, and Economic Security Act (H.R. 748, 27 March 2020), the Paycheck Protection Program and Health Care Enhancement Act (H.R. 266, 24 April 2020), and the added stimulus component of Consolidated Appropriations Act, 2021 (H.R. 133, 27 December 2020). Agency FY 2020 preliminary estimates reported under volume 69 do not include R&D obligations from these additional stimulus funds. FY 2020 data are subject to revision when collected under next year’s survey, volume 70 (FYs 2020 data and preliminary FY 2021 totals).
Beginning with volume 66 of the survey (FYs 2016 and 2017), the totals reported for development obligations and outlays represent a refinement to this category by more narrowly defining it to be “experimental development” to align with federal R&D budget formulation as per the Office of Management and Budget’s Circular A-11, Section 84. As a result, totals for experimental development from FY 2016 on do not include the DOD Budget Activity 7 (Operational Systems Development) obligations and outlays. Those funds, previously included in DOD’s development totals, support the development efforts to upgrade systems that have been fielded or have received approval for full-rate production and anticipate production funding in the current or subsequent fiscal year. Therefore, the development data and total R&D data are not directly comparable with totals reported prior to FY 2016.
The full set of data tables for FYs 2019 and 2020 will be available at https://www.nsf.gov/statistics/srvyfedfunds/#tabs-2. Individual tables may be available in advance of the full report. For more information, please contact the author.
Notes
1Obligations represent the amount for orders placed, contracts awarded, services received, and similar transactions during a given period, regardless of when the funds were appropriated or when future payment of money is required. This includes funds from direct appropriations, trust funds, special accounts, fees and charges, and other federal sources for the year of the obligation. Obligations include the full cost of R&D, both specific project costs and overhead costs. Interagency transfers for R&D are reported as R&D or R&D plant by the transferring agency, not by the agency receiving the funds.
2Beginning with FY 2016, the totals reported for development obligations represent a refinement to this category by more narrowly defining it to be “experimental development.” Most notably, totals for development in FY 2016 and on do not include the Department of Defense (DOD) Budget Activity 7 (Operational Systems Development) obligations. Those funds, previously included in DOD’s development obligation totals, support the development efforts to upgrade systems that have been fielded or have received approval for full-rate production and anticipate production funding in the current or subsequent fiscal year. Therefore, the data are not directly comparable with totals reported prior to FY 2016.
3Agency-reported FY 2020 preliminary estimates do not include R&D obligations from additional stimulus funds and are subject to revision.
4See table 18 in the full set of data tables at https://nsf.gov/statistics/srvyfedfunds/#tabs-2.
5Basic research is experimental or theoretical work undertaken primarily to acquire new knowledge of the underlying foundations of phenomena and observable facts. Basic research may include activities with broad or general applications in mind, such as the study of how plant genomes change, but it should exclude research directed toward a specific application or requirement, such as the optimization of the genome of a specific crop species. Details on basic research obligations by agency are available in table 27 in the full set of data tables available at https://nsf.gov/statistics/srvyfedfunds/#tabs-2.
6Applied research is original investigation undertaken to acquire new knowledge. Applied research is, however, directed primarily toward a specific practical aim or objective. Details on applied research obligations by agency are available in table 39 in the full set of data tables available at https://nsf.gov/statistics/srvyfedfunds/#tabs-2.
7Experimental development is creative and systematic work, drawing on knowledge gained from research and practical experience, which is directed at producing new products or processes or improving existing products or processes. Like research, experimental development will result in gaining additional knowledge. This includes the production of materials, devices, and systems or methods, including the design, construction, and testing of experimental prototypes, as well as technology demonstrations, in cases where a system or component is being demonstrated at scale for the first time and where it is realistic to expect additional refinements to the design (feedback R&D) following the demonstration.
8See table 51 in the full set of data tables at https://nsf.gov/statistics/srvyfedfunds/#tabs-2.
9The Analytical Perspectives, Budget of the United States Government, Fiscal Year 2021 chapter on R&D is available at https://www.govinfo.gov/content/pkg/BUDGET-2021-PER/pdf/BUDGET-2021-PER-6-4.pdf.
10For additional information see: Pece C, Jankowski J; National Center for Science and Engineering Statistics (NCSES). 2021. Statistical Definition of Development Clarified: Effect on R&D Totals. NSF 21-326. Alexandria, VA: National Science Foundation. Available at https://ncses.nsf.gov/pubs/nsf21326/.
Suggested Citation
Pece C; National Center for Science and Engineering Statistics (NCSES). 2021. Federal R&D Obligations Increase 10% in 2019 from 2018; Largest Year-to-Year Increase since 2009. NSF 21-328. Alexandria, VA: National Science Foundation. Available at https://ncses.nsf.gov/pubs/nsf21328.
Contact Us
NCSES
National Center for Science and Engineering Statistics
Directorate for Social, Behavioral and Economic Sciences
National Science Foundation
2415 Eisenhower Avenue, Suite W14200
Alexandria, VA 22314
Tel: (703) 292-8780
FIRS: (800) 877-8339
TDD: (800) 281-8749
E-mail: ncsesweb@nsf.gov