 An official website of the United States government
 Summary of National Totals
Of the $2.4 billion in state government agency R&D expenditures in FY 2020, 75% came from state and other nonfederal sources; the remainder came from federal sources (table 1). Although state governments are both funders and performers of R&D, the majority (72%) of their expenditures support extramural R&D (i.e., performers other than state agencies). Higher education institutions were the primary recipients of these expenditures, receiving 54% of all extramural funding, followed by companies and individuals (26%). Intramural performers of R&D, the state agencies themselves, totaled $693 million in FY 2020, an increase of 5% from $658 million in FY 2019.
Expenditures for R&D plant (construction projects, major building renovations, major equipment purchases, and land and building acquisitions intended primarily for R&D use) totaled close to $10 million in FY 2020, a 5% decrease from FY 2019.
State government R&D and R&D facilities expenditures: FYs 2019–20
a Intramural performers include employees within the same state department or agency and services performed by others in support of internal R&D projects.
b Includes government functions for corrections, criminal justice, education, forensic sciences, labor, public safety, and social services.
Note(s):
R&D plant includes acquisition of land, facilities, major equipment, and major building renovations intended primarily for R&D use. Detail may not add to total because of rounding.
Source(s):
National Center for Science and Engineering Statistics, Survey of State Government Research and Development.
State Government R&D Performance
Overview
Although all states had government agencies with R&D expenditures in FY 2020, the amounts are often concentrated in a handful of states. Specifically, five states (California, New York, Texas, Florida, and Pennsylvania) accounted for 61% of all state government R&D expenditures in FY 2020 (figure 1). Expenditures also vary by state between intramural and extramural R&D. For example, 61% ($279 million) of New York’s R&D expenditures are directed toward intramural performance, whereas only 15% ($81 million) of California’s R&D is directed toward intramural performers.
State government expenditures for intramural and extramural R&D, by 10 largest states: FY 2020
| State | Amount |
|---|---|
| CA | 453 |
| TX | 202 |
| NY | 175 |
| FL | 132 |
| PA | 95 |
| OH | 74 |
| WA | 34 |
| CT | 33 |
| MD | 33 |
| NE | 30 |
| State | Amount |
|---|---|
| NY | 279 |
| CA | 81 |
| FL | 52 |
| SC | 28 |
| CT | 26 |
| WA | 23 |
| NC | 18 |
| OR | 16 |
| AL | 14 |
| VA | 13 |
Note(s):
Extramural performers are those outside the department or agency who perform R&D. Intramural performers include a department's or agency's own employees who perform R&D and services performed by others in support of an internal R&D project. Detail may not add to total because of rounding.
Source(s):
National Center for Science and Engineering Statistics, Survey of State Government Research and Development, FY 2020.
Intramural R&D Performance
Five states accounted for 67% of the $693 million in total expenditures for intramural R&D performed by state agencies in FY 2020: New York ($279 million), California ($81 million), Florida ($52 million), South Carolina ($28 million), and Connecticut ($26 million). In FY 2020, 43% ($297 million) of all state agency intramural R&D performance was supported by federal funds.
State agency intramural performance is heavily organized around applied research, with 76% ($523 million) of all intramural expenditures classified as applied, while basic research and experimental development constitute 19% and 6%, respectively.
Extramural R&D Performance
The state governments of California, Texas, New York, Florida, and Pennsylvania accounted for 60% of the total $1.8 billion in FY 2020 state government expenditures for extramural R&D performance. However, states varied in how they distributed extramural R&D. For example, Texas state agencies directed 70% of their extramural funding for R&D toward academic institutions ($142 million), compared with 15% ($29 million) to companies and individuals. By comparison, California’s distribution of extramural R&D funding is relatively balanced across the three sectors, with 32% ($144 million) directed toward academic institutions, 46% ($209 million) toward companies and individuals, and 22% ($100 million) toward other performers.
R&D Support from Federal Funds
State government R&D expenditures from federal funds increased 8% from $561 million in FY 2019 to nearly $608 million in FY 2020. At the same time, funding from state governments’ own funds for R&D declined nearly 1% from $1.9 billion to $1.8 billion (table 1). Thus, FY 2020 state government R&D expenditures were buoyed by an increase in federal funds to state governments for R&D, preventing a decline in total state R&D investment.
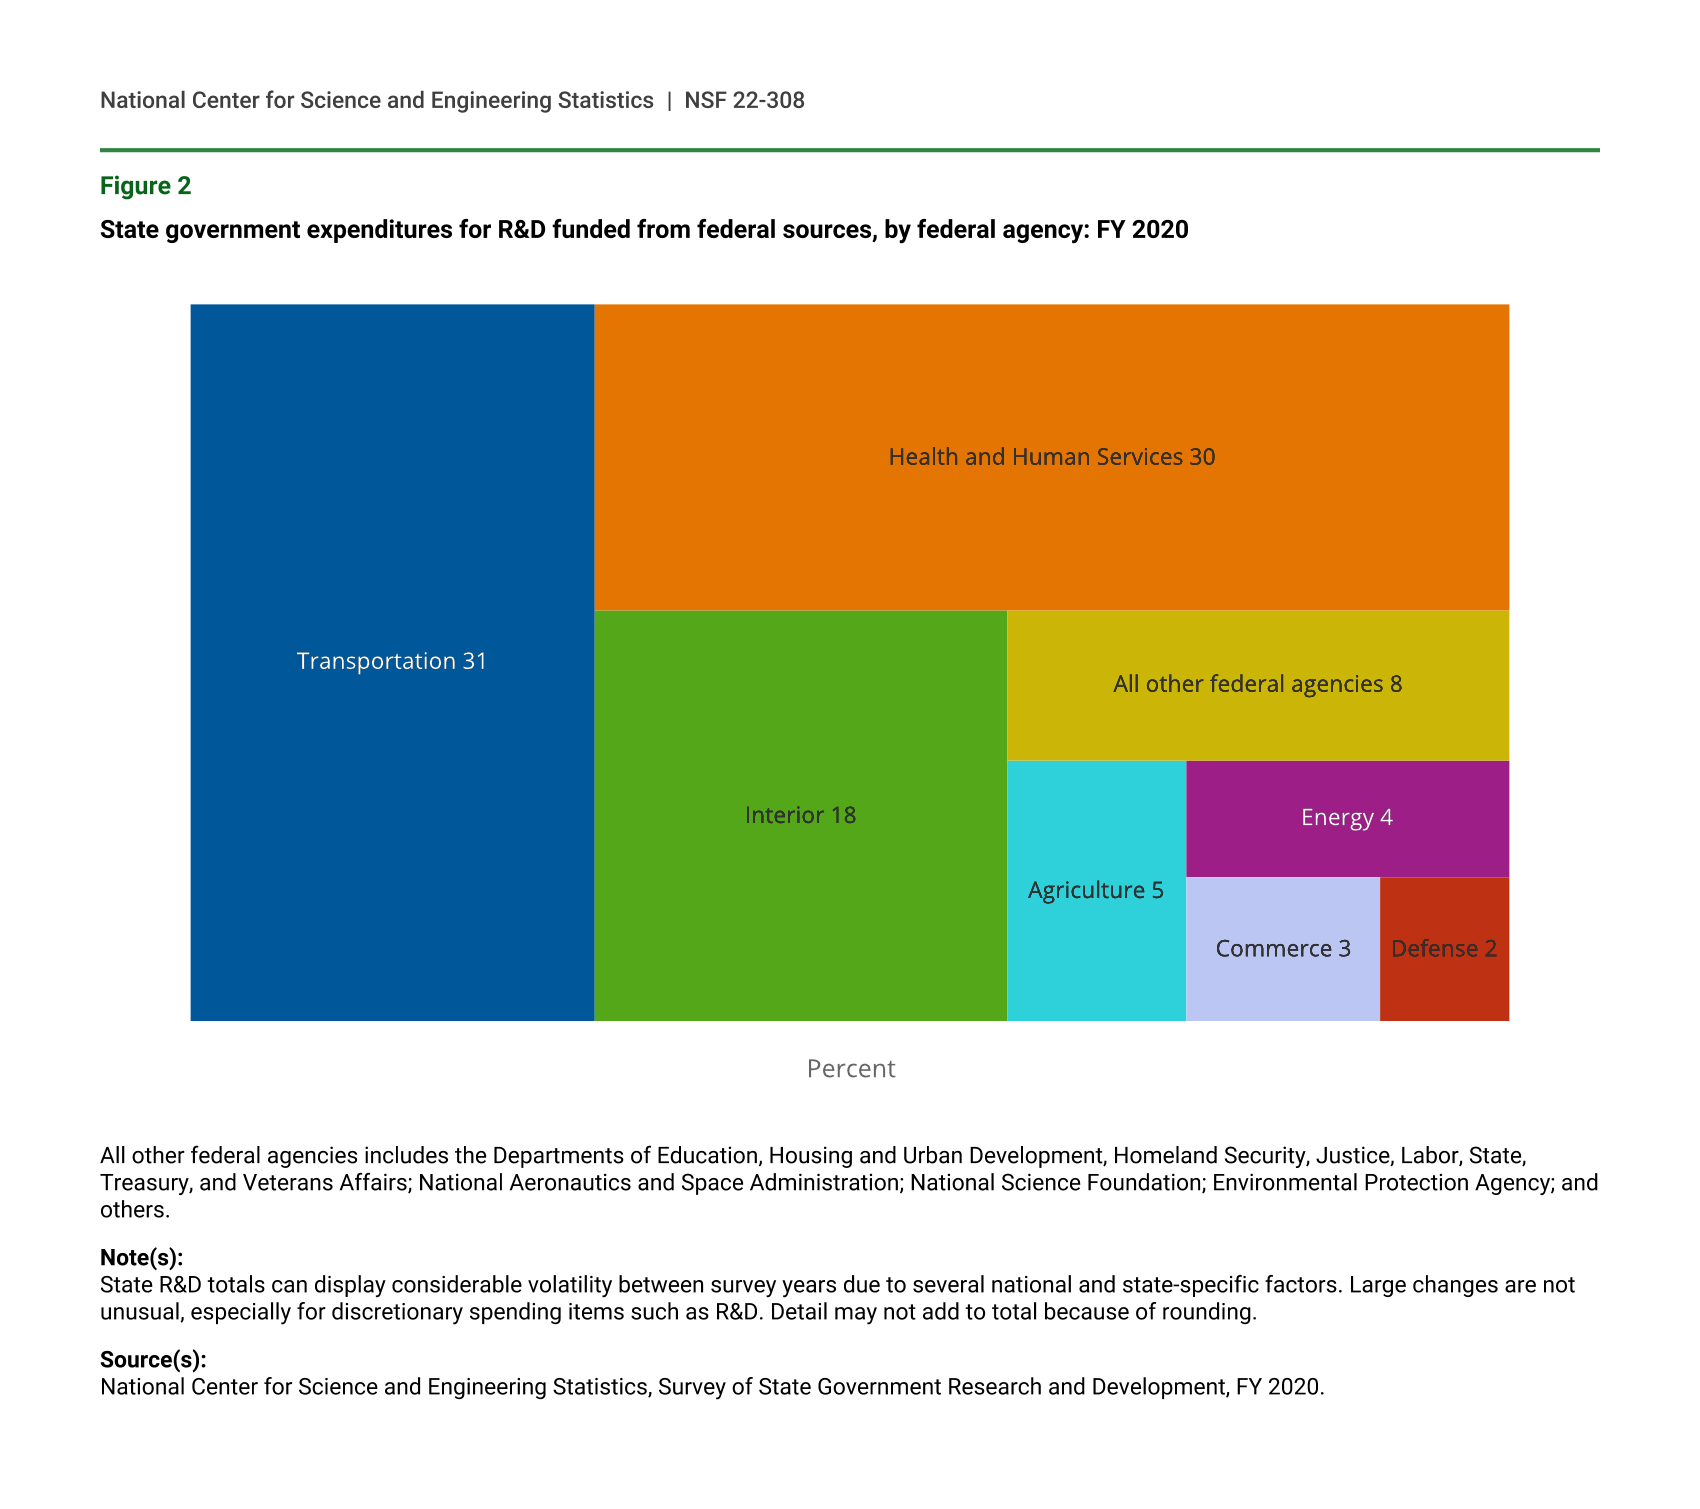
The U.S. Department of Transportation was the single largest source of federal funds, with 31% ($188 million) of all federal funds to state government for R&D, followed by the Department of Health and Human Services, with 30% ($180 million), and the Department of the Interior, with 18% ($107 million) (figure 2). The Department of Agriculture, Department of Energy, Department of Commerce, and Department of Defense contributed 5%, 4%, 3%, and 2%, respectively. All other federal departments and agencies combined accounted for nearly 8% of all federal funds to state governments for R&D.
State government expenditures for R&D funded from federal sources, by federal agency: FY 2020
| Federal department or agency | Percent |
|---|---|
| Transportation | 31 |
| Health and Human Services | 30 |
| Interior | 18 |
| Agriculture | 5 |
| Energy | 4 |
| Commerce | 3 |
| Defense | 2 |
| All other federal agencies | 8 |
All other federal agencies includes the Departments of Education, Housing and Urban Development, Homeland Security, Justice, Labor, State, Treasury, and Veterans Affairs; National Aeronautics and Space Administration; National Science Foundation; Environmental Protection Agency; and others.
Note(s):
State R&D totals can display considerable volatility between survey years due to several national and state-specific factors. Large changes are not unusual, especially for discretionary spending items such as R&D. Detail may not add to total because of rounding.
Source(s):
National Center for Science and Engineering Statistics, Survey of State Government Research and Development, FY 2020.
While New York accounted for 28% of all federal funds to state governments for R&D in FY 2020, the next 10 largest states with expenditures for R&D from federal funding accounted for an additional 34% of the total federal funds to states for R&D (table 2). Florida and South Carolina followed New York, with $30 million each in federal funds, while Texas and California each reported $23 million in federal funds.
Some states are more reliant on federal funds for their R&D than they are from their own state sources. For example, South Carolina reported $30 million in federal funds for R&D compared to nearly $17 million in state funds. In addition to South Carolina, the state governments of Georgia, Hawaii, Idaho, Indiana, Iowa, Kansas, Louisiana, Michigan, Mississippi, Montana, New Mexico, Tennessee, Vermont, West Virginia, Wisconsin, and Wyoming had more expenditures from federal funds for R&D in FY 2020 than they did from their own state appropriations.
State government expenditures for R&D for all performers, by state and source of funds: FY 2020
a State and all others include companies; nonprofit organizations; other state governments; and city, county, regional, or other local governments.
b U.S. total reflects all 50 states and the District of Columbia.
Note(s):
Detail may not add to total because of rounding.
Source(s):
National Center for Science and Engineering Statistics, Survey of State Government Research and Development, FY 2020.
R&D by State Government Functions
Whether performed by state agencies themselves or by other performers outside the agency, most states reported a broad mix of R&D projects related to state government functions: agriculture, energy, environment and natural resources, health, and transportation (table 3). Health-related R&D expenditures account for the largest share (42%) of state agencies’ R&D. Environment and natural resources R&D expenditures accounted for 18% of total state government R&D expenditures in FY 2020, while energy R&D accounted for 16%. Transportation, agriculture, and all other functions’ share of total R&D expenditures in FY 2020 were 11%, 6%, and 6%, respectively.
State R&D expenditures, by state and function of R&D: FY 2020
a Other functions include, but are not limited to, corrections, criminal justice, education, forensic science, labor, public safety, and social services.
b U.S. total reflects all 50 states and the District of Columbia.
Note(s):
Detail may not add to total because of rounding.
Source(s):
National Center for Science and Engineering Statistics, Survey of State Government Research and Development, FY 2020.
Inflation-Adjusted Time Series
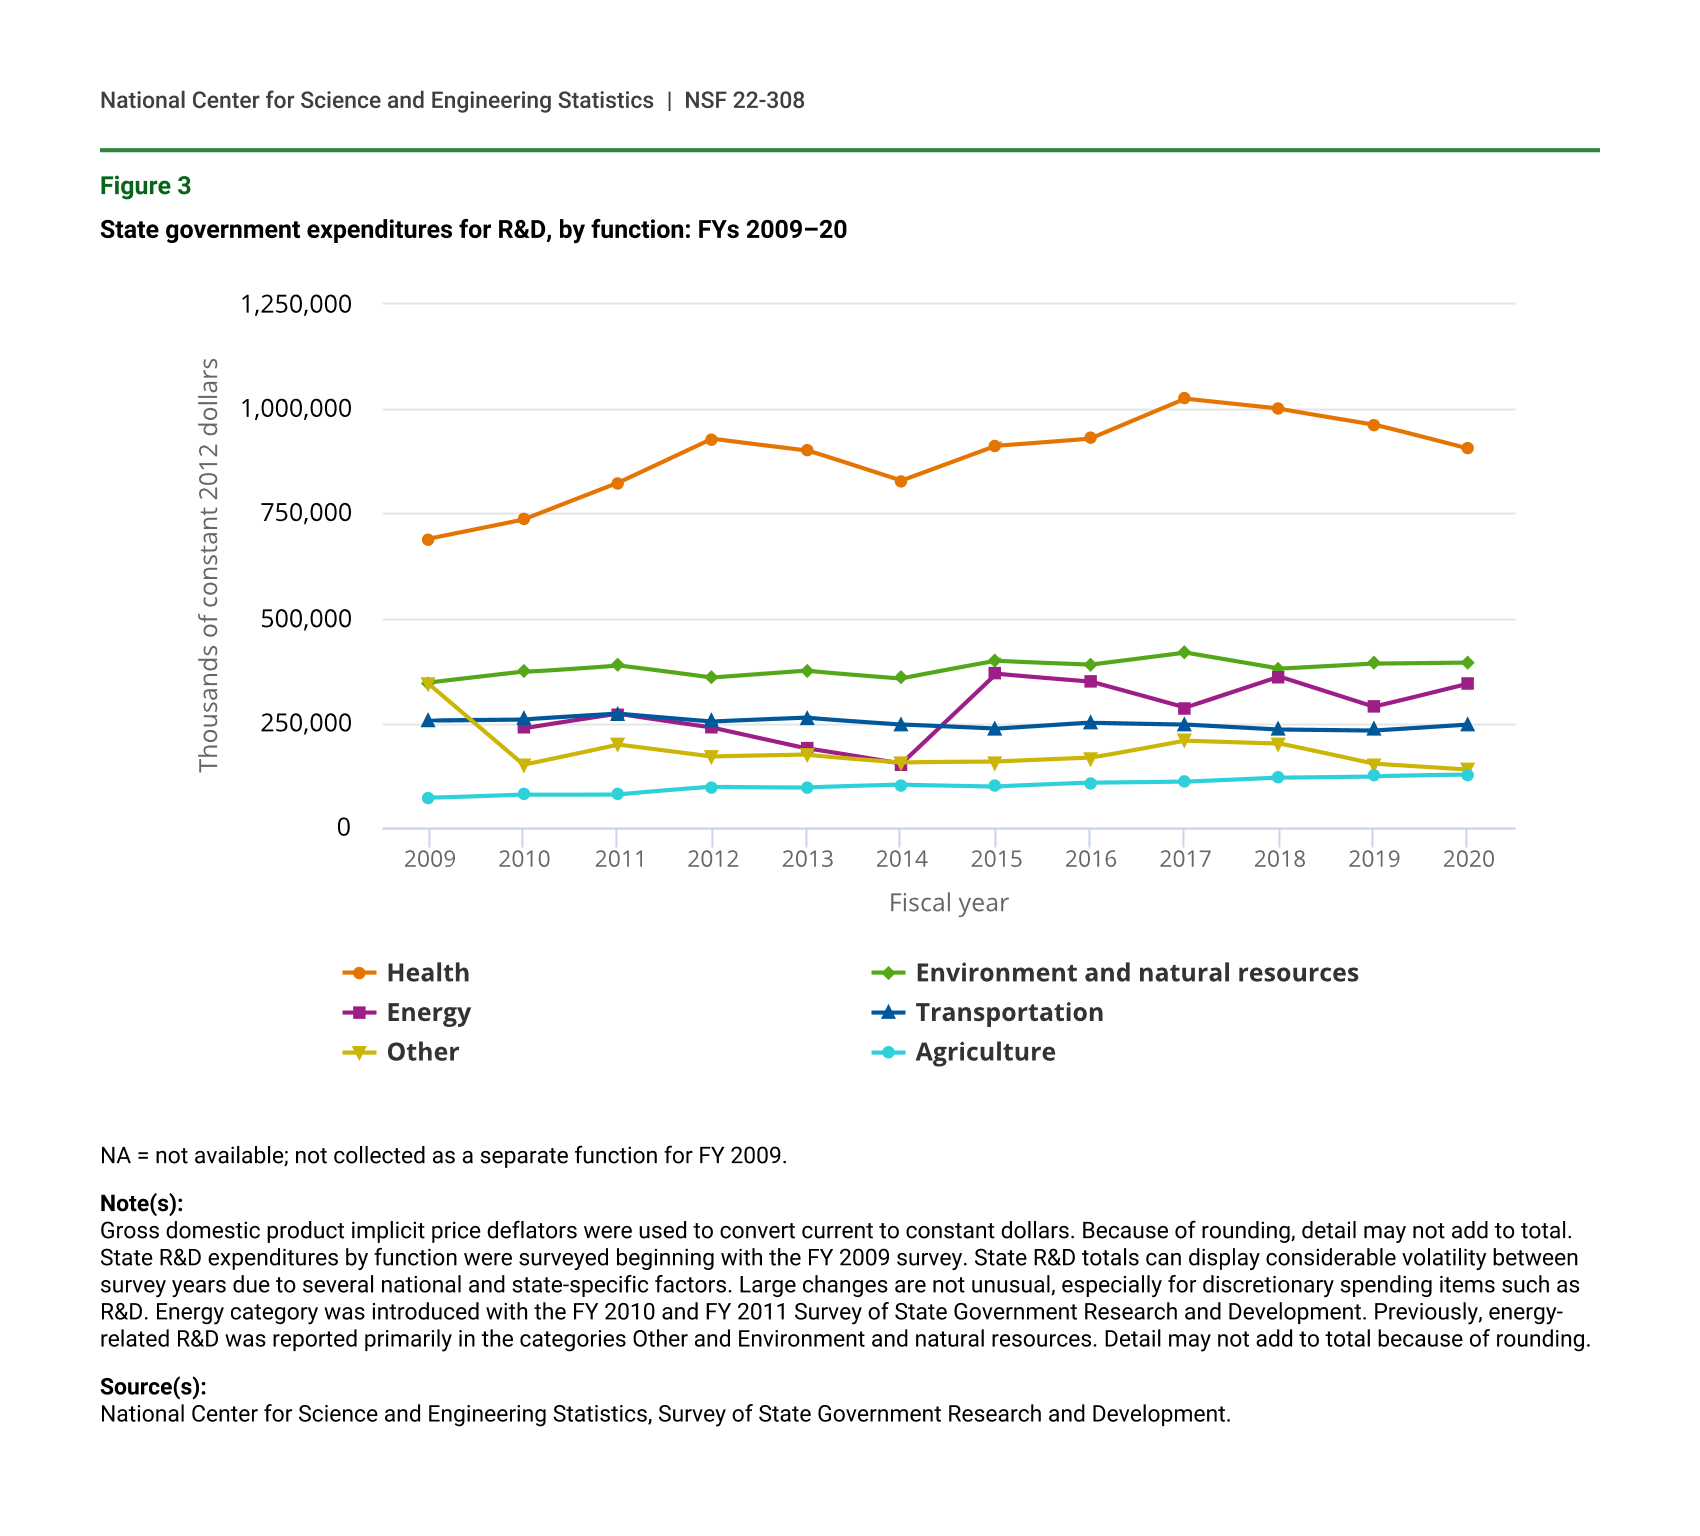
Among all functions, health-related R&D has shown the largest dollar change between FY 2009 and FY 2020 (figure 3). When adjusted for inflation, health-related R&D expenditures increased 31%, from $690 million in FY 2009 to $905 million in FY 2020. During the same period, R&D expenditures for agriculture and for environment and natural resources increased 79% and 14%, respectively, whereas transportation decreased 4%, from $255 million in FY 2009 to $246 million in FY 2020. The energy function was not collected separately until FY 2010, but it has shown increases in inflation-adjusted expenditures of 45% from FY 2010 to FY 2020.
State government expenditures for R&D, by function: FYs 2009–20
| Fiscal year | Health | Environment and natural resources | Energy | Transportation | Other | Agriculture |
|---|---|---|---|---|---|---|
| 2009 | 689,693 | 345,358 | NA | 255,027 | 341,455 | 69,964 |
| 2010 | 735,462 | 371,035 | 236,607 | 257,331 | 148,808 | 78,129 |
| 2011 | 822,966 | 387,672 | 270,741 | 270,593 | 197,724 | 78,816 |
| 2012 | 928,731 | 357,528 | 238,546 | 252,070 | 168,807 | 96,579 |
| 2013 | 901,196 | 373,687 | 189,062 | 260,935 | 172,720 | 95,638 |
| 2014 | 827,727 | 356,280 | 151,682 | 245,778 | 155,594 | 101,629 |
| 2015 | 911,145 | 397,729 | 366,212 | 235,672 | 156,753 | 97,603 |
| 2016 | 929,219 | 389,478 | 348,108 | 250,275 | 165,825 | 106,203 |
| 2017 | 1,023,862 | 418,447 | 285,558 | 246,468 | 207,709 | 109,074 |
| 2018 | 1,000,246 | 379,787 | 359,974 | 234,296 | 201,061 | 119,120 |
| 2019 | 963,221 | 392,172 | 287,782 | 231,618 | 151,713 | 122,030 |
| 2020 | 904,519 | 394,730 | 343,963 | 245,935 | 137,593 | 125,065 |
NA = not available; not collected as a separate function for FY 2009.
Note(s):
Gross domestic product implicit price deflators were used to convert current to constant dollars. Because of rounding, detail may not add to total. State R&D expenditures by function were surveyed beginning with the FY 2009 survey. State R&D totals can display considerable volatility between survey years due to several national and state-specific factors. Large changes are not unusual, especially for discretionary spending items such as R&D. Energy category was introduced with the FY 2010 and FY 2011 Survey of State Government Research and Development. Previously, energy-related R&D was reported primarily in the categories Other and Environment and natural resources. Detail may not add to total because of rounding.
Source(s):
National Center for Science and Engineering Statistics, Survey of State Government Research and Development.
Agency-Specific R&D Details
Of the 699 state agencies that responded to the survey in FY 2020, the largest 20, by total expenditures, accounted for 58% of all agency R&D expenditures (table 4). To illustrate how concentrated expenditures are for health-related R&D, these 20 agencies accounted for $799 million of the $1.0 billion in state agency health R&D, or almost 78% of the funding for total health-related R&D. Although many states invested in health-related R&D, it is still highly concentrated. The six largest health agencies reporting R&D expenditures in FY 2020 constitute 67% of all state government health-related R&D. State expenditures for energy-related R&D is even more highly concentrated; the California Energy Commission alone accounted for 56% of all state agencies’ energy-related R&D expenditures.
Individual state agency expenditures for R&D, by total R&D and function, for the 20 largest agencies: FY 2020
a U.S. total reflects all 50 states and the District of Columbia.
Note(s):
Includes state agency funding from all sources for both intramural and extramural performance. Detail may not add to total because of rounding.
Source(s):
National Center for Science and Engineering Statistics, Survey of State Government Research and Development, FY 2020.
Data Sources and Limitations
All 50 states and the District of Columbia participated in the FY 2020 survey, and 699 of the 726 selected agencies responded to the survey. Puerto Rico agencies did not report to the survey for FY 2020. Data for the FY 2020 survey were collected for NCSES by the U.S. Census Bureau under an interagency agreement.
Most states’ fiscal year begins on 1 July and ends the following 30 June. For example, FY 2020 begins on 1 July 2019 and ends on 30 June 2020. There are, however, five exceptions to the 30 June fiscal year end: New York (ends 31 March), Texas (ends 31 August), and Alabama, Michigan, and the District of Columbia (ends 30 September). Data presented in this InfoBrief are for each of the respective fiscal year periods as defined by the states.
Terms such as state, state government, and state agencies have equivalent meaning and are used interchangeably throughout this InfoBrief. The amounts reported here are for R&D expenditures of state government departments, agencies, public authorities, commissions, and other dependent entities that operate separately or somewhat autonomously from the central state government. State government R&D totals can display considerable volatility between survey years due to several national and state-specific factors. Large changes are not unusual, especially for discretionary spending items such as R&D. R&D plant expenditures can be highly variable year to year and will increase or decrease as capital projects begin or end.
Amounts reported do not include direct appropriations from state legislatures to universities, colleges, and private organizations. As a result, the $952 million in FY 2020 expenditures reported by state agencies to support R&D performance by academic institutions differs from the figure reported by universities and colleges in the NCSES Higher Education R&D Survey for expenditures on R&D activities funded from state and local government sources.
State- and agency-specific data not available in this InfoBrief are available in the full set of data tables from this survey in the report Survey of State Government Research and Development: FY 2020 at https://nsf.gov/statistics/srvystaterd/#tabs-2.
Notes
1Pece C; National Center for Science and Engineering Statistics (NCSES). 2020. State Government R&D Expenditures Decline 4% in FY 2019; Health-Related R&D Declines 2%. NSF 21-300. Alexandria, VA: National Science Foundation. Available at https://ncses.nsf.gov/pubs/nsf21300/.
2Although there was no systematic data collection on the reasons for the decline in health-related R&D, the downturn may have been the result of state budget priorities having been set early in the states’ fiscal year, well before the COVID-19 pandemic was declared; in other cases, funding priorities may have been adjusted from R&D projects to other operational priorities associated with pandemic response early in the crisis.
3Expenditures for R&D do not include expenditures for R&D plant because the two are separate funding activities.
4Data on intramural R&D by source of funds are available in data table 5, available at https://ncses.nsf.gov/pubs/nsf21301#data-tables.
5Detailed data on intramural R&D by type are available in data table 7, available at https://ncses.nsf.gov/pubs/nsf21301#data-tables.
6Gross domestic product implicit price deflators were used to convert current to constant 2012 dollars. Data on calendar year, historical figures, 1953–2020 are taken from Bureau of Economic Analysis (BEA), National Economic Accounts, Gross Domestic Product, accessed 22 June 2021. Based on the BEA practice of updating the reference year based on the five-year comprehensive update (CU), the July 2018 CU revised the reference year from 2009 to 2012.
7The energy category was introduced with the FY 2010 and FY 2011 Survey of State Government Research and Development. Previously, energy-related R&D was reported primarily in the other category and, to some degree, in the environment and natural resources category.
Suggested Citation
Pece C; National Center for Science and Engineering Statistics (NCSES). 2021. State Agencies’ R&D Increased 1% in FY 2020; Health-Related R&D Declines for the Second Year in a Row. NSF 22-308. Alexandria, VA: National Science Foundation. Available at https://ncses.nsf.gov/pubs/nsf22308/.
Contact Us
NCSES
National Center for Science and Engineering Statistics
Directorate for Social, Behavioral and Economic Sciences
National Science Foundation
2415 Eisenhower Avenue, Suite W14200
Alexandria, VA 22314
Tel: (703) 292-8780
FIRS: (800) 877-8339
TDD: (800) 281-8749
E-mail ncsesweb@nsf.gov