 An official website of the United States government
Microbusinesses Performed $4.5 Billion of R&D in the United States in 2018
Businesses with one to nine domestic employees (termed here as microbusinesses) spent $6.5 billion on research and development costs in the United States (table 1), of which $4.5 billion was R&D performed by the microbusinesses themselves (amount includes both R&D performed and funded by the business and R&D performed by the business and funded by others). This amount is in addition to the $441 billion spent on domestic R&D performance in 2018 by businesses with 10 or more employees. Data for this InfoBrief are from the 2019 Annual Business Survey (ABS) (data year 2018), developed and cosponsored by the National Center for Science and Engineering Statistics (NCSES) within the National Science Foundation and by the Census Bureau. The ABS is the primary source of information on R&D expenditures for microbusinesses. The ABS also collects data related to innovation, intellectual property, technology use, and business-owner characteristics from those businesses with one or more employees. Data from selected industries are highlighted in this InfoBrief.
Annual business survey aggregate R&D estimates, by employment size, for companies with 1–9 employees: 2018
r = relative standard error > 50%.
Note(s):
Detail may not add to total because of rounding. Statistics are representative of companies located in the United States.
Source(s):
National Center for Science and Engineering Statistics and Census Bureau, 2019 Annual Business Survey: Data Year 2018.
Characteristics of Microbusiness R&D Performance
By Industry
As was the case in 2017, microbusiness R&D is highly concentrated within a few industries. In 2018, R&D costs by microbusinesses in the United States were approximately $6.5 billion (table 1) of which $4.5 billion or (70%) were performed by the microbusinesses themselves. Of this performance total, nonmanufacturing industries accounted for $4.0 billion (88%) (table 2).
In 2018, the ABS found that nearly three-quarters (72%) of all microbusiness R&D performance was undertaken by microbusinesses classified as professional, scientific, and technical services (North American Industry Classification System [NAICS] 54). NAICS 54 includes, among others, three R&D-intensive industry groups: architectural, engineering, and related services (NAICS 5413), computer systems design and related services (NAICS 5415), and scientific research and development services (NAICS 5417).
By Type of R&D
There are three types of R&D: basic research, applied research, and experimental development. Almost two-thirds (65%) of microbusiness R&D performance in 2018 was spent on development, 30% on applied research, and 5% on basic research (table 2). Microbusiness manufacturers spent 9% of their R&D on basic research, compared with the 4% of R&D total that microbusinesses in nonmanufacturing industries spent on basic research.
Domestic R&D performed by the company, by selected industry and type of R&D, for companies with 1–9 employees: 2018
D = withheld to avoid disclosing data for individual companies; data are included in higher level totals. r = relative standard error > 50%.
NAICS = 2017 North American Industry Classification System.
Note(s):
Detail may not add to total because of rounding or unavailable NAICS detail for select records beyond the four-digit industry classification. Industry classification is based on the dominant establishment payroll. Statistics are representative of companies located in the United States that performed or funded R&D.
Source(s):
National Center for Science and Engineering Statistics and Census Bureau, 2019 Annual Business Survey: Data Year 2018.
By Source of Funding
In 2018, four-fifths (79%) of microbusiness R&D performance were funded from companies’ own sources, 12% was from federal, state, or local governments combined, and 4% each came from another U.S. company or the microbusinesses’ foreign owner (if it had one) (table 3). Manufacturing microbusinesses have a greater proportion of R&D performance funded by the company (87%) than do nonmanufacturing microbusinesses (78%). In scientific research and development services (NAICS 5417), 68% of microbusiness R&D was self-funded, and 19% was funded by government sources. Two-thirds (66%) of all government funding ($524 million) spent on microbusiness R&D went to companies in scientific research and development services (NAICS 5417).
Domestic R&D performed by the company, by selected industry and source of funds, for companies with 1–9 employees: 2018
D = withheld to avoid disclosing data for individual companies; data are included in higher level totals. r = relative standard error > 50%.
NAICS = 2017 North American Industry Classification System.
Note(s):
Detail may not add to total because of rounding or unavailable NAICS detail for select records beyond the four-digit industry classification. Industry classification is based on the dominant establishment payroll. Statistics are representative of companies located in the United States that performed or funded R&D.
Source(s):
National Center for Science and Engineering Statistics and Census Bureau, 2019 Annual Business Survey: Data Year 2018.
By State Location
Microbusiness R&D performance is concentrated within a small number of states. Five states (California, Massachusetts, Texas, Washington, and Pennsylvania) accounted for 55% of all microbusiness R&D in 2018 (table 4). California led all states in microbusiness R&D activity, accounting for 33% ($1.5 billion) of the U.S. microbusiness R&D performance total. Massachusetts was second, with $356 million in R&D performance.
Domestic R&D performed by the company, by state and employment size, for companies with 1–9 employees: 2018
D = withheld to avoid disclosing data for individual companies; data are included in higher level totals. r = relative standard error > 50%.
Note(s):
Detail may not add to total because of rounding. Statistics are representative of companies located in the United States that performed or funded R&D.
Source(s):
National Center for Science and Engineering Statistics and Census Bureau, 2019 Annual Business Survey: Data Year 2018.
Business Ownership Demographics
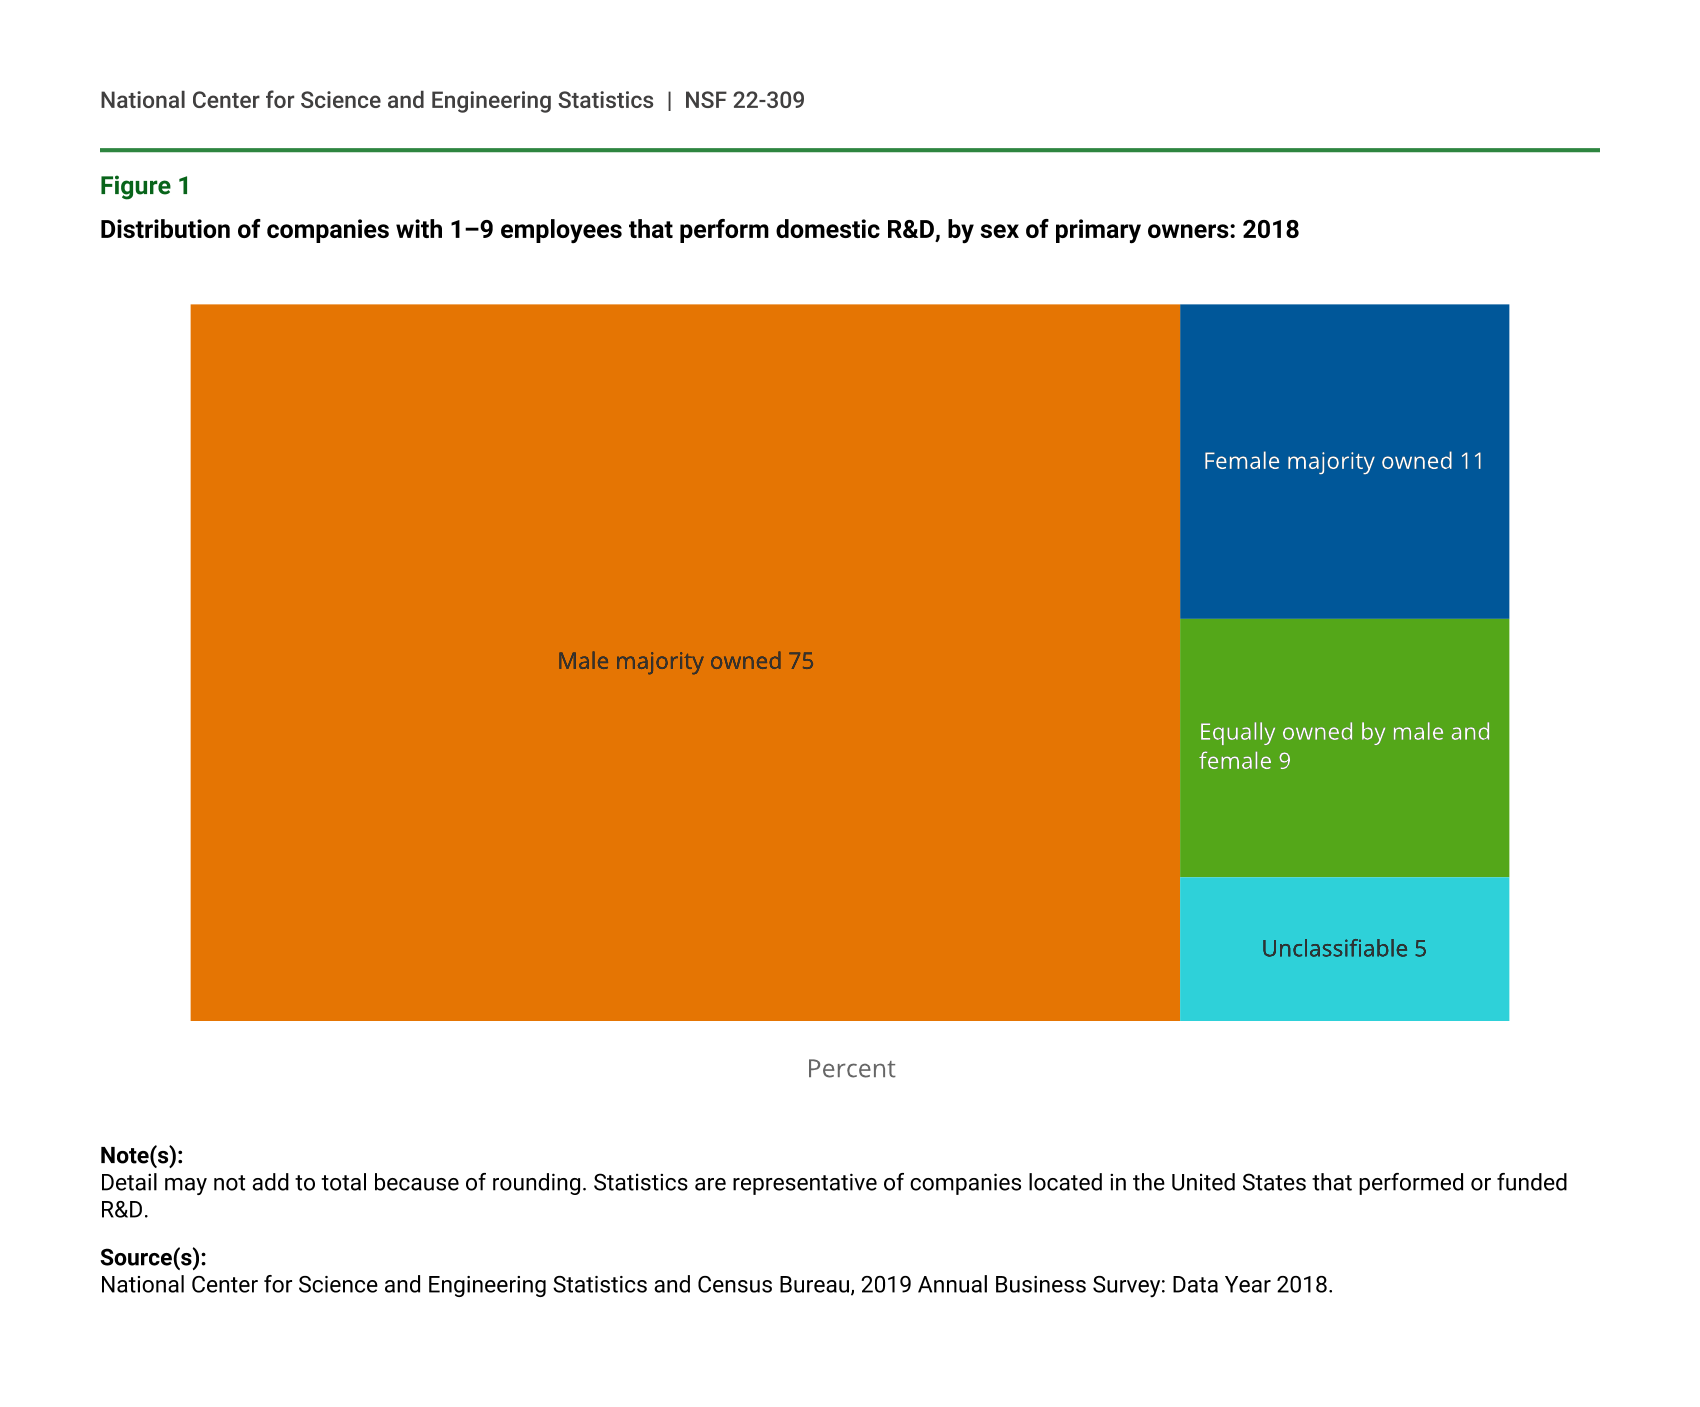
Of the microbusinesses performing R&D in the United States, three-quarters (75%) were male majority owned (figure 1), 11% were female majority owned, and 9% were equally owned by men and women. More than two-thirds (67%) of R&D-performing microbusinesses were primarily owned by nonminority owners (figure 2), and a quarter (25%) were primarily owned by minority owners, of which 17% were underrepresented minorities (or 4% of all R&D performing microbusinesses).
Distribution of companies with 1–9 employees that perform domestic R&D, by sex of primary owners: 2018
| Sex of owners | Percent |
|---|---|
| Female majority owned | 11 |
| Male majority owned | 75 |
| Equally owned by male and female | 9 |
| Unclassifiable | 5 |
Note(s):
Detail may not add to total because of rounding. Statistics are representative of companies located in the United States that performed or funded R&D.
Source(s):
National Center for Science and Engineering Statistics and Census Bureau, 2019 Annual Business Survey: Data Year 2018.
Distribution of companies with 1–9 employees that perform domestic R&D, by race or ethnicity of primary owner: 2018
| Race or ethnicity of owners | Percent |
|---|---|
| Minority | 25 |
| Equally minority or nonminority | 4 |
| Nonminority | 67 |
| Unclassifiable | 5 |
Note(s):
Detail may not add to total because of rounding. Statistics are representative of companies located in the United States that performed or funded R&D.
Source(s):
National Center for Science and Engineering Statistics and Census Bureau, 2019 Annual Business Survey: Data Year 2018.
R&D, by Type of Costs
Almost half (49%) of microbusiness R&D costs were for salaries, wages, and benefits; 22% for payments to others for R&D, including purchasing R&D services; 7% for materials and supplies; 3% for machinery and equipment; and 1% for depreciation on R&D property and equipment (table 5). An additional 18% of microbusiness R&D costs were for other expenses such as consultants, contractors, travel, or rent. Among the individual NAICS industries surveyed, software publishers (NAICS 5112) spent a large proportion (82%) of their R&D expenses on salaries, wages, and benefits, reflecting the labor-intensive nature of R&D activities in this industry.
Microbusinesses in pharmaceuticals and medicines (NAICS 3254) spent 32% of their R&D performance dollars on salaries, wages, and benefits and 41% on payments to others for R&D including purchasing R&D services (e.g., clinical trial results performed by contract research organizations). Scientific research and development services (NAICS 5417) companies spent 35% of their R&D dollars on salaries, wages, and benefits and 34% on payments to others for R&D, including purchasing R&D services.
Domestic R&D costs, by selected industry and type of cost, for companies with 1–9 employees: 2018
D = withheld to avoid disclosing data for individual companies; data are included in higher level totals. r = relative standard error > 50%.
NAICS = 2017 North American Industry Classification System.
Note(s):
Detail may not add to total because of rounding or unavailable NAICS detail for select records beyond the four-digit industry classification. Industry classification is based on the dominant establishment payroll. Statistics are representative of companies located in the United States that performed or funded R&D.
Source(s):
National Center for Science and Engineering Statistics and Census Bureau, 2019 Annual Business Survey: Data Year 2018.
Total Employment and R&D Employees
There were almost 31,000 domestic R&D employees (79% male, 21% female) working for microbusinesses in 2018 (table 6), and 86% of those domestic R&D employees were in nonmanufacturing microbusinesses. Among all domestic R&D employees, 31% worked in the computer systems design and related services (NAICS 5415) industry, and 28% worked in the scientific research and development services (NAICS 5417) industry.
R&D employee occupations include researchers (e.g., R&D scientists, engineers, and their managers); R&D technicians and equivalent staff; and R&D support staff (clerical and other). Among domestic R&D employees, 70% were researchers, 22% were R&D technicians, and the remaining 8% were R&D support staff. Almost one-third (30%) of the domestic researchers have doctoral degrees.
Domestic R&D employees, by selected industry, sex, and R&D occupation and education, for companies with 1–9 employees: 2018
D = withheld to avoid disclosing data for individual companies; data are included in higher level totals. r = relative standard error > 50%.
NAICS = 2017 North American Industry Classification System.
Note(s):
Detail may not add to total because of rounding. Statistics are representative of companies located in the United States that performed or funded R&D.
Source(s):
National Center for Science and Engineering Statistics and Census Bureau, 2019 Annual Business Survey: Data Year 2018.
Survey Information and Data Availability
The ABS is a single platform for combining multiple previously individual business surveys—the Survey of Business Owners, the Annual Survey of Entrepreneurs, the 2016 Microbusiness R&D and Innovation Survey (BRDI-M), and an innovation survey modeled on Eurostat’s Community Innovation Survey.
In this InfoBrief, R&D costs are expressed in current U.S. dollars and are not adjusted for inflation. For the ABS, a microbusiness is defined as a business organization located in the United States, either U.S. owned or a U.S. affiliate of a foreign parent company, of one or more establishments under common ownership or control, with one to nine domestic employees.
The survey was administered to companies whether or not they were known to have R&D activity. The ABS collected detailed statistics from microbusinesses located in the United States on R&D expenditures, R&D employees, intellectual property, company and primary owner characteristics, and innovation activities. R&D questions only were asked of manufacturers and certain selected nonmanufacturing industries that in previous NCSES surveys (ABS 2017, BRDI-M, and the Business R&D Innovation Survey) represented almost all R&D of microbusinesses in the United States.
The statistics from the survey are based on a sample—and, as such, they are subject to both sampling and nonsampling errors (see “Technical Notes” in the data tables reports at https://www.nsf.gov/statistics/srvyabs/). Microbusinesses with less than $50,000 in R&D are excluded from the ABS estimates and this InfoBrief.
For the microbusiness population, approximately 206,000 microbusinesses with one to nine domestic employees were sampled to represent the population of 3.5 million microbusinesses with one to nine domestic employees. The unit response rate for businesses eligible to report the R&D module was 73.4%. For the full 2019 ABS (data year 2018), a total of 299,976 companies were sampled to represent the population of 5.3 million companies. For the full 2019 ABS, the unit response rate was 71.8%.
The full set of data tables on R&D, company demographics, innovation, technology, and patent and intellectual property protection from this survey will be available in the report Annual Business Survey: 2019 (https://www.nsf.gov/statistics/srvyabs/). Individual data tables and tables with relative standard errors and imputation rates from the 2018 survey are available in advance of the full report.
Notes
1Employees are individuals who worked for the business and received a W-2 issued by the business for salary or wages.
2Wolfe R; National Center for Science and Engineering Statistics (NCSES). 2020. U.S. Businesses Reported $441 Billion for R&D Performance in the United States During 2018, a 10.2% Increase from 2017. NSF 20-316. Alexandria, VA: National Science Foundation. Available at https://ncses.nsf.gov/pubs/nsf20316.
3Kindlon A; National Center for Science and Engineering Statistics (NCSES). 2020. Microbusinesses Had More Than $6.7 Billion in R&D Costs in the United States in 2017, According to New Annual Business Survey. NSF 21-302. Alexandria, VA: National Science Foundation. Available at https://ncses.nsf.gov/pubs/nsf21302/.
4As defined by the Frascati Manual (OECD 2015), basic research is experimental or theoretical work undertaken primarily to acquire new knowledge of the underlying foundations of phenomena and observable facts, without any particular application or use in view. Applied research is original investigation undertaken to acquire new knowledge. It is, however, directed primarily toward a specific, practical aim or objective. Experimental development is systematic work, drawing on knowledge gained from research and practical experience and producing additional knowledge, which is directed to producing new products or processes or to improving existing products or processes. See Organisation for Economic Co-operation and Development (OECD). 2015. Frascati Manual 2015: Guidelines for Collecting and Reporting Data on Research and Experimental Development. OECD Publishing, 7th ed. Paris.
Suggested Citation
Kindlon A; National Center for Science and Engineering Statistics (NCSES). 2021. Microbusinesses Performed $4.5 Billion of R&D in the United States in 2018. NSF 22-309. Alexandria, VA: National Science Foundation. Available at https://ncses.nsf.gov/pubsnsf22309/.
Contact us
NCSES
National Center for Science and Engineering Statistics
Directorate for Social, Behavioral and Economic Sciences
National Science Foundation
2415 Eisenhower Avenue, Suite W14200
Alexandria, VA 22314
Tel: (703) 292-8780
FIRS: (800) 877-8339
TDD: (800) 281-8749
E-mail: ncsesweb@nsf.gov