 An official website of the United States government
Overall Host Country Distribution
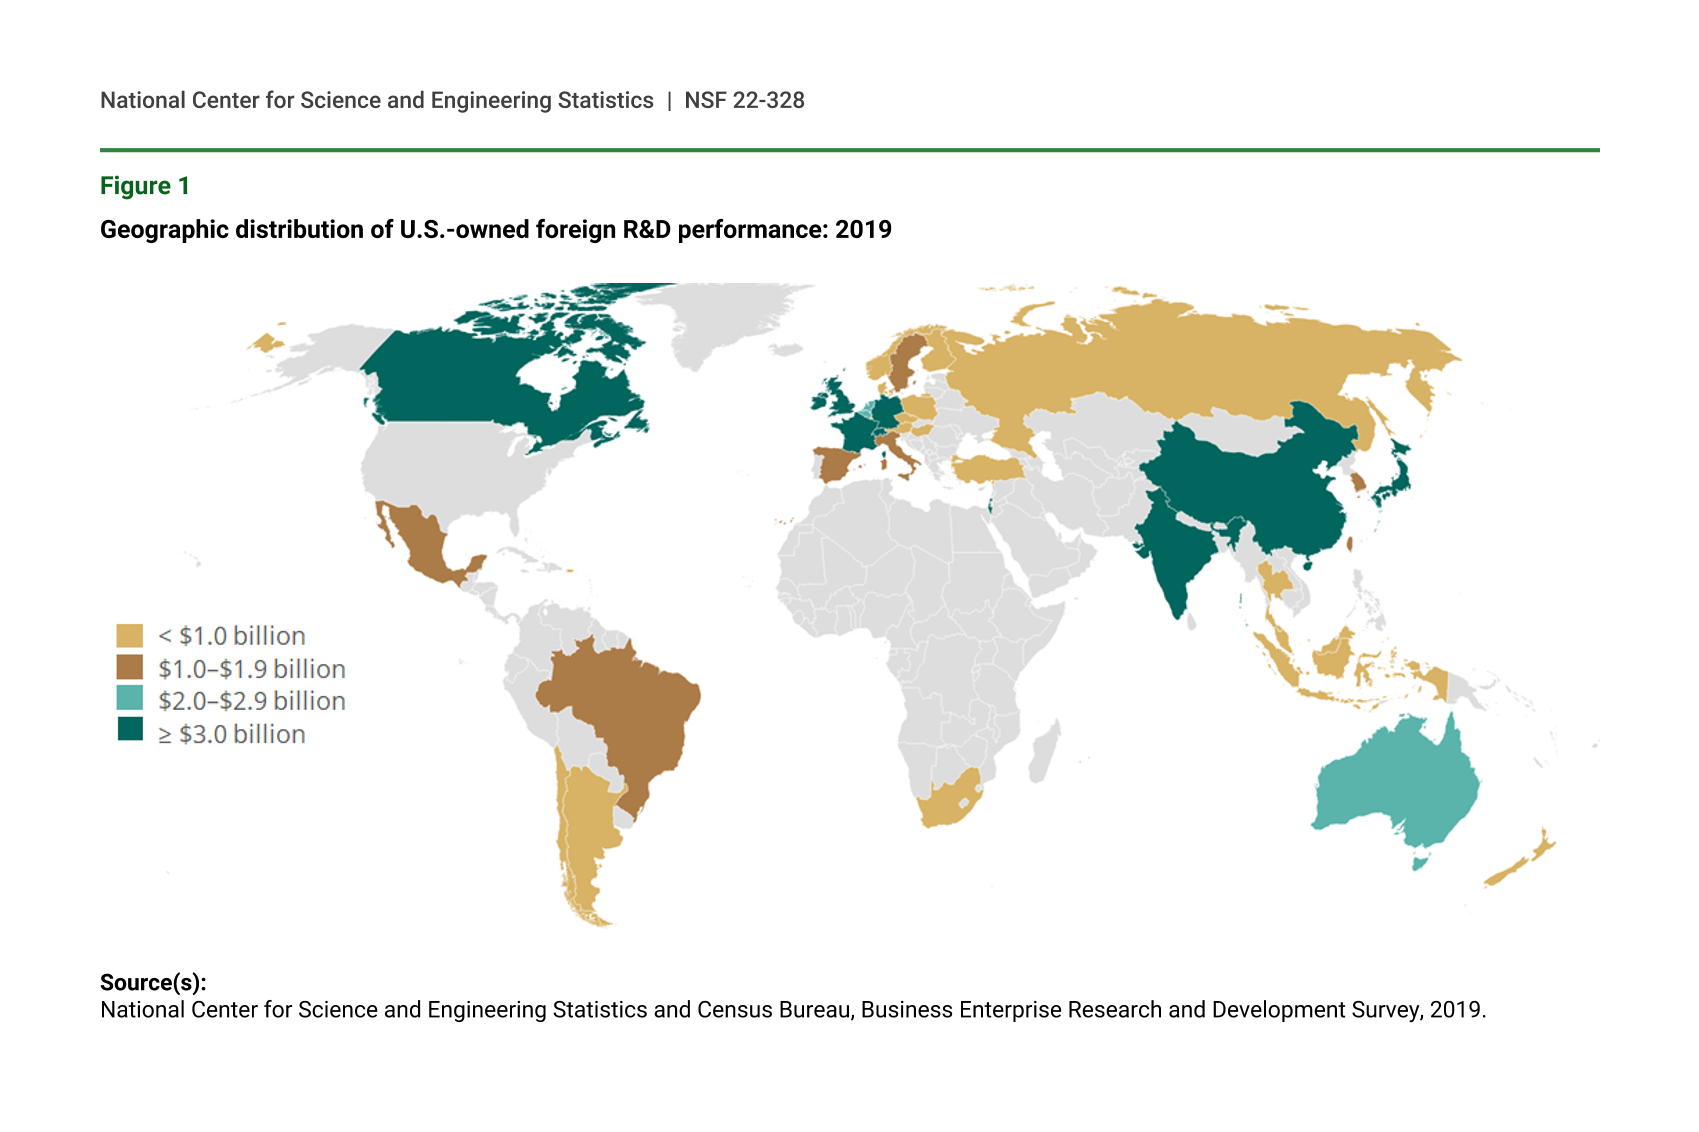
U.S.-located companies reporting foreign R&D employed 11.1 million workers abroad (table 1), based on 2019 BERD statistics. The 10 countries with the most U.S.-owned foreign R&D performance (more than $3 billion in U.S. dollars) includes Canada, five European locations (United Kingdom [UK], Germany, France, Ireland, and Switzerland), three Asian countries (China, India, and Japan), and Israel. Other countries in the top 10 at some point since 2011 include Brazil and Singapore. Figure 1 summarizes the 2019 geographic distribution of these R&D performance statistics.
Geographic distribution of U.S.-owned foreign R&D performance: 2019
Source(s):
National Center for Science and Engineering Statistics and Census Bureau, Business Enterprise Research and Development Survey, 2019.
The UK remained the top location for U.S.-owned foreign R&D with $11.8 billion, followed by India, Germany, China, and Canada. These five countries hosted 44% of foreign R&D by U.S.-located companies; the top 10 locations accounted for 65% of this total (table 1).
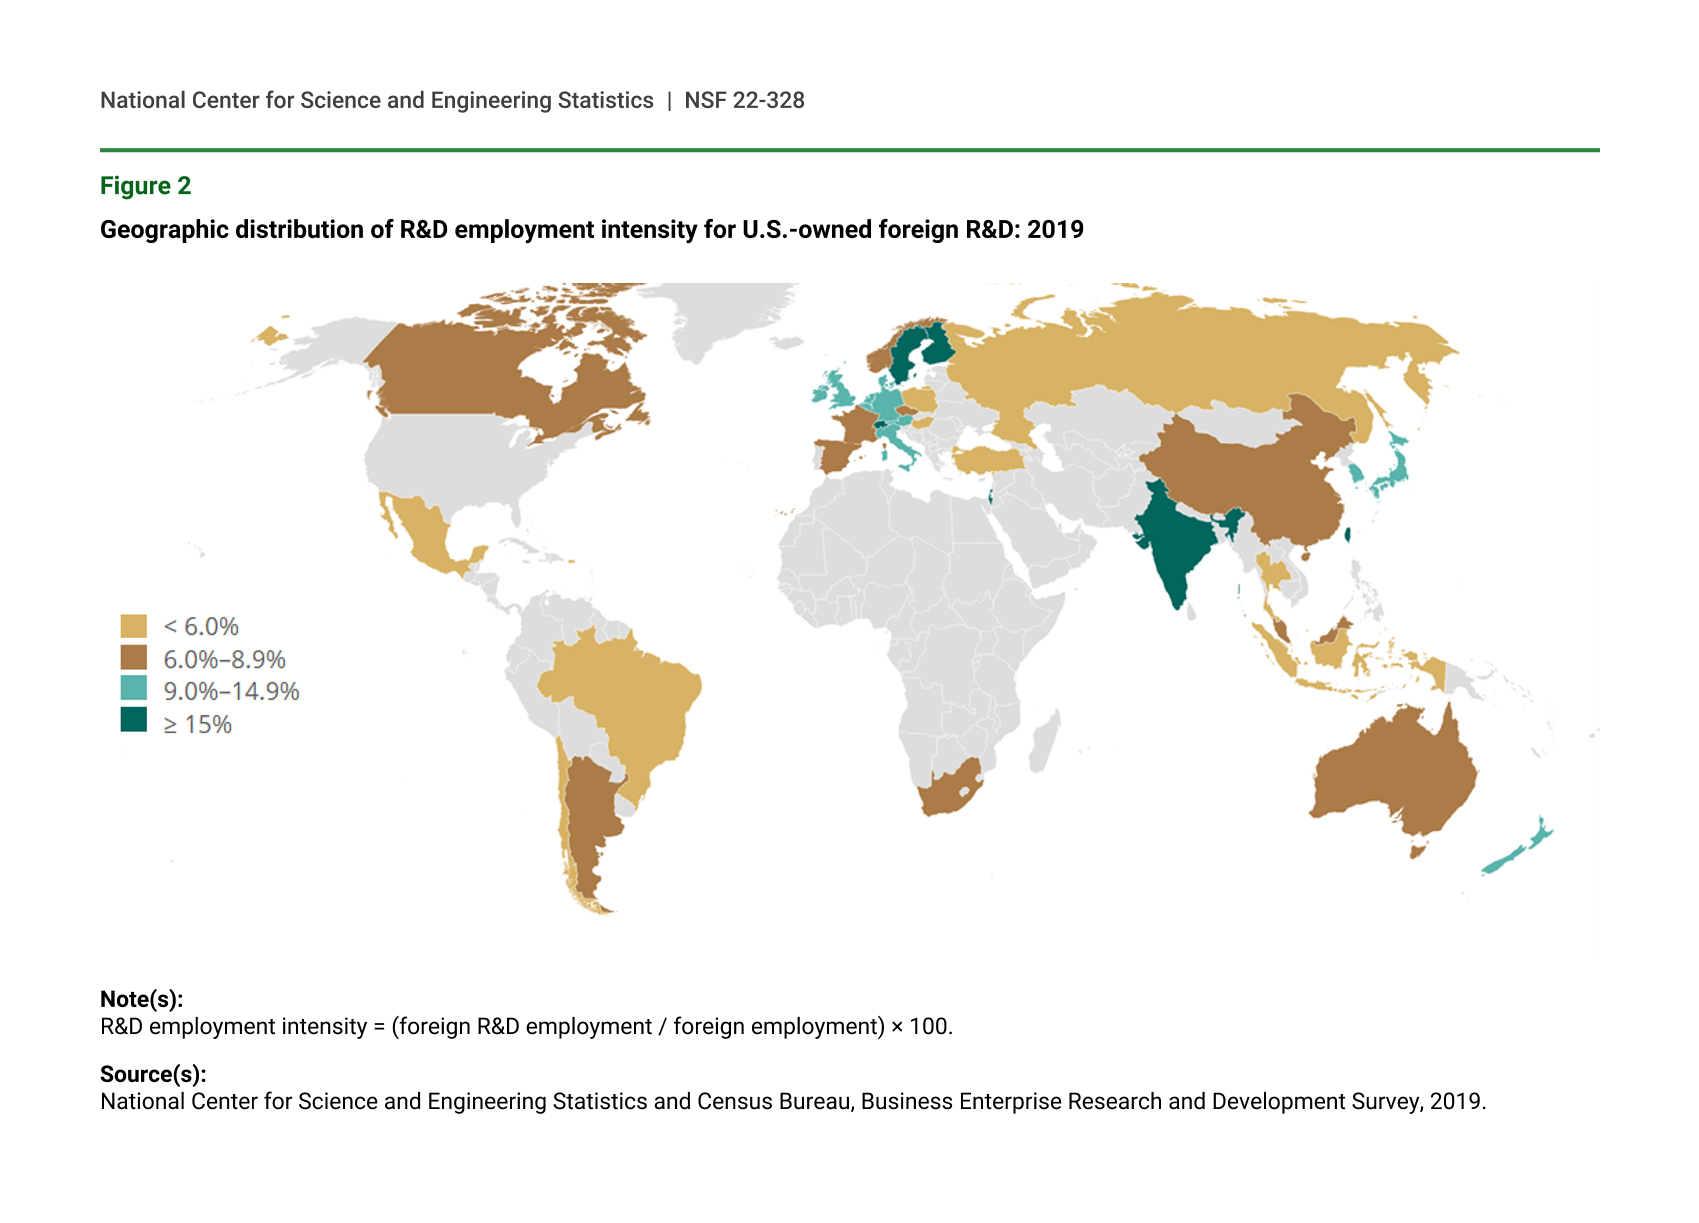
Foreign R&D employment reported by U.S.-located companies increased 6% between 2018 and 2019, compared with 4% growth in overall foreign employment and 4% growth for foreign R&D expenditures. Foreign R&D employment by these companies was the largest in India (196,000), China (85,000), and the UK (67,000) in 2019 (table 1). However, foreign R&D employment intensity (R&D employment as share of total employment) was largest in Israel (39%), India (22%), and Switzerland (15%). Figure 2 shows the global geographic distribution of this intensity measure.
Geographic distribution of R&D employment intensity for U.S.-owned foreign R&D: 2019
Note(s):
R&D employment intensity = (foreign R&D employment / foreign employment) × 100.
Source(s):
National Center for Science and Engineering Statistics and Census Bureau, Business Enterprise Research and Development Survey, 2019.
Overall Industry Distribution
Statistics reported here are based on the North American Industry Classification System (NAICS) code of U.S.-located reporting companies, which may differ from the industry categorization of the foreign-located business. Three sectors—manufacturing (NAICS 31–33); information (NAICS 51); and professional, scientific, and technical services (NAICS 54)—accounted for 94% of U.S.-owned foreign R&D expenditures in 2019. Three subsectors—computer and electronic products (NAICS 334), chemicals (NAICS 325), and transportation equipment (NAICS 336)—accounted for 81% of the manufacturing sector (table 2). However, as detailed below, the industry distribution varies across foreign host countries.
Industry Distribution in Top Foreign Locations
Between 2011 and 2019, the share of manufacturing industries in total foreign R&D reported by U.S.-located companies declined from 75% to 62% (table 2). However, manufacturing industries still accounted for 78% of U.S.-owned foreign R&D in Germany and 72% of U.S.-owned foreign R&D in China in 2019 (table 3). Manufacturing and nonmanufacturing R&D reported by U.S.-located companies are about evenly split in the UK, India, Canada, and Ireland. This section presents details on the industry distribution of U.S.-owned foreign R&D (table 3 and table 4) and industry shares within top host countries (within country shares) (figure 3).
Foreign R&D reported by U.S.-located businesses, by selected industry and host country: 2019
i = > 50% of the estimate is a combination of imputation and reweighting to account for nonresponse.
NAICS = North American Industry Classification System.
Note(s):
An estimate range may be displayed in place of a single estimate to avoid disclosing operations of individual companies.
Source(s):
National Center for Science and Engineering Statistics and Census Bureau, Business Enterprise Research and Development Survey, 2019.
Foreign R&D reported by U.S.-located businesses, by IT-related industries and selected host country: 2019
i = > 50% of the estimate is a combination of imputation and reweighting to account for nonresponse, na = not applicable.
IT = information technology; NAICS = North American Industry Classification System.
Note(s):
An estimate range may be displayed in place of a single estimate to avoid disclosing operations of individual companies.
Source(s):
National Center for Science and Engineering Statistics and Census Bureau, Business Enterprise Research and Development Survey, 2019.
Industry distribution of U.S.-owned foreign R&D in top host countries (within country shares): 2019
NA = not available.
Note(s):
Data are for U.S.-owned foreign R&D.
Source(s):
National Center for Science and Engineering Statistics and Census Bureau, Business Enterprise Research and Development Survey, 2019.
Computer and electronic products manufacturing (NAICS 334), including communications equipment and semiconductors; information (NAICS 51), including software publishers and data processing, hosting, and related services; and computer systems design and related services (NAICS 5415), are defined here as IT-related industries. They are major suppliers of IT and communications equipment and services for applications including mobile, cloud, and artificial intelligence (AI) services. Foreign R&D reported by these IT-related industries accounted for almost half or more of U.S.-owned R&D in India, China, Canada, and Israel in 2019 (table 4).
U.S.-located companies classified in computer and electronic products (NAICS 334) accounted for the largest share of U.S.-owned foreign R&D across all locations abroad at 24% in 2019. Furthermore, in Israel, this industry accounted for more than half of U.S.-owned foreign R&D and for at least a third of U.S.-owned foreign R&D in China and in India. In the services area, information (NAICS 51) accounted for about a third of U.S.-owned R&D in India and between a fifth and up to a little over a fourth of U.S.-owned R&D in Canada, UK, Switzerland, and Israel. And the largest within country shares of U.S.-owned foreign R&D classified in computer systems design and related services (NAICS 5415) were in India (10%), Israel (8%), and Canada (7%) in 2019 (table 4).
U.S.-located companies classified in chemicals manufacturing (NAICS 325), which includes pharmaceutical companies, performed between 30% and 40% of U.S.-owned foreign R&D in Switzerland, Ireland, and Japan in 2019, compared with the 18% share of this industry in U.S.-owned R&D across all foreign locations (table 3).
Lastly, transportation equipment (NAICS 336) (which includes automobiles and aerospace) accounted for 23% of U.S.-owned R&D in Germany, 18% in Italy, and 12% in China, compared with 7% across all foreign locations reported by U.S.-located companies in 2019 (table 3).
Country Distribution for Top Industries
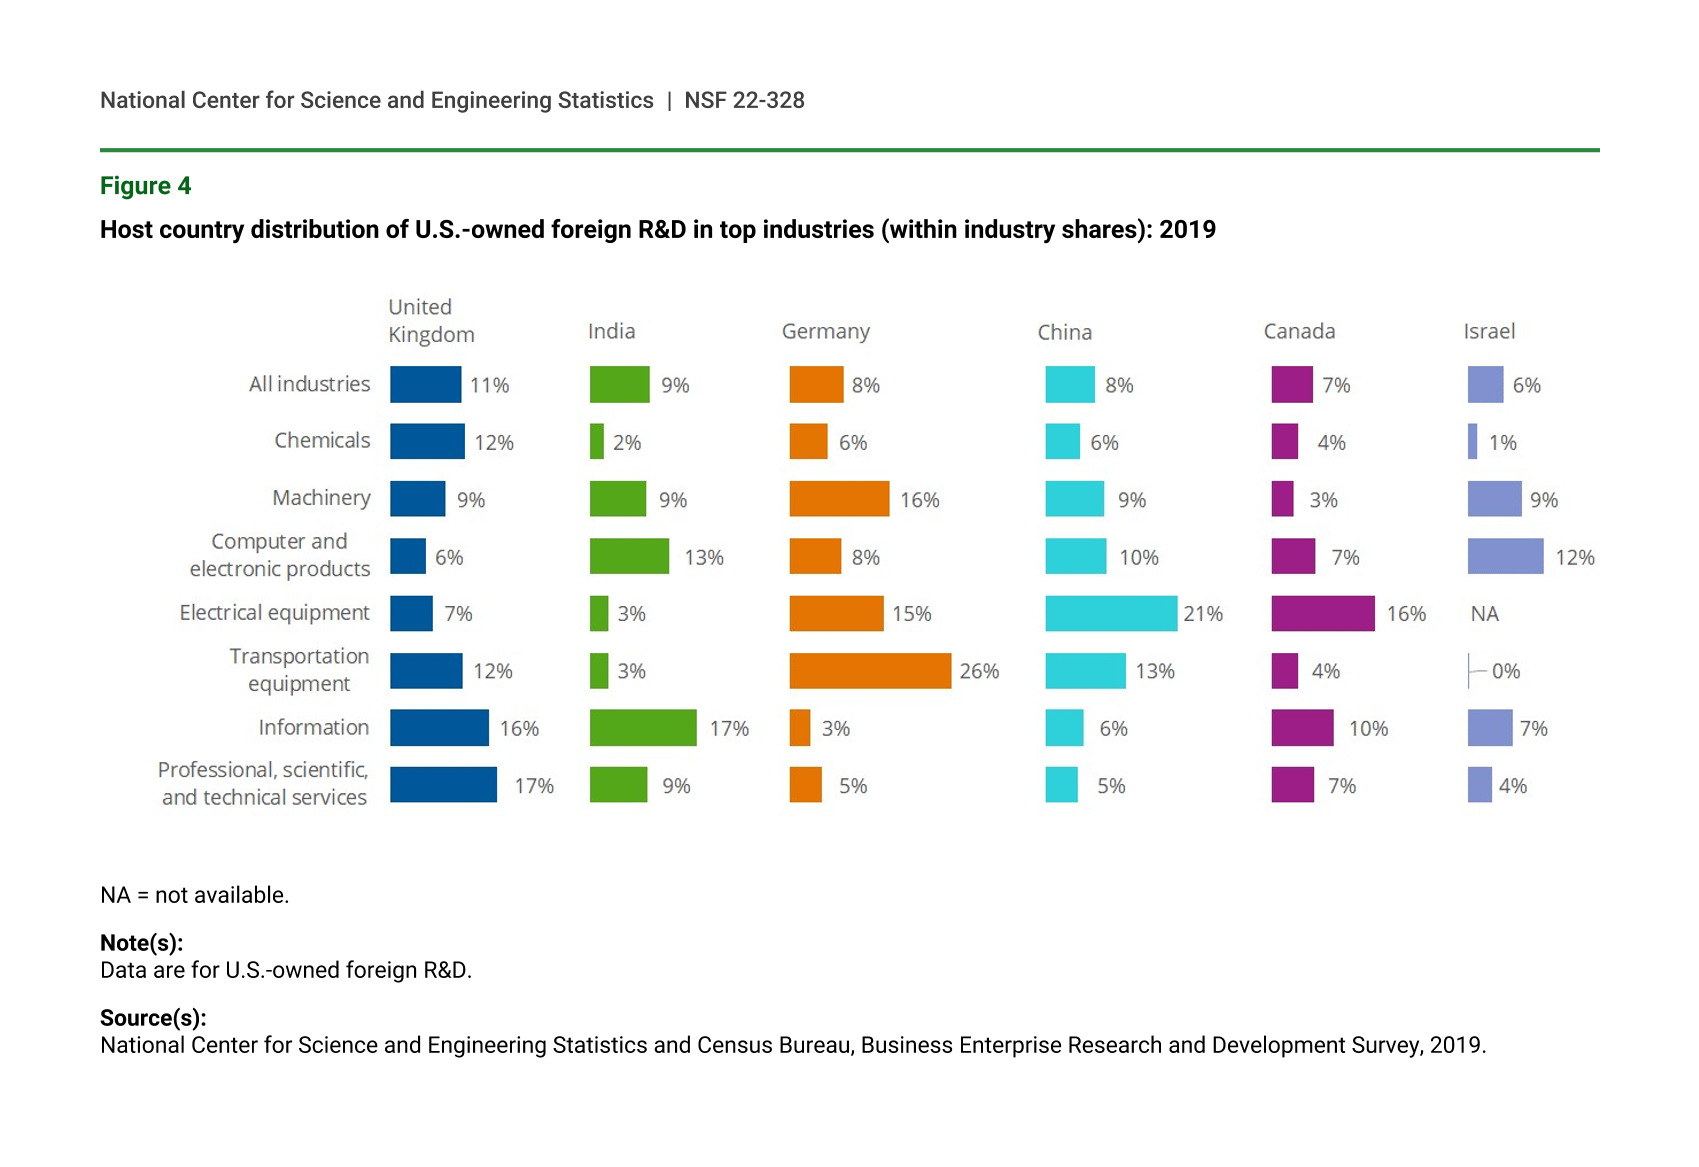
Figure 4 shows the geographic distribution of U.S.-owned foreign R&D within industries. U.S.-owned companies classified in computer and electronic products manufacturing (NAICS 334) reported their largest 2019 foreign R&D performance in India, China, and Israel. Companies classified specifically in semiconductor and other electronic components manufacturing (NAICS 3344) reported $13.0 billion in foreign R&D, with 17% performed in Israel, 12% in China, and 12% in India (table 3).
Host country distribution of U.S.-owned foreign R&D in top industries (within industry shares): 2019
NA = not available.
Note(s):
Data are for U.S.-owned foreign R&D.
Source(s):
National Center for Science and Engineering Statistics and Census Bureau, Business Enterprise Research and Development Survey, 2019.
For IT-related service industries, India hosts a significant share of U.S.-owned foreign R&D. The country accounted for 21% of $6.9 billion in total U.S.-owned foreign R&D by software publishers (NAICS 5112); 26% of $5.9 billion in data processing, hosting, and related services (NAICS 518); and 19% of $5.4 billion in computer systems design and related services (NAICS 5415) (table 3).
Industries engaged in life sciences performed a significant share of U.S.-owned foreign R&D in the UK and Switzerland. U.S.-owned foreign R&D in these locations accounted for 12% and 11%, respectively, of the $15.9 billion of U.S.-owned foreign R&D in pharmaceuticals and medicines manufacturing (NAICS 3254) in 2019. U.S.-located companies classified in R&D in biotechnology (NAICS 541711) reported $2.8 billion in foreign R&D. Of this amount, about a third was performed in the UK and 14% in Switzerland (table 3).
U.S.-located companies classified in transportation equipment manufacturing (NAICS 336) reported over a quarter of their foreign R&D in Germany, whereas over a fifth of U.S.-owned foreign R&D classified in electrical equipment, appliance, and component manufacturing (NAICS 335) was performed in China in 2019 (table 3 and figure 4).
Data Sources and Limitations
In this InfoBrief, monetary amounts are expressed in current U.S. dollars. Foreign R&D and employment by industry are based on the 2012 NAICS code classification of U.S.-located company respondents to annual BERD surveys. Country detail was not collected from companies reporting less than $1 million of R&D paid for by the company or reporting less than $1 million of R&D paid for by others.
BERD samples are selected to represent all U.S.-located, for-profit, nonfarm companies that were publicly or privately held and had 10 or more U.S. employees since the 2017 survey year (5 or more U.S. employees for prior years). Statistics are subject to sampling and nonsampling errors. For additional information, see the technical notes in the annual BERD data tables at https://www.nsf.gov/statistics/srvyberd/#tabs-2.
Notes
1Domestic R&D performed by all U.S.-located businesses grew at an average annual rate of 7% over the same period. For related domestic statistics, see Wolfe R; National Center for Science and Engineering Statistics (NCSES). 2021. U.S. Businesses Reported Nearly a Half Trillion Dollars for R&D Performance in the United States During 2019, an 11.8% Increase from 2018. InfoBrief NSF 22-303. Alexandria, VA: National Science Foundation. Available at http://ncses.nsf.gov/pubs/nsf22303.
2A multinational enterprise (MNE) refers to a parent company and their foreign affiliates. A majority-owned foreign affiliate of a U.S. MNE is a foreign business enterprise in which the combined ownership of all U.S. parents, either directly or indirectly, exceeds 50%. For data on operations and foreign direct investment (FDI) by MNEs, see Bureau of Economic Analysis (BEA) statistics at https://www.bea.gov/data/intl-trade-investment/activities-us-multinational-enterprises-mnes. For information on comparisons of BEA MNE statistics and National Center for Science and Engineering Statistics BERD statistics, see https://www.nsf.gov/statistics/rdlink/.
3For example, foreign R&D performance reported in the BERD survey may include spending by companies that send U.S. workers for temporary R&D assignments overseas.
4For companies reporting foreign activities in the BERD survey, a worker is effectively counted only once as either a domestic or foreign employee, given that internal survey processing ensures that the sum of domestic and foreign employment equals the reported company’s worldwide employment. R&D employment is processed similarly. For detailed BERD data, see annual publications available at https://www.nsf.gov/statistics/srvyberd/#tools&infdsts&tabs-3.
5Two-fifths of this total foreign employment in the BERD survey was accounted for by five countries: China, India, Mexico, UK, and Canada. More generally, employment in majority-owned foreign affiliates of U.S. MNEs, regardless of their R&D activity status, was 14.6 million in 2019 based on BEA statistics (https://www.bea.gov/news/2021/activities-us-multinational-enterprises-2019, accessed 12 November 2021).
6The increased dispersion of U.S. MNE R&D from G7 countries to other regions since the 1990s has long been documented (though R&D stocks of U.S. MNEs remain larger in G7 countries), driven by market (demand), technology supply/skills capability factors, and evolving MNE innovation strategies. See Papanastassiou M, Pearce R, Zanfei A. 2020. Changing Perspectives on the Internationalization of R&D and Innovation by Multinational Enterprises: A Review of the Literature. Journal of International Business Studies 51, 623–64.
7For domestic U.S. business R&D performance, the same three sectors accounted for 91% in 2019.
8Spatial and sectoral specialization of foreign MNE R&D and investment has been documented by studies on the geography of innovation clusters and in international business research. See Kim M, Lampert CM, Roy R. 2020. Regionalization of R&D Activities: (Dis)economies of Interdependence and Inventive Performance. Journal of International Business Studies 51, 1054–75.
9In 2019, U.S.-owned foreign R&D performance in Italy was $1.6 billion, the 11th largest location. The latter amount included $298 million in foreign R&D reported by U.S. companies classified in transportation equipment (NAICS 336).
10For related BEA MNE and United States Patent and Trademark Office (USPTO) patent statistics, see Branstetter LG, Glennon BM, Jensen JB. 2018. The IT Revolution and the Globalization of R&D. NBER Working Paper No. 24707.
11This report does not provide a BERD times series for NAICS 5415 (computer systems design and related services), since 2019 is the first year with foreign R&D details for this IT-related industry.
Suggested Citation
Moris F; National Center for Science and Engineering Statistics (NCSES). 2021. Foreign R&D Reported by IT-Related Industries Account for About Half or More of U.S.-Owned R&D Performed in India, China, Canada, and Israel. NSF 22-328. Alexandria, VA: National Science Foundation. Available at https://ncses.nsf.gov/pubs/nsf22328/.
Contact Us
NCSES
National Center for Science and Engineering Statistics
Directorate for Social, Behavioral and Economic Sciences
National Science Foundation
2415 Eisenhower Avenue, Suite W14200
Alexandria, VA 22314
Tel: (703) 292-8780
FIRS: (800) 877-8339
TDD: (800) 281-8749
E-mail ncsesweb@nsf.gov