Report
STEM Occupations
Overview
There are two ways the science, technology, engineering, and mathematics (STEM) workforce is divided for analysis in this section. One is based on the type of occupation, which falls into three broad categories: science and engineering (S&E), S&E-related, and middle-skill occupations (see sidebar The STEM Workforce of the United States). The other is based on education, which divides this workforce into two categories: (1) the STEM workforce, including workers with at least a bachelor’s degree, and (2) the skilled technical workforce, including workers with a high level of technical knowledge but without a bachelor’s degree. Most middle-skill positions do not require a bachelor’s degree; thus, most workers in middle-skill occupations are part of the skilled technical workforce. In contrast, most S&E occupations require at least a bachelor’s degree. S&E-related positions are a mix of those requiring one or more degrees and those that often require certification. Evaluation of the data from the Census Bureau’s 2021 Current Population Survey reveals intriguing differences in the representation of women, people of different racial or ethnic groups, or people with disabilities among these categories of the STEM workforce. Asian STEM workers are found most commonly in S&E occupations. Women in the STEM workforce are found most commonly in S&E-related occupations. Men in the STEM workforce, as well as Hispanic or Latino and American Indian or Alaska Native STEM workers, are found most commonly in middle-skill occupations.
Representation in S&E, S&E-Related, and Middle-Skill Occupations
Within groups of STEM workers organized by sex, race, ethnicity, or disability status, the distribution by broad occupation type varies.
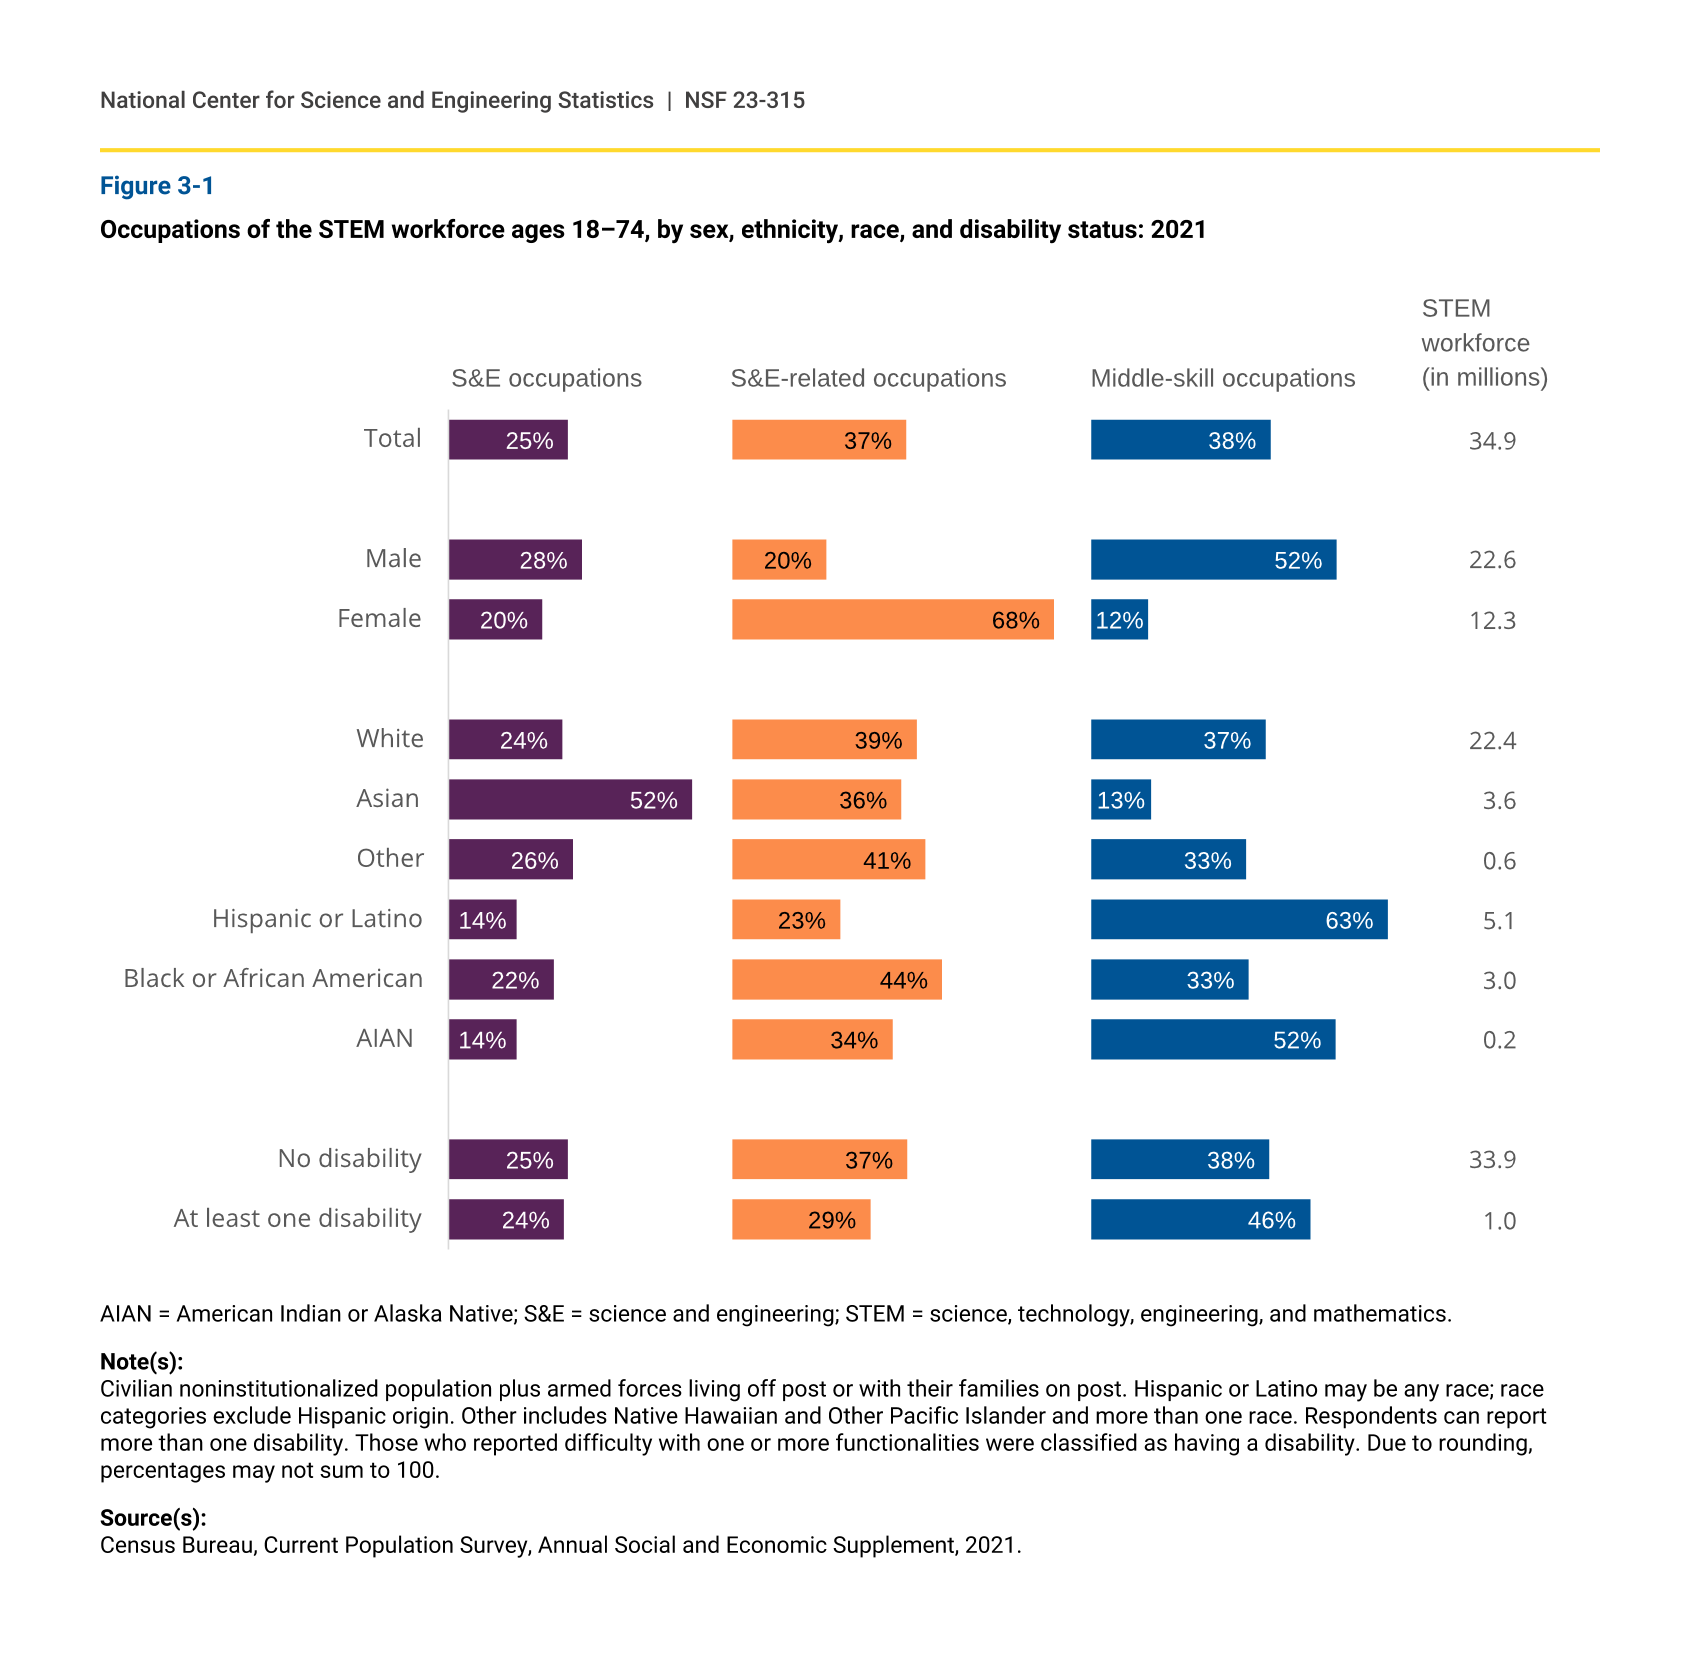
When the STEM workforce is divided into broad occupation types, 38% worked in middle-skill occupations, 37% in S&E-related occupations, and 25% in S&E occupations in 2021 (figure 3-1).
Dividing the STEM workforce by sex reveals striking differences in occupational distribution and concentration. Among men, half (52%) worked in middle-skill occupations, whereas over two-thirds (68%) of women worked in S&E-related occupations. The proportions were closer for S&E occupations than for the other two broad STEM occupation types: 28% of men and 20% of women were in S&E occupations.
Notable differences also exist when the distributions within the racial and ethnic groups are compared. Among Asian STEM workers, about half (52%) were employed in S&E occupations, with the smallest share employed in middle-skill occupations (13%). By comparison, among Hispanics and among American Indians or Alaska Natives in the STEM workforce, the greatest proportions worked in middle-skill occupations (63% and 52%, respectively) and the smallest proportions worked in S&E occupations (14% each). The highest share of Black or African American STEM workers was in S&E-related occupations (44%).
Among those in the STEM workforce, 46% of those with at least one disability worked in middle-skill occupations, compared with 38% of those with no disability. The share of STEM workers with at least one disability working in S&E-related occupations was lower than that of STEM workers without a disability (29% vs. 37%). A similar proportion of STEM workers with a disability and without a disability had positions in S&E occupations (24% and 25%, respectively).
Occupations of the STEM workforce ages 18–74, by sex, ethnicity, race, and disability status: 2021
AIAN = American Indian or Alaska Native; S&E = science and engineering; STEM = science, technology, engineering, and mathematics.
Note(s):
Civilian noninstitutionalized population plus armed forces living off post or with their families on post. Hispanic or Latino may be any race; race categories exclude Hispanic origin. Other includes Native Hawaiian and Other Pacific Islander and more than one race. Respondents can report more than one disability. Those who reported difficulty with one or more functionalities were classified as having a disability. Due to rounding, percentages may not sum to 100.
Source(s):
Census Bureau, Current Population Survey, Annual Social and Economic Supplement, 2021.
Characteristics of the STEM Workforce
About two-thirds employed in S&E-related occupations are women; about a quarter employed in middle-skill occupations are Hispanic; about a fifth employed in S&E occupations are Asian.
In 2021, employment within each broad occupation type was dominated by either men or women (figure 3-2). Middle-skill occupations had the greatest concentration, where nearly 9 out of 10 (89%) workers were men. At 72%, men also had most of the S&E jobs. Conversely, among S&E-related occupations, nearly two-thirds (65%) were women.
Characteristics of the STEM workforce ages 18–74, by occupation: 2021
AIAN = American Indian or Alaska Native; S&E = science and engineering; STEM = science, technology, engineering, and mathematics.
Note(s):
Civilian noninstitutionalized population plus armed forces living off post or with their families on post. Hispanic or Latino may be any race; race categories exclude Hispanic origin. Other includes Native Hawaiian and Other Pacific Islander and more than one race. Respondents can report more than one disability. Those who reported difficulty with one or more functionalities were classified as having a disability.
Source(s):
Census Bureau, Current Population Survey, Annual Social and Economic Supplement, 2021.
When combined, underrepresented minorities—Hispanics, Blacks, and American Indians or Alaska Natives—made up about a quarter (24%) of all STEM workers (figure 1-1). When divided by broad occupation type, compared with their share of STEM workers, underrepresented minorities made up a lower share of S&E occupations (16%) and S&E-related occupations (20%) but a higher share of middle-skill occupations (33%).
Although Hispanics made up 15% of the STEM workforce (figure 2-3), they represented nearly a quarter (24%) of those working in middle-skill occupations (figure 3-2). Similarly, Asian STEM workers made up 10% of the STEM workforce but 21% of those in S&E occupations.
The share of workers with at least one disability was similarly low (2%–4%) across the three STEM occupation types, which is consistent with their low proportion in the overall STEM workforce (3%) (figure 2-3).
Educational Attainment of the STEM Workforce
Within groups of STEM workers organized by sex, race, ethnicity, or disability status, representation in the skilled technical workforce varies.
Dividing the STEM workforce by educational attainment yields two large groups (see sidebar The STEM Workforce of the United States). One is STEM workers who do not have a bachelor’s degree, referred to as the skilled technical workforce, and the other is STEM workers with a bachelor’s degree or higher. Overall, the STEM workforce was about equally split between the skilled technical workforce (49%) and workers with at least a bachelor’s degree (51%) in 2021 (figure 3-3).
Education of the STEM workforce ages 18–74, by sex, ethnicity, race, and disability: 2021
AIAN = American Indian or Alaska Native; STEM = science, technology, engineering, and mathematics.
Note(s):
Civilian noninstitutionalized population plus armed forces living off post or with their families on post. Hispanic or Latino may be any race; race categories exclude Hispanic origin. Other includes Native Hawaiian and Other Pacific Islander and more than one race. Respondents can report more than one disability. Those who reported difficulty with one or more functionalities were classified as having a disability.
Source(s):
Census Bureau, Current Population Survey, Annual Social and Economic Supplement, 2021.
Among male STEM workers, over half (57%) were employed in the skilled technical workforce, which includes workers in S&E, S&E-related, and middle-skill occupations. Conversely, nearly two-thirds (65%) of women with STEM jobs had a bachelor’s degree or higher education.
About 7 out of 10 STEM workers in two racial or ethnic groups—Hispanic (72%) and American Indian or Alaska Native (67%)—worked in the skilled technical workforce. In contrast, 86% of Asian STEM workers had a bachelor’s degree or higher, with just 14% of that group employed in the skilled technical workforce.
Among STEM workers with at least one disability, about two-thirds (65%) were employed in the skilled technical workforce, whereas STEM workers without a disability were evenly divided between the skilled technical workforce (49%) and those with at least a bachelor’s degree (51%).
Men make up three-fourths of the skilled technical workforce.
Among STEM workers in the skilled technical workforce, the share of men was three times that of women (75% vs. 25%) (figure 3-4). This pattern is similar to that of the male-female distribution of middle-skill occupations (figure 3-2). The higher share of women in the skilled technical workforce relates to the inclusion of workers across all three broad categories of STEM occupations—S&E, S&E-related, and middle-skill occupations—and the high share of women (65%) in S&E-related occupations (figure 3-2). Compared with the skilled technical workforce, the distribution by sex in STEM occupations with a bachelor’s degree or higher was more evenly split: 55% male and 45% female.
The share of underrepresented minorities—Hispanics, Blacks, and American Indians or Alaska Natives—in the skilled technical workforce (32%) was twice the share of underrepresented minorities employed in STEM occupations with a bachelor’s degree or higher (16%).
Over one in five (22%) employed in the skilled technical workforce were Hispanic, notably higher than the share of Hispanic workers employed in STEM jobs with at least a bachelor’s degree (8%). Conversely, Asian workers made up 17% of those employed in STEM with a bachelor’s degree or higher, about five times their share in the skilled technical workforce (3%).
The share of workers with at least one disability was similarly low across the two education levels (2% with a bachelor’s degree or higher and 4% in the skilled technical workforce).
Characteristics of the STEM workforce ages 18–74, by education: 2021
AIAN = American Indian or Alaska Native; STEM = science, technology, engineering, and mathematics.
Note(s):
Civilian noninstitutionalized population plus armed forces living off post or with their families on post. Hispanic or Latino may be any race; race categories exclude Hispanic origin. Other includes Native Hawaiian and Other Pacific Islander and more than one race. Respondents can report more than one disability. Those who reported difficulty with one or more functionalities were classified as having a disability.
Source(s):
Census Bureau, Current Population Survey, Annual Social and Economic Supplement, 2021.