Report
Graduate Enrollment in Science and Engineering
Overview
Although a bachelor’s degree in a science and engineering (S&E) field can open doors to a variety of occupations, a master’s or doctoral degree is required for employment or advancement in some S&E professions. Using data from the National Center for Science and Engineering Statistics’ (NCSES’s) Survey of Graduate Students and Postdoctorates in Science and Engineering (GSS), this section reports on the enrollment of women and underrepresented racial and ethnic minorities in S&E master’s and doctoral programs from fall 2017 through fall 2021. The data show that the gap between men and women in S&E graduate enrollment is shrinking. Women are concentrated in social and behavioral sciences, and the lower rate of federal funding for graduate students in these fields contributes to a slightly lower share of female graduate students receiving federal financial support. Students who are Hispanic or Latino, Black or African American, and American Indian or Alaska Native are underrepresented among S&E graduate students, and students who are Hispanic or Black are especially underrepresented at the doctoral level. These students from underrepresented minority groups have higher enrollment rates in graduate programs in social and behavioral sciences compared with other S&E fields. A significantly lower share of Black students are enrolled full time, compared with students from other races and ethnicities. During the COVID-19 pandemic, overall S&E graduate enrollment experienced slowing growth in 2020 and accelerating growth in 2021.
For the GSS, the analysis of graduate student enrollment and funding by sex pertains to all individuals, whereas analysis by race and ethnicity applies only to U.S. citizens and permanent residents. Student disability status is not available in the survey data. Starting in 2017, the fields of study in the GSS were updated, limiting comparability with earlier data (see the “Technical Notes” section for details). The year of the data refers to the fall semester of the academic year; for example, data reported for 2021 are for fall 2021.
Overall Enrollment by Women
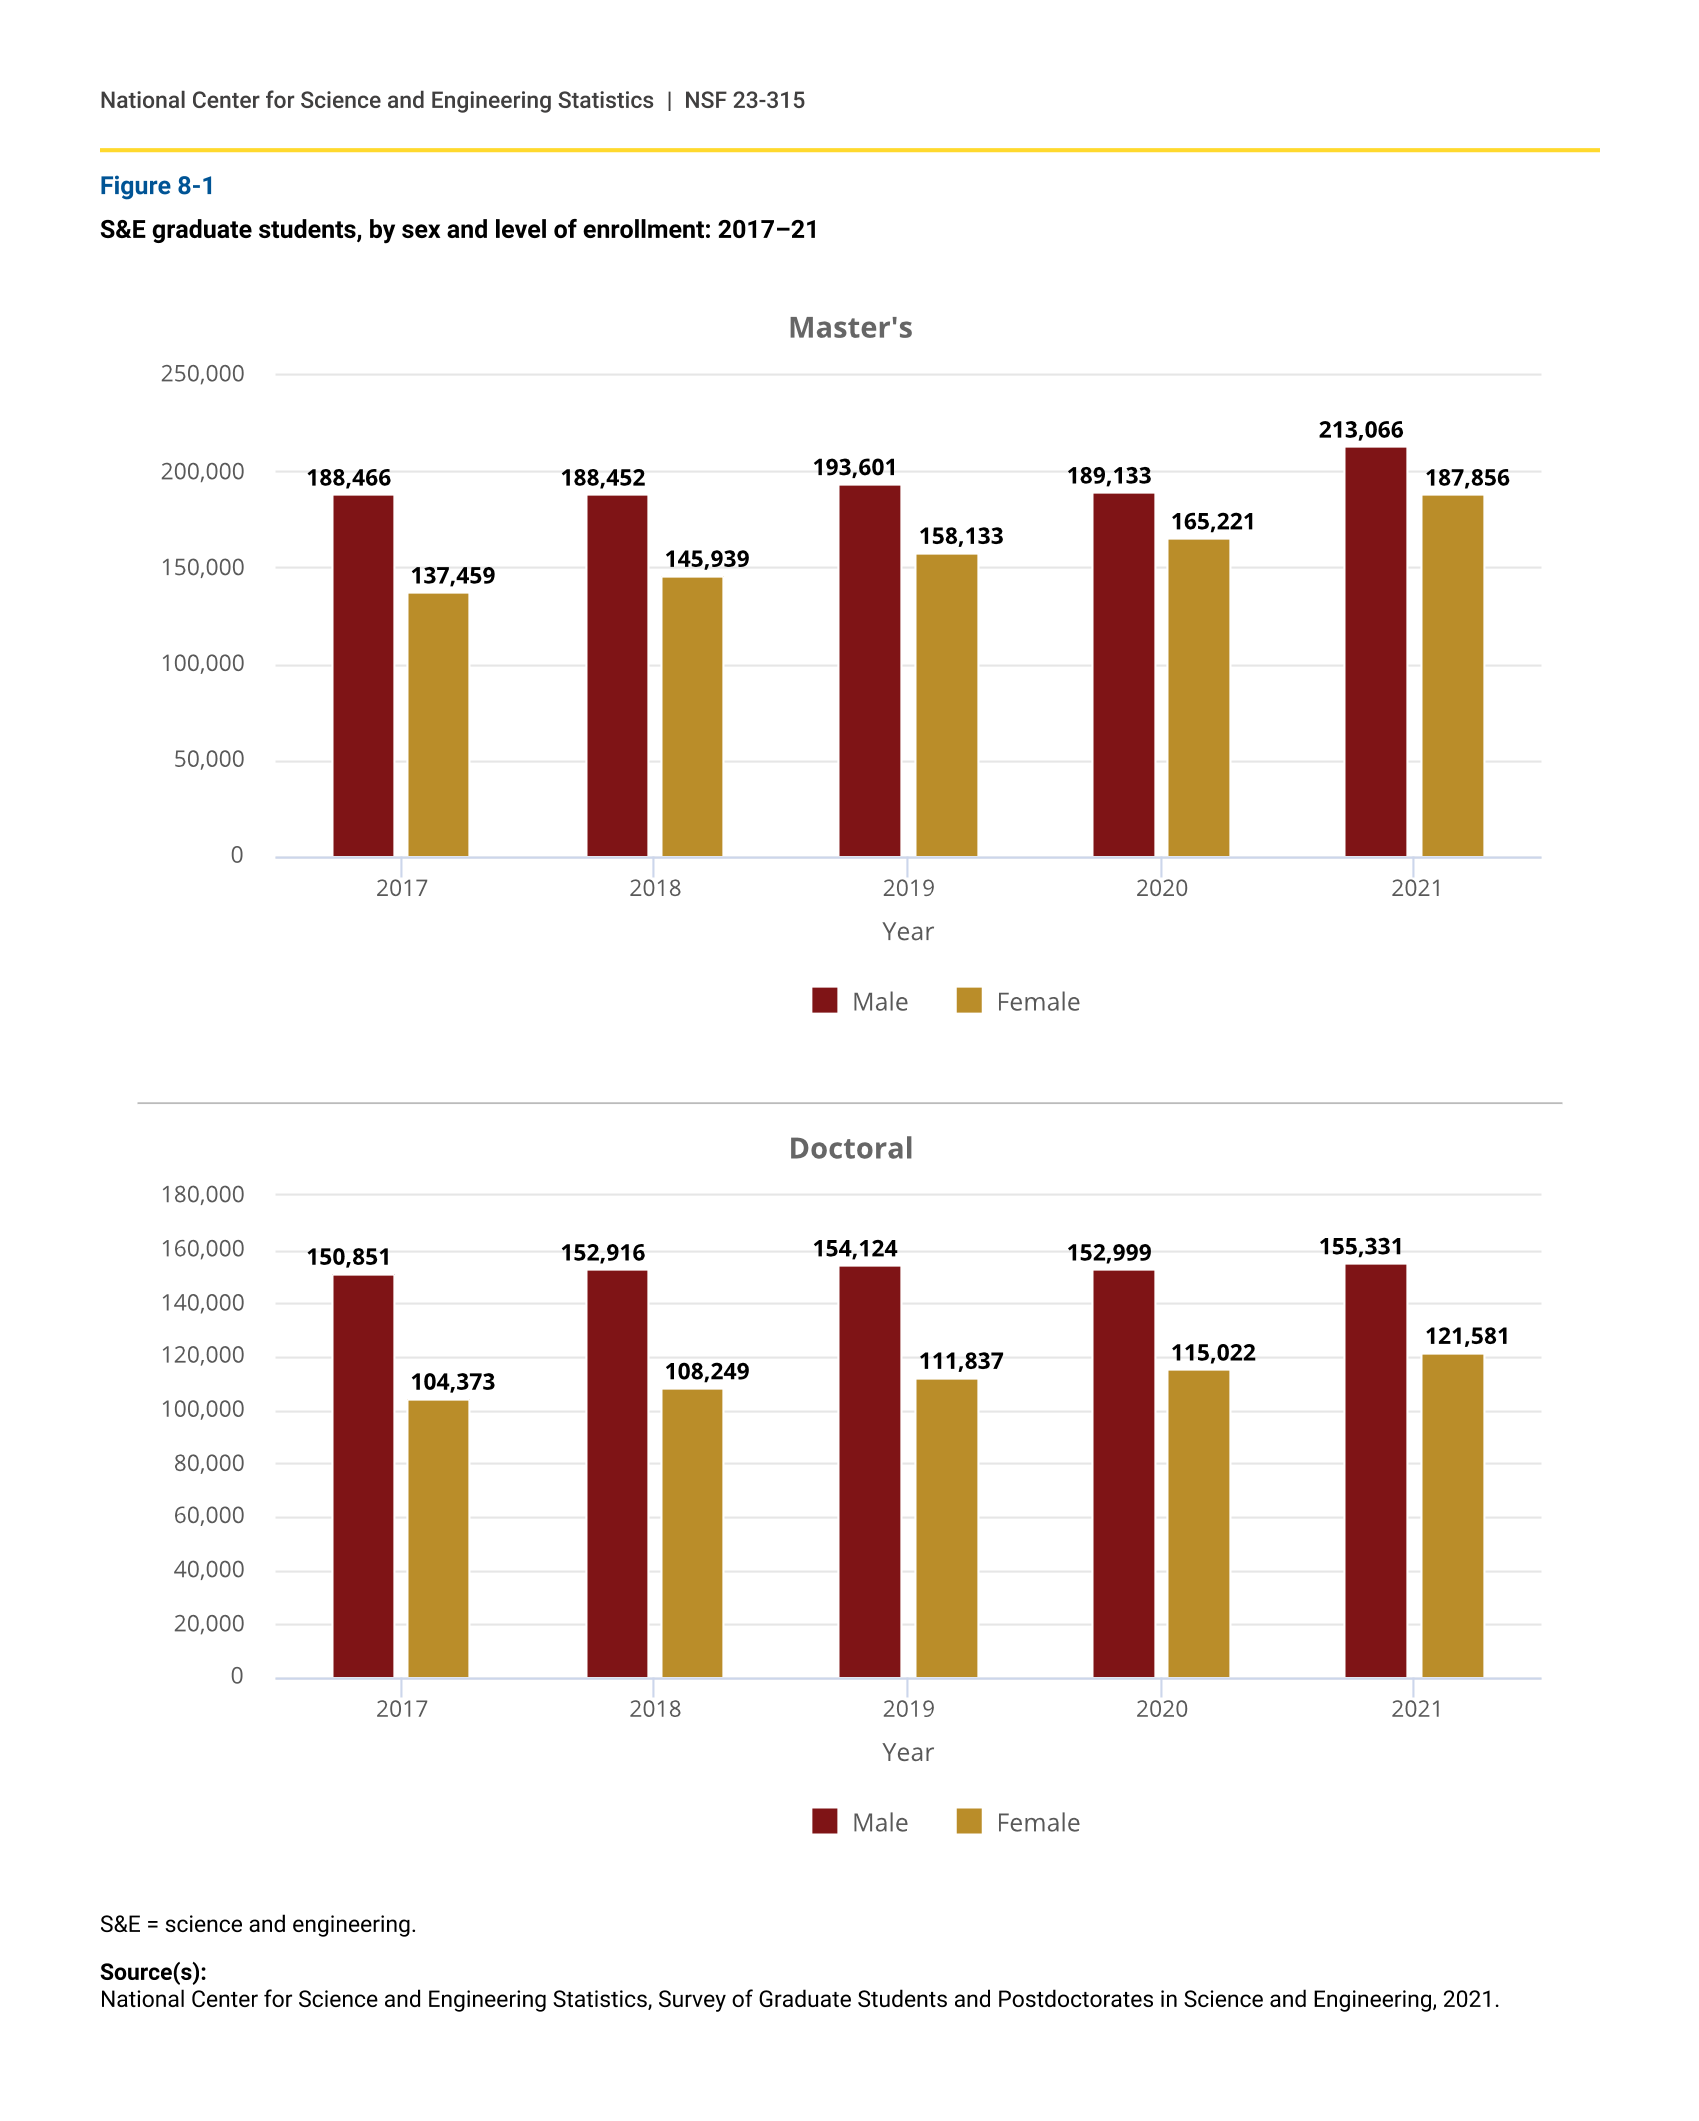
The number of women enrolled in S&E graduate programs increased from 2017 to 2021.
Between 2017 and 2021, the number of women enrolled in S&E master’s programs increased by 37% (from 137,000 to 188,000), and the number of women in doctoral programs grew by 16% (from 104,000 to 122,000) (figure 8-1). Men outnumber women at both degree levels, but the enrollment gap has decreased due to faster growth in enrollment of women. In 2021, 47% of S&E master’s students and 44% of doctoral students were female, compared with 42% and 41% in 2017. Female enrollment exhibited small growth from 2019 to 2020 but especially large growth from 2020 to 2021, suggesting that the COVID-19 pandemic did not have long-term adverse effects on women’s overall enrollment in S&E graduate programs.
Enrollment of Women in S&E Fields
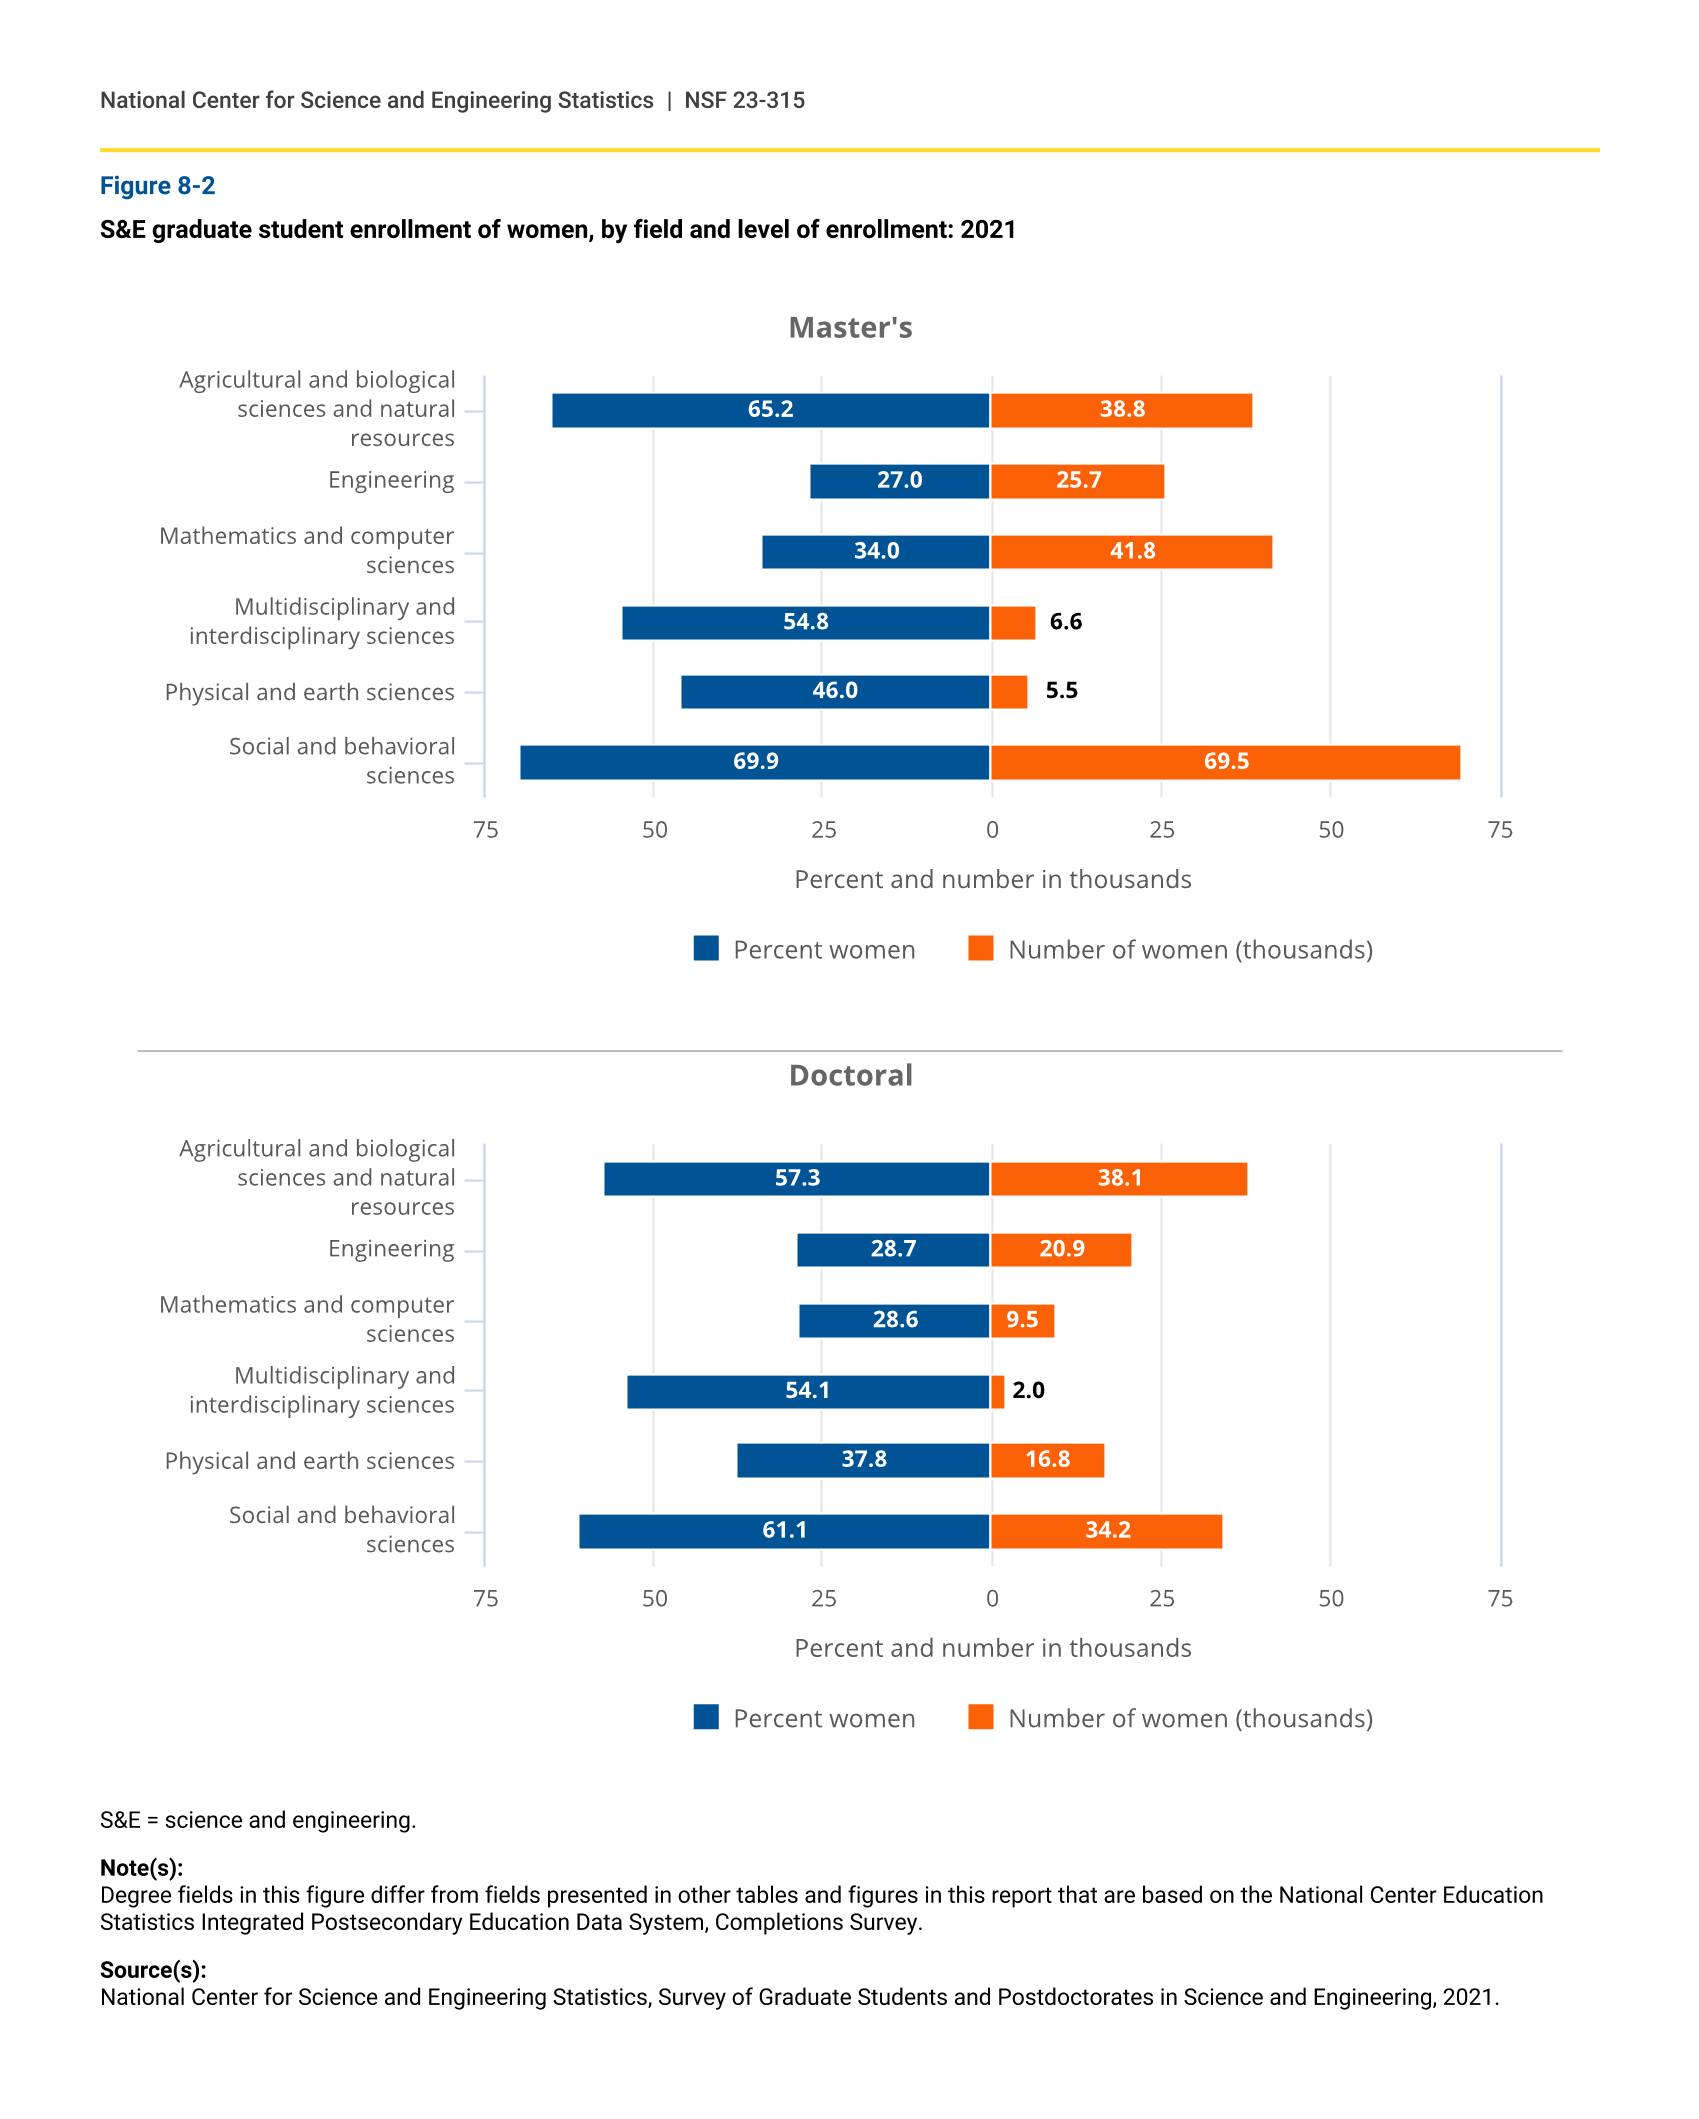
Women account for the highest share of S&E graduate student enrollment in social and behavioral sciences and the lowest share in engineering and in mathematics and computer sciences.
In 2021, the largest number of women (70,000) were enrolled in programs at the master’s level in social and behavioral sciences (figure 8-2). About 42,000 women were master’s degree students in mathematics and computer sciences, which was the second-largest field for female students. At the doctoral level, enrollment of women was highest in agricultural and biological sciences and natural resources (38,000), followed by social and behavioral sciences (34,000).
S&E graduate students, by sex and level of enrollment: 2017–21
| Year | Male | Female |
|---|---|---|
| 2017 | 188,466 | 137,459 |
| 2018 | 188,452 | 145,939 |
| 2019 | 193,601 | 158,133 |
| 2020 | 189,133 | 165,221 |
| 2021 | 213,066 | 187,856 |
| Year | Male | Female |
|---|---|---|
| 2017 | 150,851 | 104,373 |
| 2018 | 152,916 | 108,249 |
| 2019 | 154,124 | 111,837 |
| 2020 | 152,999 | 115,022 |
| 2021 | 155,331 | 121,581 |
S&E = science and engineering.
Source(s):
National Center for Science and Engineering Statistics, Survey of Graduate Students and Postdoctorates in Science and Engineering, 2021.
S&E graduate student enrollment of women, by field and level of enrollment: 2021
| Field | Percent women | Number of women (thousands) |
|---|---|---|
| Agricultural and biological sciences and natural resources | 65.2 | 38.8 |
| Engineering | 27.0 | 25.7 |
| Mathematics and computer sciences | 34.0 | 41.8 |
| Multidisciplinary and interdisciplinary sciences | 54.8 | 6.6 |
| Physical and earth sciences | 46.0 | 5.5 |
| Social and behavioral sciences | 69.9 | 69.5 |
| Field | Percent women | Number of women (thousands) |
|---|---|---|
| Agricultural and biological sciences and natural resources | 57.3 | 38.1 |
| Engineering | 28.7 | 20.9 |
| Mathematics and computer sciences | 28.6 | 9.5 |
| Multidisciplinary and interdisciplinary sciences | 54.1 | 2.0 |
| Physical and earth sciences | 37.8 | 16.8 |
| Social and behavioral sciences | 61.1 | 34.2 |
S&E = science and engineering.
Note(s):
Degree fields in this figure differ from fields presented in other tables and figures in this report that are based on the National Center Education Statistics Integrated Postsecondary Education Data System, Completions Survey.
Source(s):
National Center for Science and Engineering Statistics, Survey of Graduate Students and Postdoctorates in Science and Engineering, 2021.
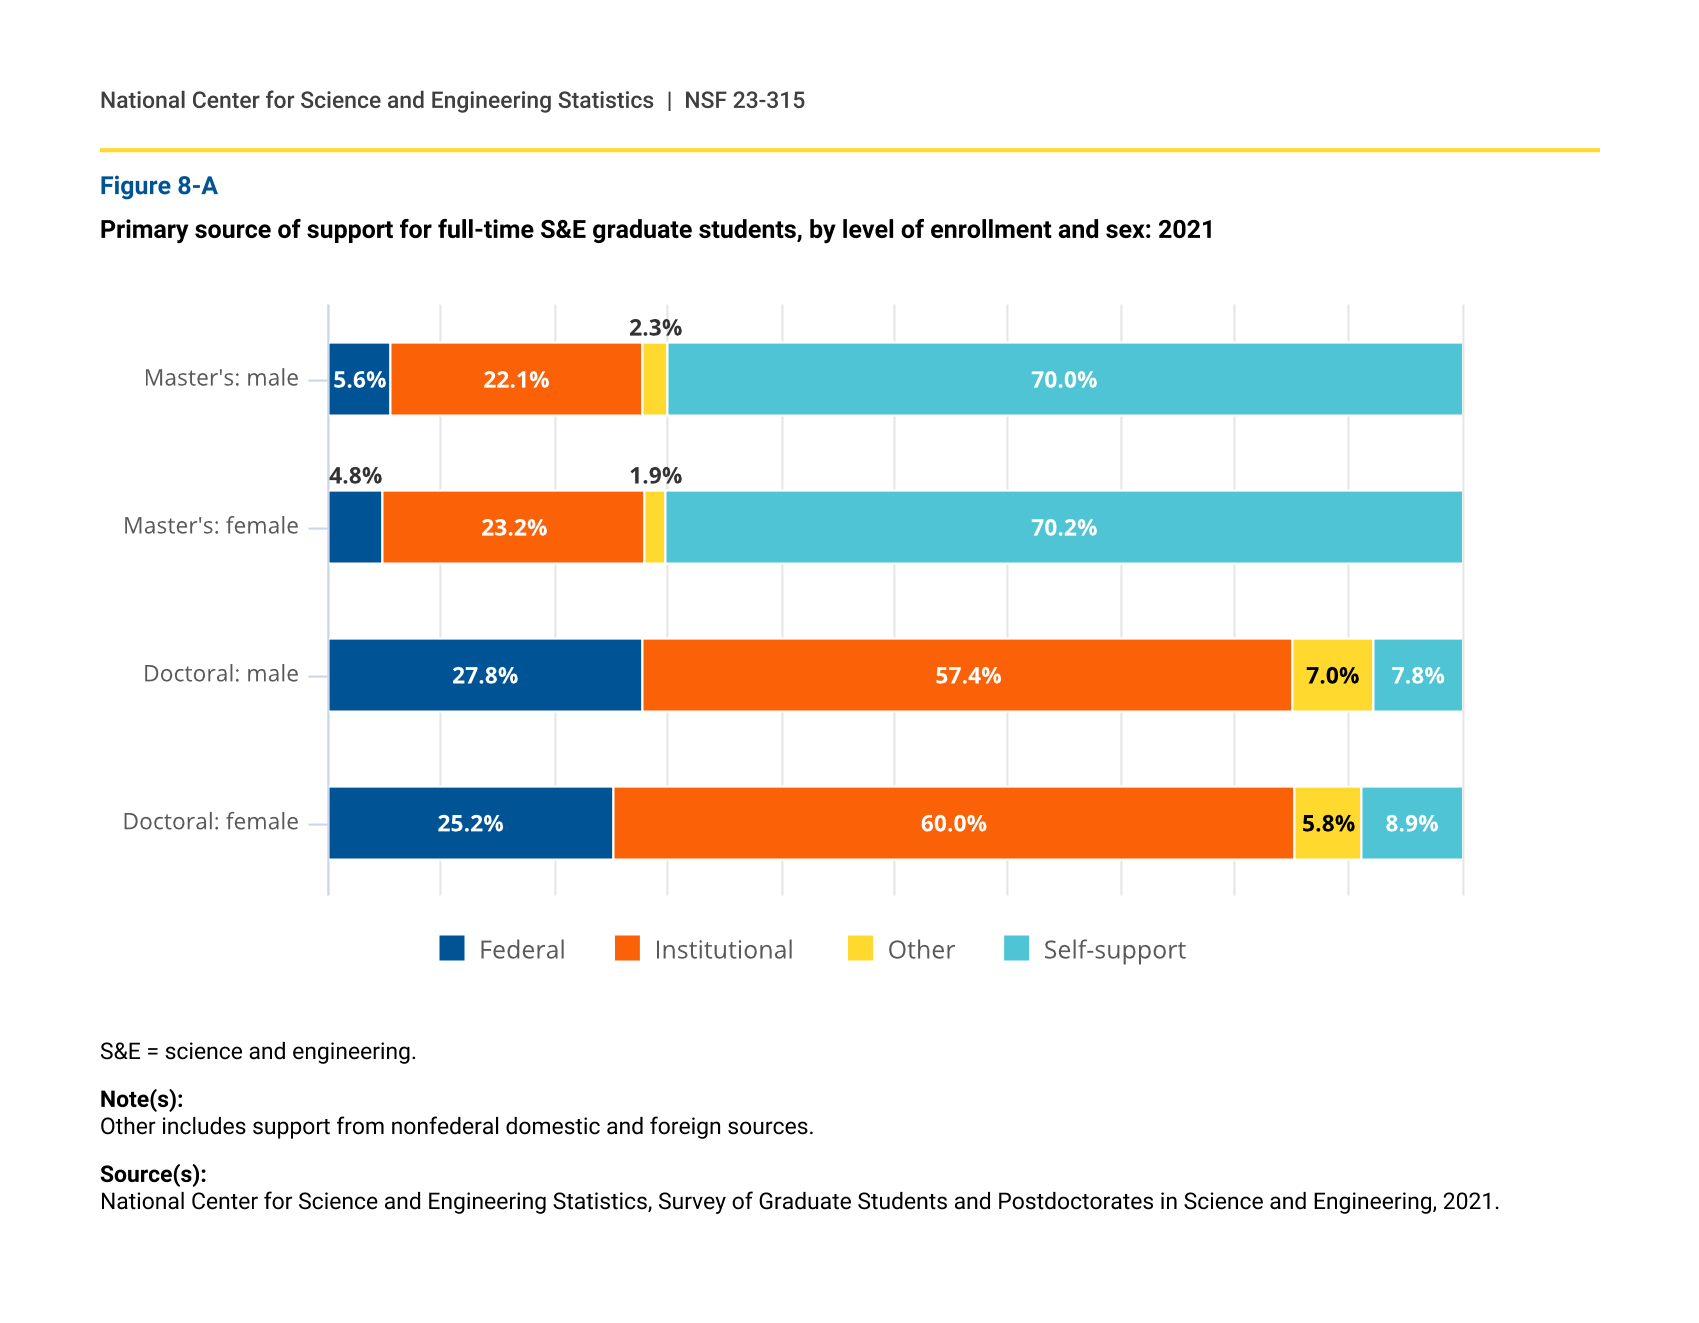
Women accounted for the highest share of S&E graduate enrollment in social and behavioral sciences, where they were 70% of master’s and 61% of doctoral students (figure 8-2). This concentration of women in social and behavioral sciences contributes to the disparity in federal support between male and female graduate students (see sidebar Sources of Support for S&E Graduate Education of Women). Women were also a majority of graduate students in agricultural and biological sciences and natural resources at both the master’s (65%) and doctoral (57%) levels, and slightly more than half of master’s and doctoral students in multidisciplinary and interdisciplinary sciences. However, women’s share of enrollment was 27% in engineering and 34% in mathematics and computer sciences at the master’s level, and their share was 29% for each of these fields at the doctoral level.
Overall Minority Enrollment
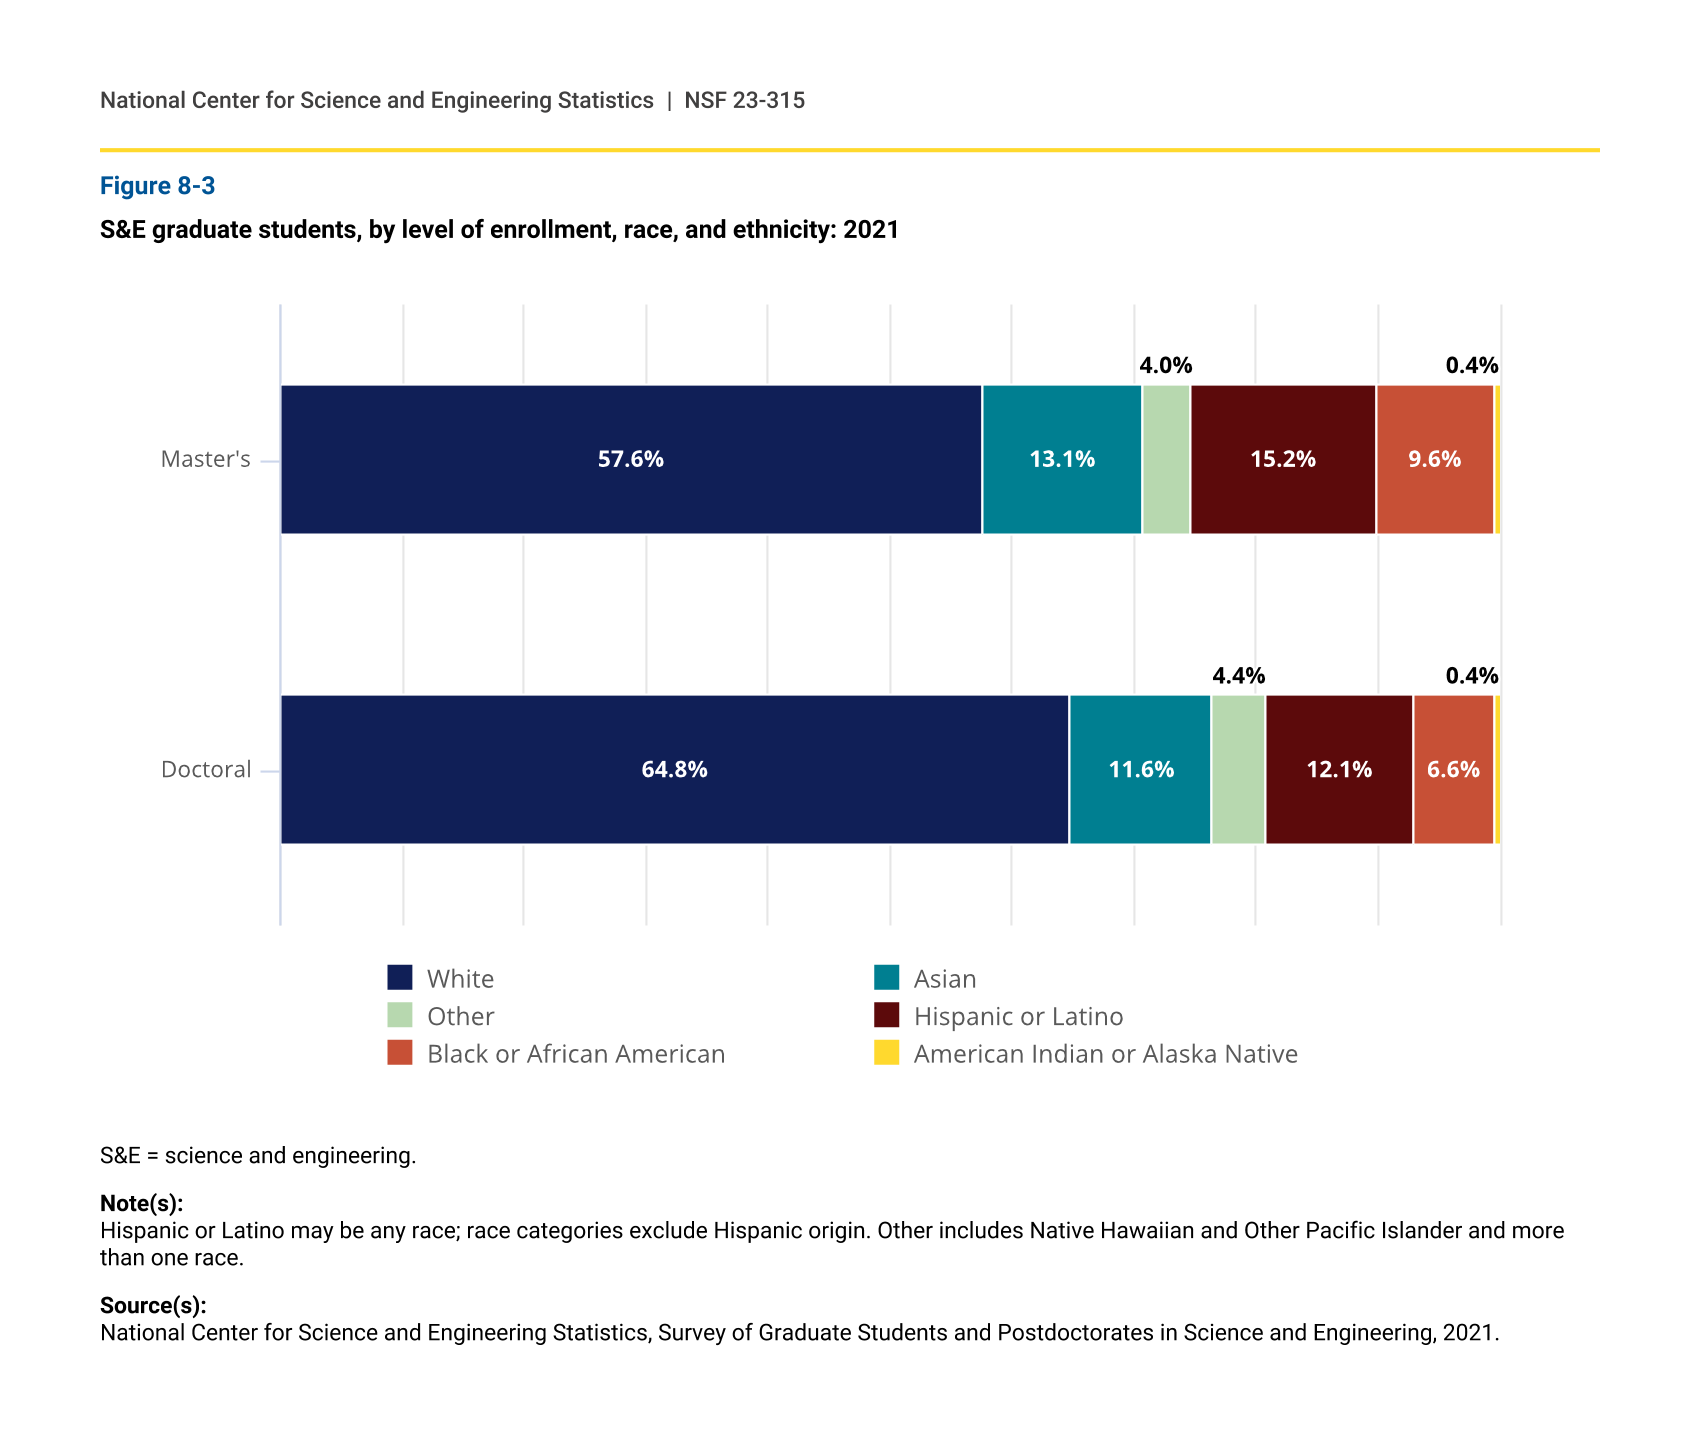
Hispanic, Black, and American Indian or Alaska Native students are underrepresented among S&E graduate students.
Racial and ethnic disparities in S&E graduate enrollment parallel those disparities among S&E degree recipients. White and Asian students are overrepresented among S&E graduate students, and Hispanic, Black, and American Indian or Alaska Native students are underrepresented (figure 8-3). The disparity is more pronounced at the doctoral level, where each underrepresented minority group accounts for a share of enrolled students that is roughly half its share of the 18- to 34-year-old population (figure 7-B). Collectively, underrepresented minorities were 37% of the college-age population but 25% of S&E master’s students and 19% of S&E doctoral students in 2021.
S&E graduate students, by level of enrollment, race, and ethnicity: 2021
| Enrollment level | White | Asian | Other | Hispanic or Latino | Black or African American | American Indian or Alaska Native |
|---|---|---|---|---|---|---|
| Master's | 57.6 | 13.1 | 4.0 | 15.2 | 9.6 | 0.4 |
| Doctoral | 64.8 | 11.6 | 4.4 | 12.1 | 6.6 | 0.4 |
S&E = science and engineering.
Note(s):
Hispanic or Latino may be any race; race categories exclude Hispanic origin. Other includes Native Hawaiian and Other Pacific Islander and more than one race.
Source(s):
National Center for Science and Engineering Statistics, Survey of Graduate Students and Postdoctorates in Science and Engineering, 2021.
Overall S&E graduate enrollment of underrepresented minorities increased in recent years, primarily due to expanding enrollment of Hispanic students.
Total S&E graduate enrollment from underrepresented minorities grew from 66,000 in 2017 to 97,000 in 2021 (figure 8-4). Hispanic enrollment grew most rapidly during this period, increasing by 56%, compared with 36% growth in Black enrollment and 11% growth in enrollment of American Indian or Alaska Native students.
S&E graduate students from underrepresented minority groups, by race and ethnicity: 2017–21
| Year | Hispanic or Latino | Black or African American | American Indian or Alaska Native |
|---|---|---|---|
| 2017 | 37,920 | 26,399 | 1,555 |
| 2018 | 41,833 | 28,879 | 1,614 |
| 2019 | 46,836 | 30,670 | 1,768 |
| 2020 | 53,349 | 33,634 | 1,707 |
| 2021 | 59,164 | 35,868 | 1,729 |
S&E = science and engineering.
Note(s):
Hispanic or Latino may be any race; race categories exclude Hispanic origin.
Source(s):
National Center for Science and Engineering Statistics, Survey of Graduate Students and Postdoctorates in Science and Engineering.
Total S&E graduate enrollment among persons from underrepresented minority groups increased by 12% from 2019 to 2020, a higher rate of growth than the preceding years, suggesting that the first year of the COVID-19 pandemic did not negatively affect overall minority enrollment. However, S&E graduate enrollment of underrepresented minority students increased by a smaller amount (9%) from 2020 to 2021.
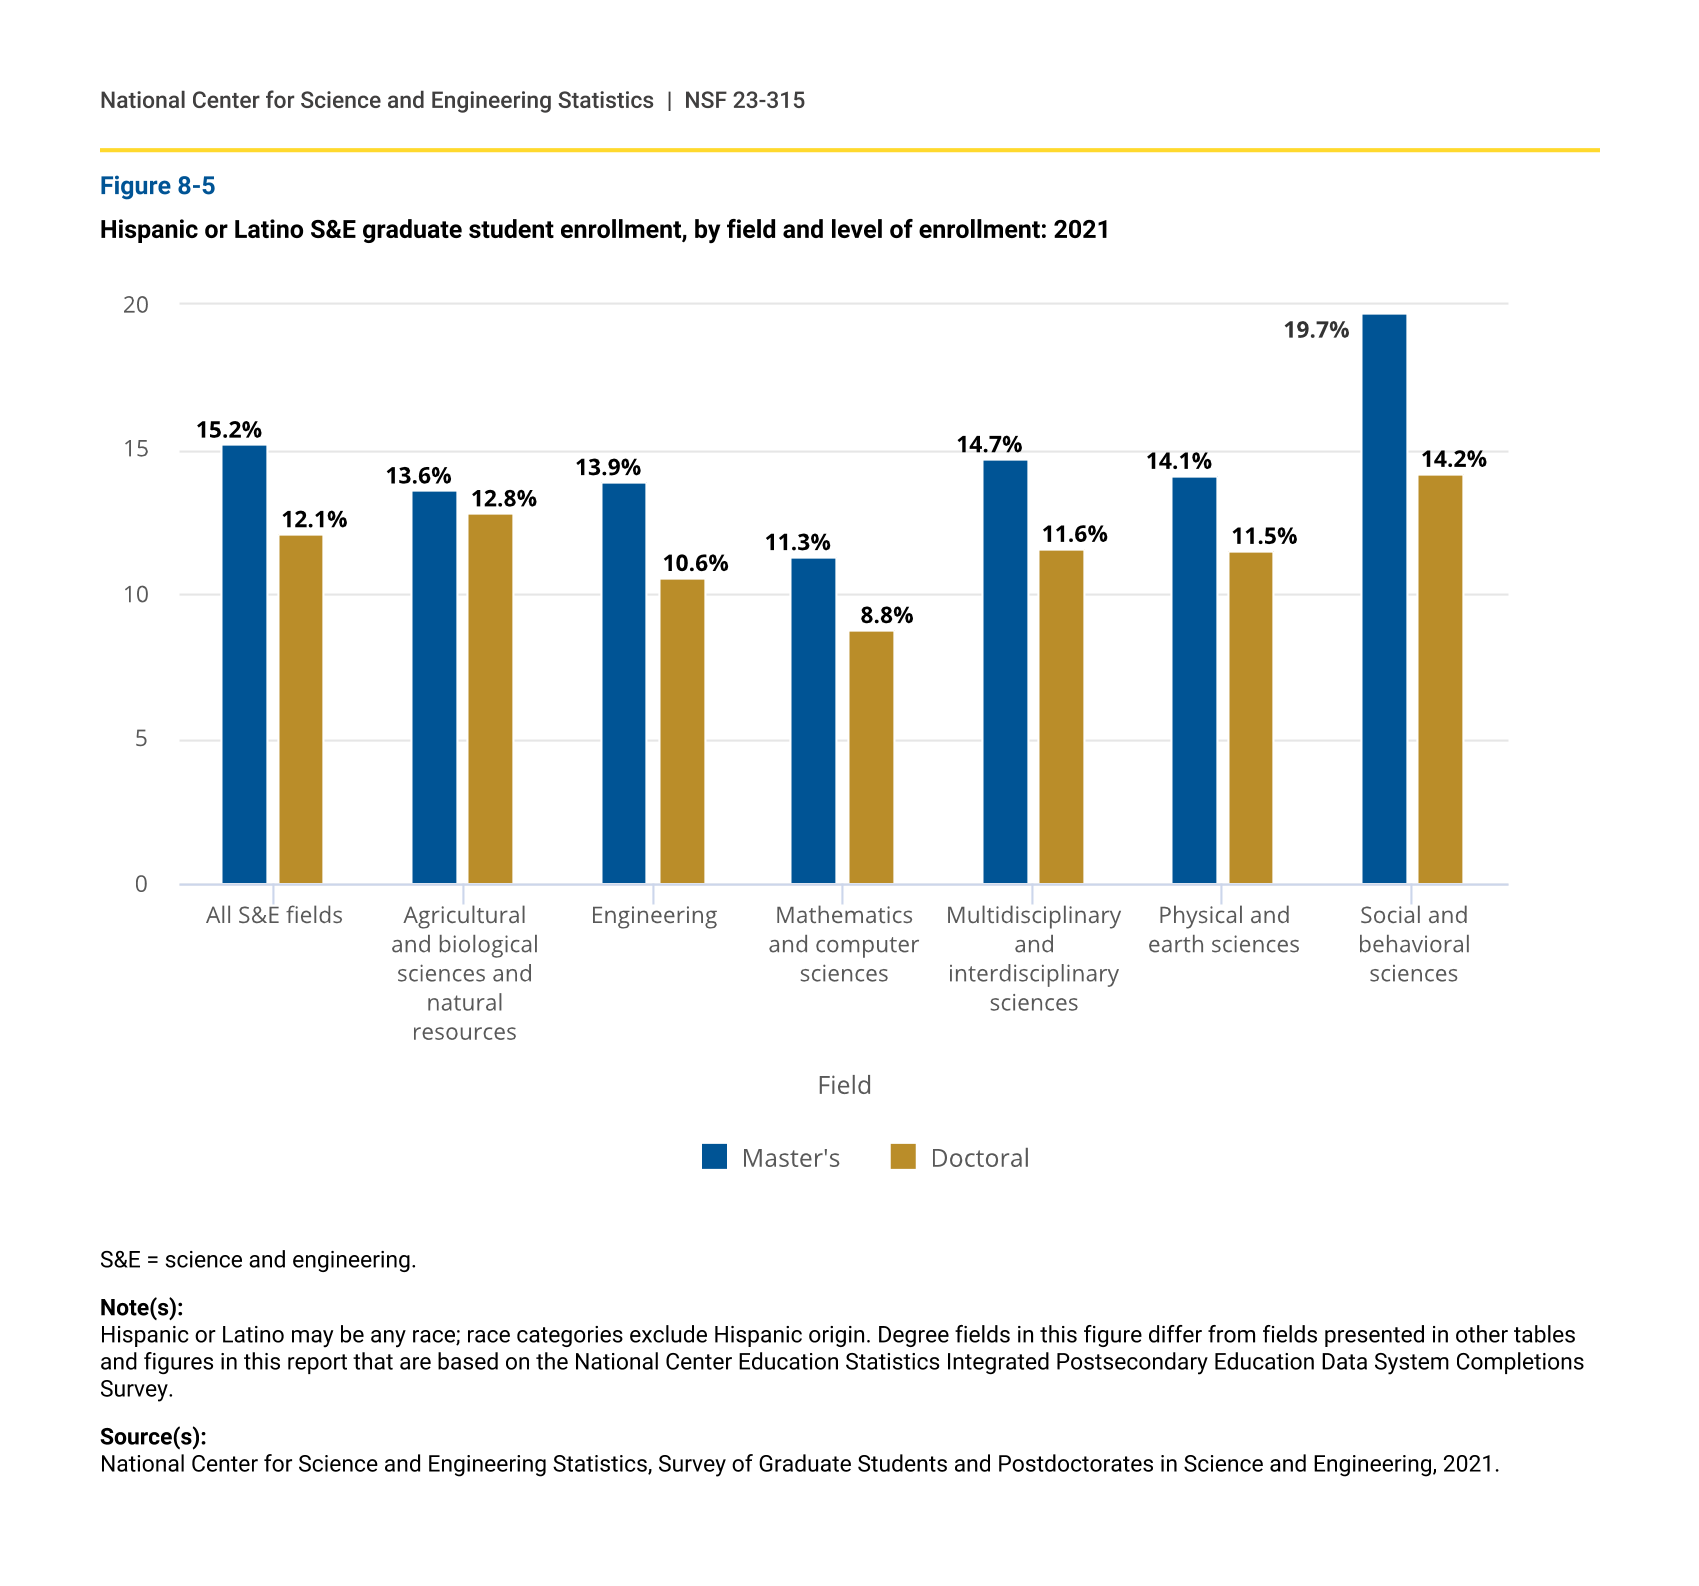
Enrollment of Hispanic or Latino Students by S&E Field
Representation of Hispanic graduate students is highest in social and behavioral sciences and lowest in mathematics and computer sciences.
Like students from other underrepresented groups, Hispanic graduate students are concentrated in social and behavioral sciences at both the master’s (20% of students in 2021) and doctoral (14%) levels (figure 8-5). Hispanic representation was lowest in mathematics and computer sciences: 11% of master’s students and 9% of doctoral students were Hispanic.
Hispanic or Latino S&E graduate student enrollment, by field and level of enrollment: 2021
| Field | Master's | Doctoral |
|---|---|---|
| All S&E fields | 15.2 | 12.1 |
| Agricultural and biological sciences and natural resources | 13.6 | 12.8 |
| Engineering | 13.9 | 10.6 |
| Mathematics and computer sciences | 11.3 | 8.8 |
| Multidisciplinary and interdisciplinary sciences | 14.7 | 11.6 |
| Physical and earth sciences | 14.1 | 11.5 |
| Social and behavioral sciences | 19.7 | 14.2 |
S&E = science and engineering.
Note(s):
Hispanic or Latino may be any race; race categories exclude Hispanic origin. Degree fields in this figure differ from fields presented in other tables and figures in this report that are based on the National Center Education Statistics Integrated Postsecondary Education Data System Completions Survey.
Source(s):
National Center for Science and Engineering Statistics, Survey of Graduate Students and Postdoctorates in Science and Engineering, 2021.
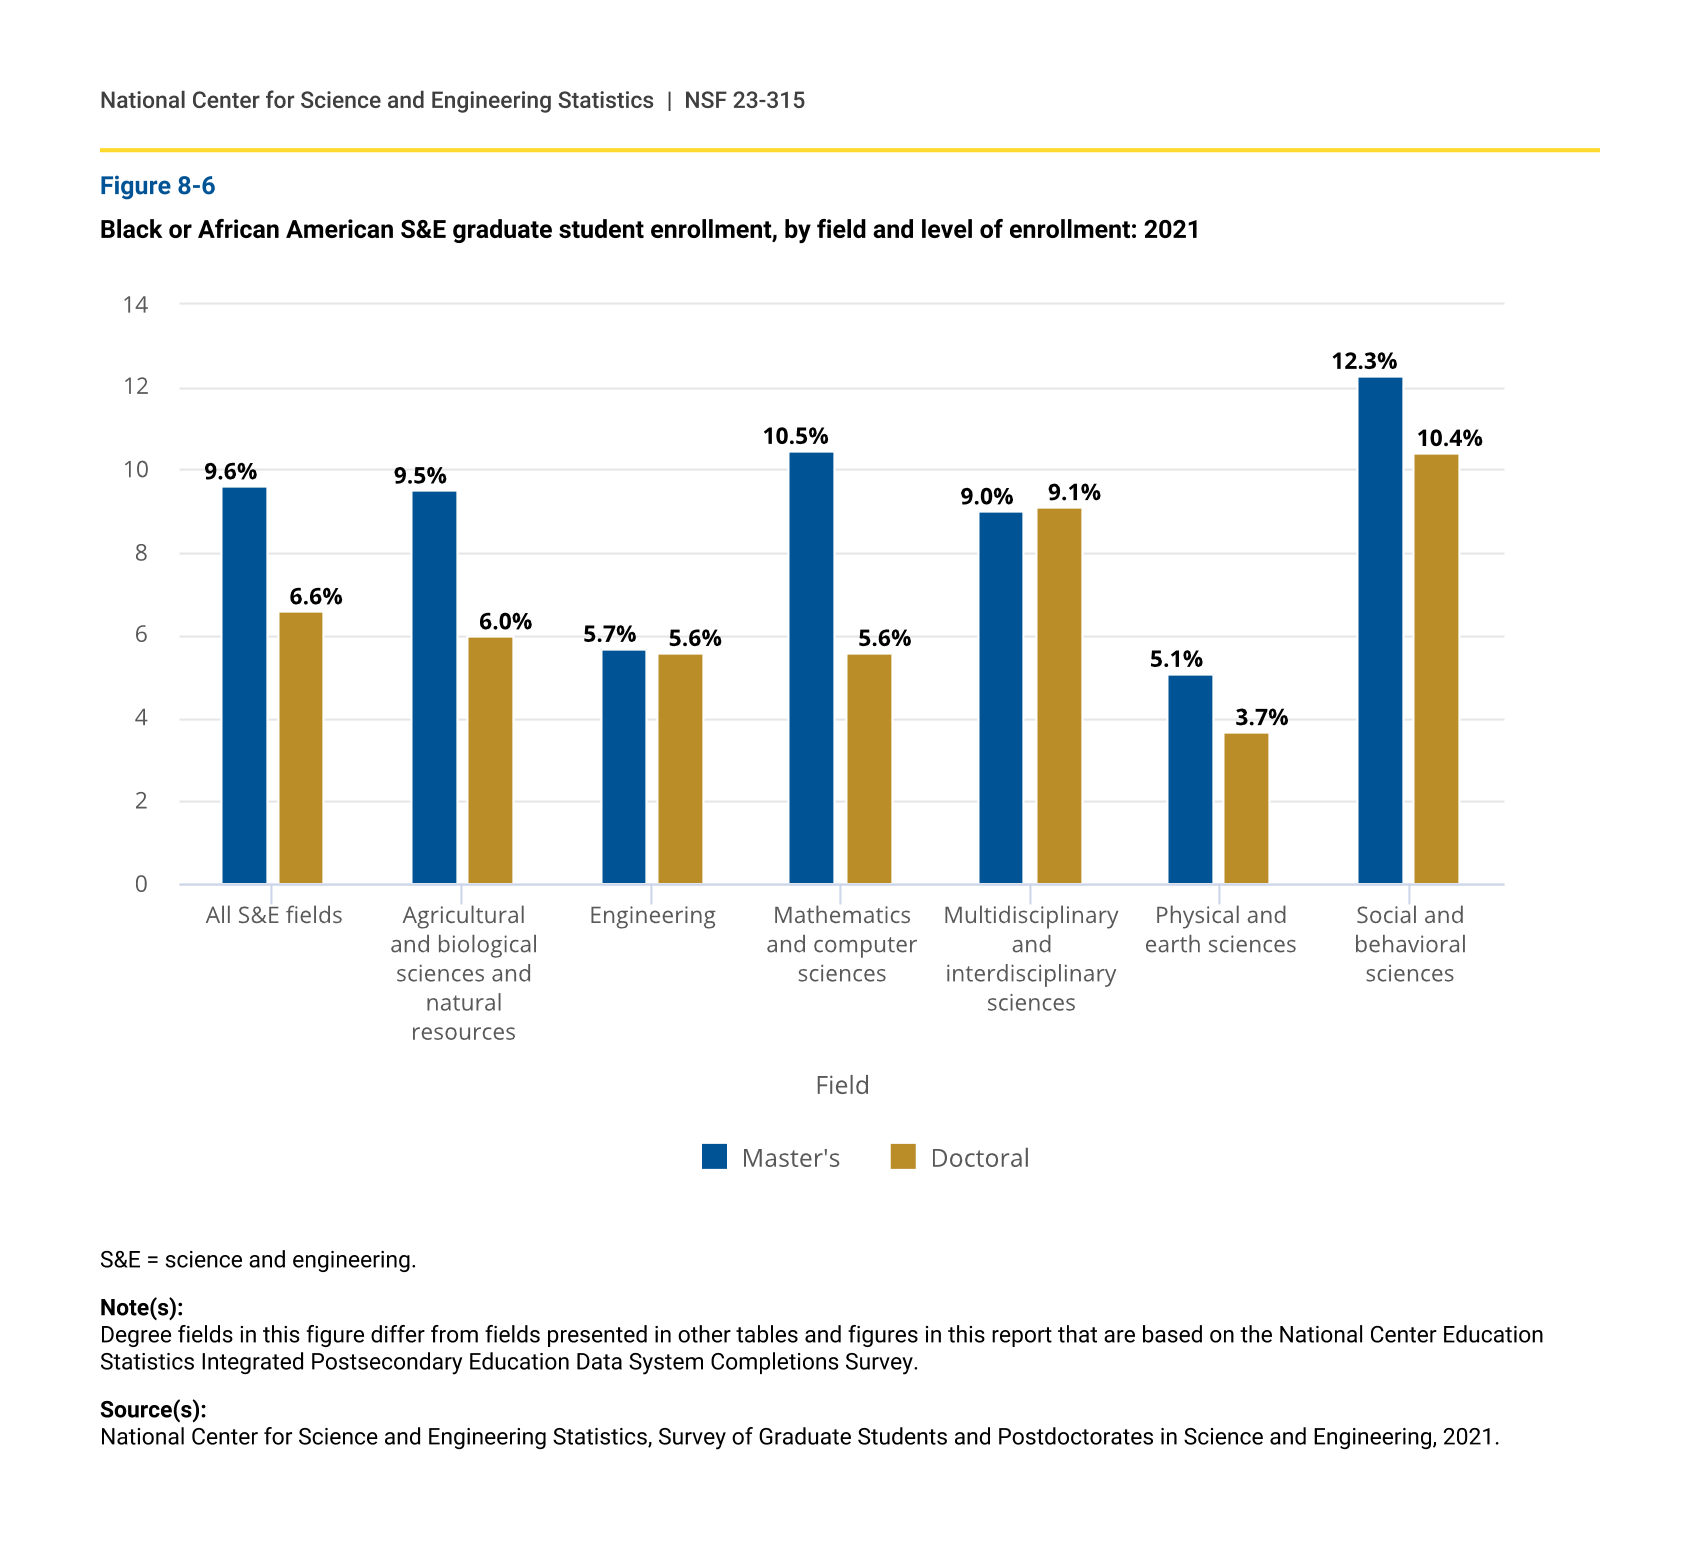
Enrollment of Black or African American Students by S&E Field
Black graduate students are concentrated in social and behavioral sciences at both degree levels and in mathematics and computer sciences at the master’s level only.
At the master’s level, the proportion of graduate students who are Black in social or behavioral sciences (12%) and mathematics and computer sciences (11%) was higher than the average Black representation across all S&E fields (figure 8-6). Black representation among master’s students was lowest in engineering (6%) and physical and earth sciences (5%). Patterns of Black enrollment are slightly different at the doctoral level. Black students were most prevalent in social or behavioral sciences (10%) and multidisciplinary sciences (9%) and had the lowest representation in physical and earth sciences (4%). In terms of enrollment status, Black graduate students in S&E fields are less frequently enrolled on a full-time basis compared with students from other racial and ethnic groups (see sidebar Minority S&E Graduate Student Enrollment Status).
Black or African American S&E graduate student enrollment, by field and level of enrollment: 2021
| Field | Master's | Doctoral |
|---|---|---|
| All S&E fields | 9.6 | 6.6 |
| Agricultural and biological sciences and natural resources | 9.5 | 6.0 |
| Engineering | 5.7 | 5.6 |
| Mathematics and computer sciences | 10.5 | 5.6 |
| Multidisciplinary and interdisciplinary sciences | 9.0 | 9.1 |
| Physical and earth sciences | 5.1 | 3.7 |
| Social and behavioral sciences | 12.3 | 10.4 |
S&E = science and engineering.
Note(s):
Degree fields in this figure differ from fields presented in other tables and figures in this report that are based on the National Center Education Statistics Integrated Postsecondary Education Data System Completions Survey.
Source(s):
National Center for Science and Engineering Statistics, Survey of Graduate Students and Postdoctorates in Science and Engineering, 2021.
Enrollment of American Indian or Alaska Native Students by S&E Field
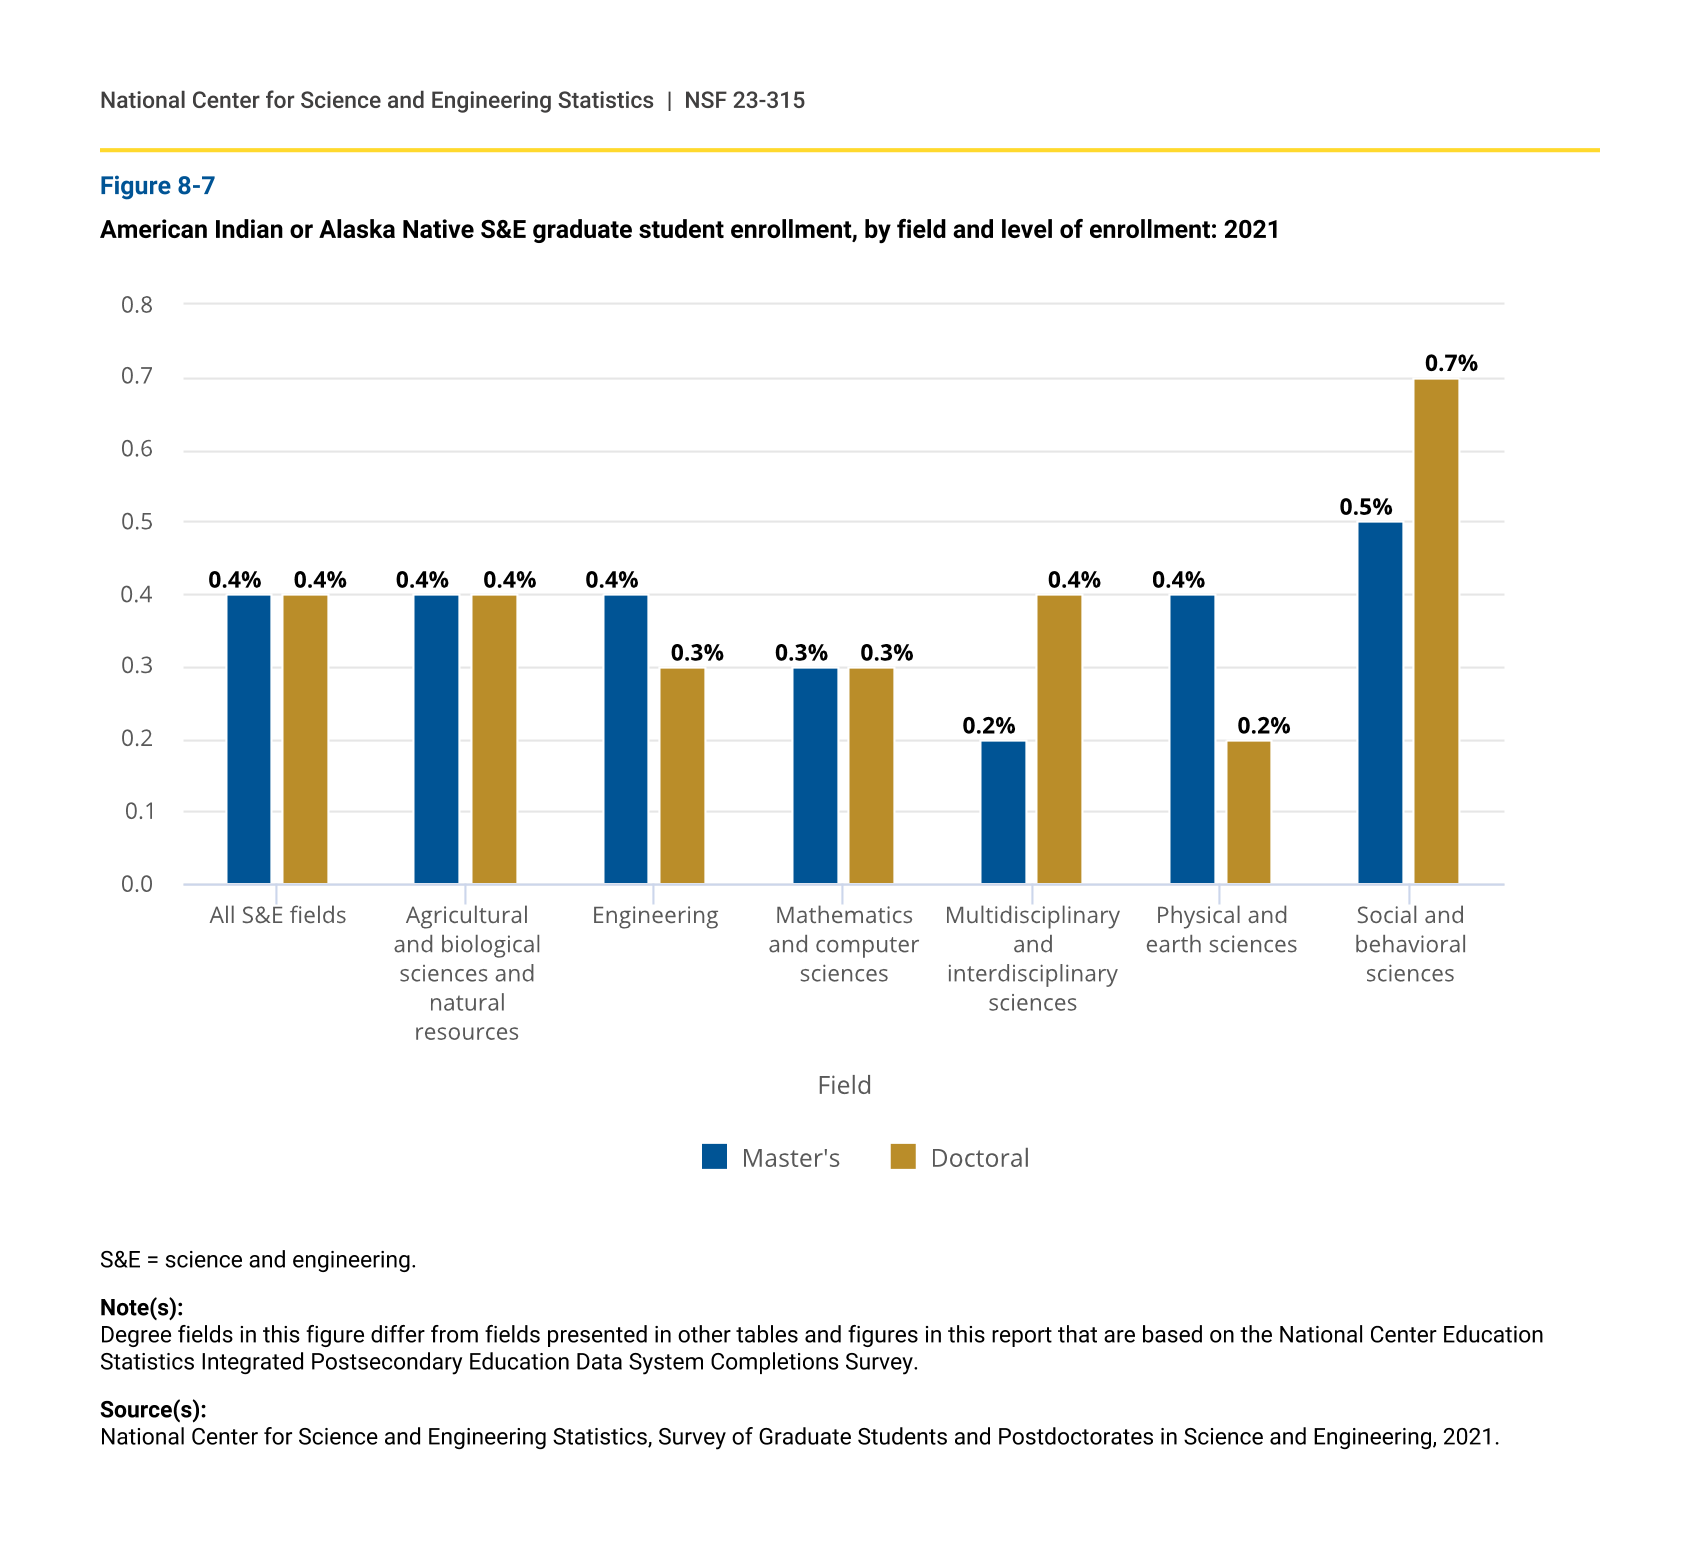
S&E graduate enrollment of American Indian or Alaska Native students is low overall but proportionately high in natural resources and conservation.
American Indian or Alaska Native graduate students accounted for 0.4% of master’s and doctoral students across all S&E fields in 2021 (figure 8-7). At the broad field of degree level, they had highest representation in social and behavioral sciences at both the master’s (0.5%) and doctoral (0.7%) levels. American Indian or Alaska Native students accounted for 0.4% of graduate students in agricultural and biological sciences and natural resources, but within this field they accounted for a relatively higher share of enrollment in natural resources and conservation: 0.9% of master’s students and 1.8% of doctoral students (table 3-1).
American Indian or Alaska Native S&E graduate student enrollment, by field and level of enrollment: 2021
| Field | Master's | Doctoral |
|---|---|---|
| All S&E fields | 0.4 | 0.4 |
| Agricultural and biological sciences and natural resources | 0.4 | 0.4 |
| Engineering | 0.4 | 0.3 |
| Mathematics and computer sciences | 0.3 | 0.3 |
| Multidisciplinary and interdisciplinary sciences | 0.2 | 0.4 |
| Physical and earth sciences | 0.4 | 0.2 |
| Social and behavioral sciences | 0.5 | 0.7 |
S&E = science and engineering.
Note(s):
Degree fields in this figure differ from fields presented in other tables and figures in this report that are based on the National Center Education Statistics Integrated Postsecondary Education Data System Completions Survey.
Source(s):
National Center for Science and Engineering Statistics, Survey of Graduate Students and Postdoctorates in Science and Engineering, 2021.