Report
Introduction
Overview
The U.S. science, technology, engineering, and mathematics (STEM) workforce fuels innovation and provides important contributions to the nation. New advancements and discoveries in science and technology are rapidly changing the world of work and increasing the demand for technically skilled employees. As this demand has increased, so has the number of STEM workers. In 2021, 34.9 million people worked in STEM occupations, up from 29.0 million in 2011. Today, nearly a quarter (24%) of the U.S. workforce is employed in STEM occupations.
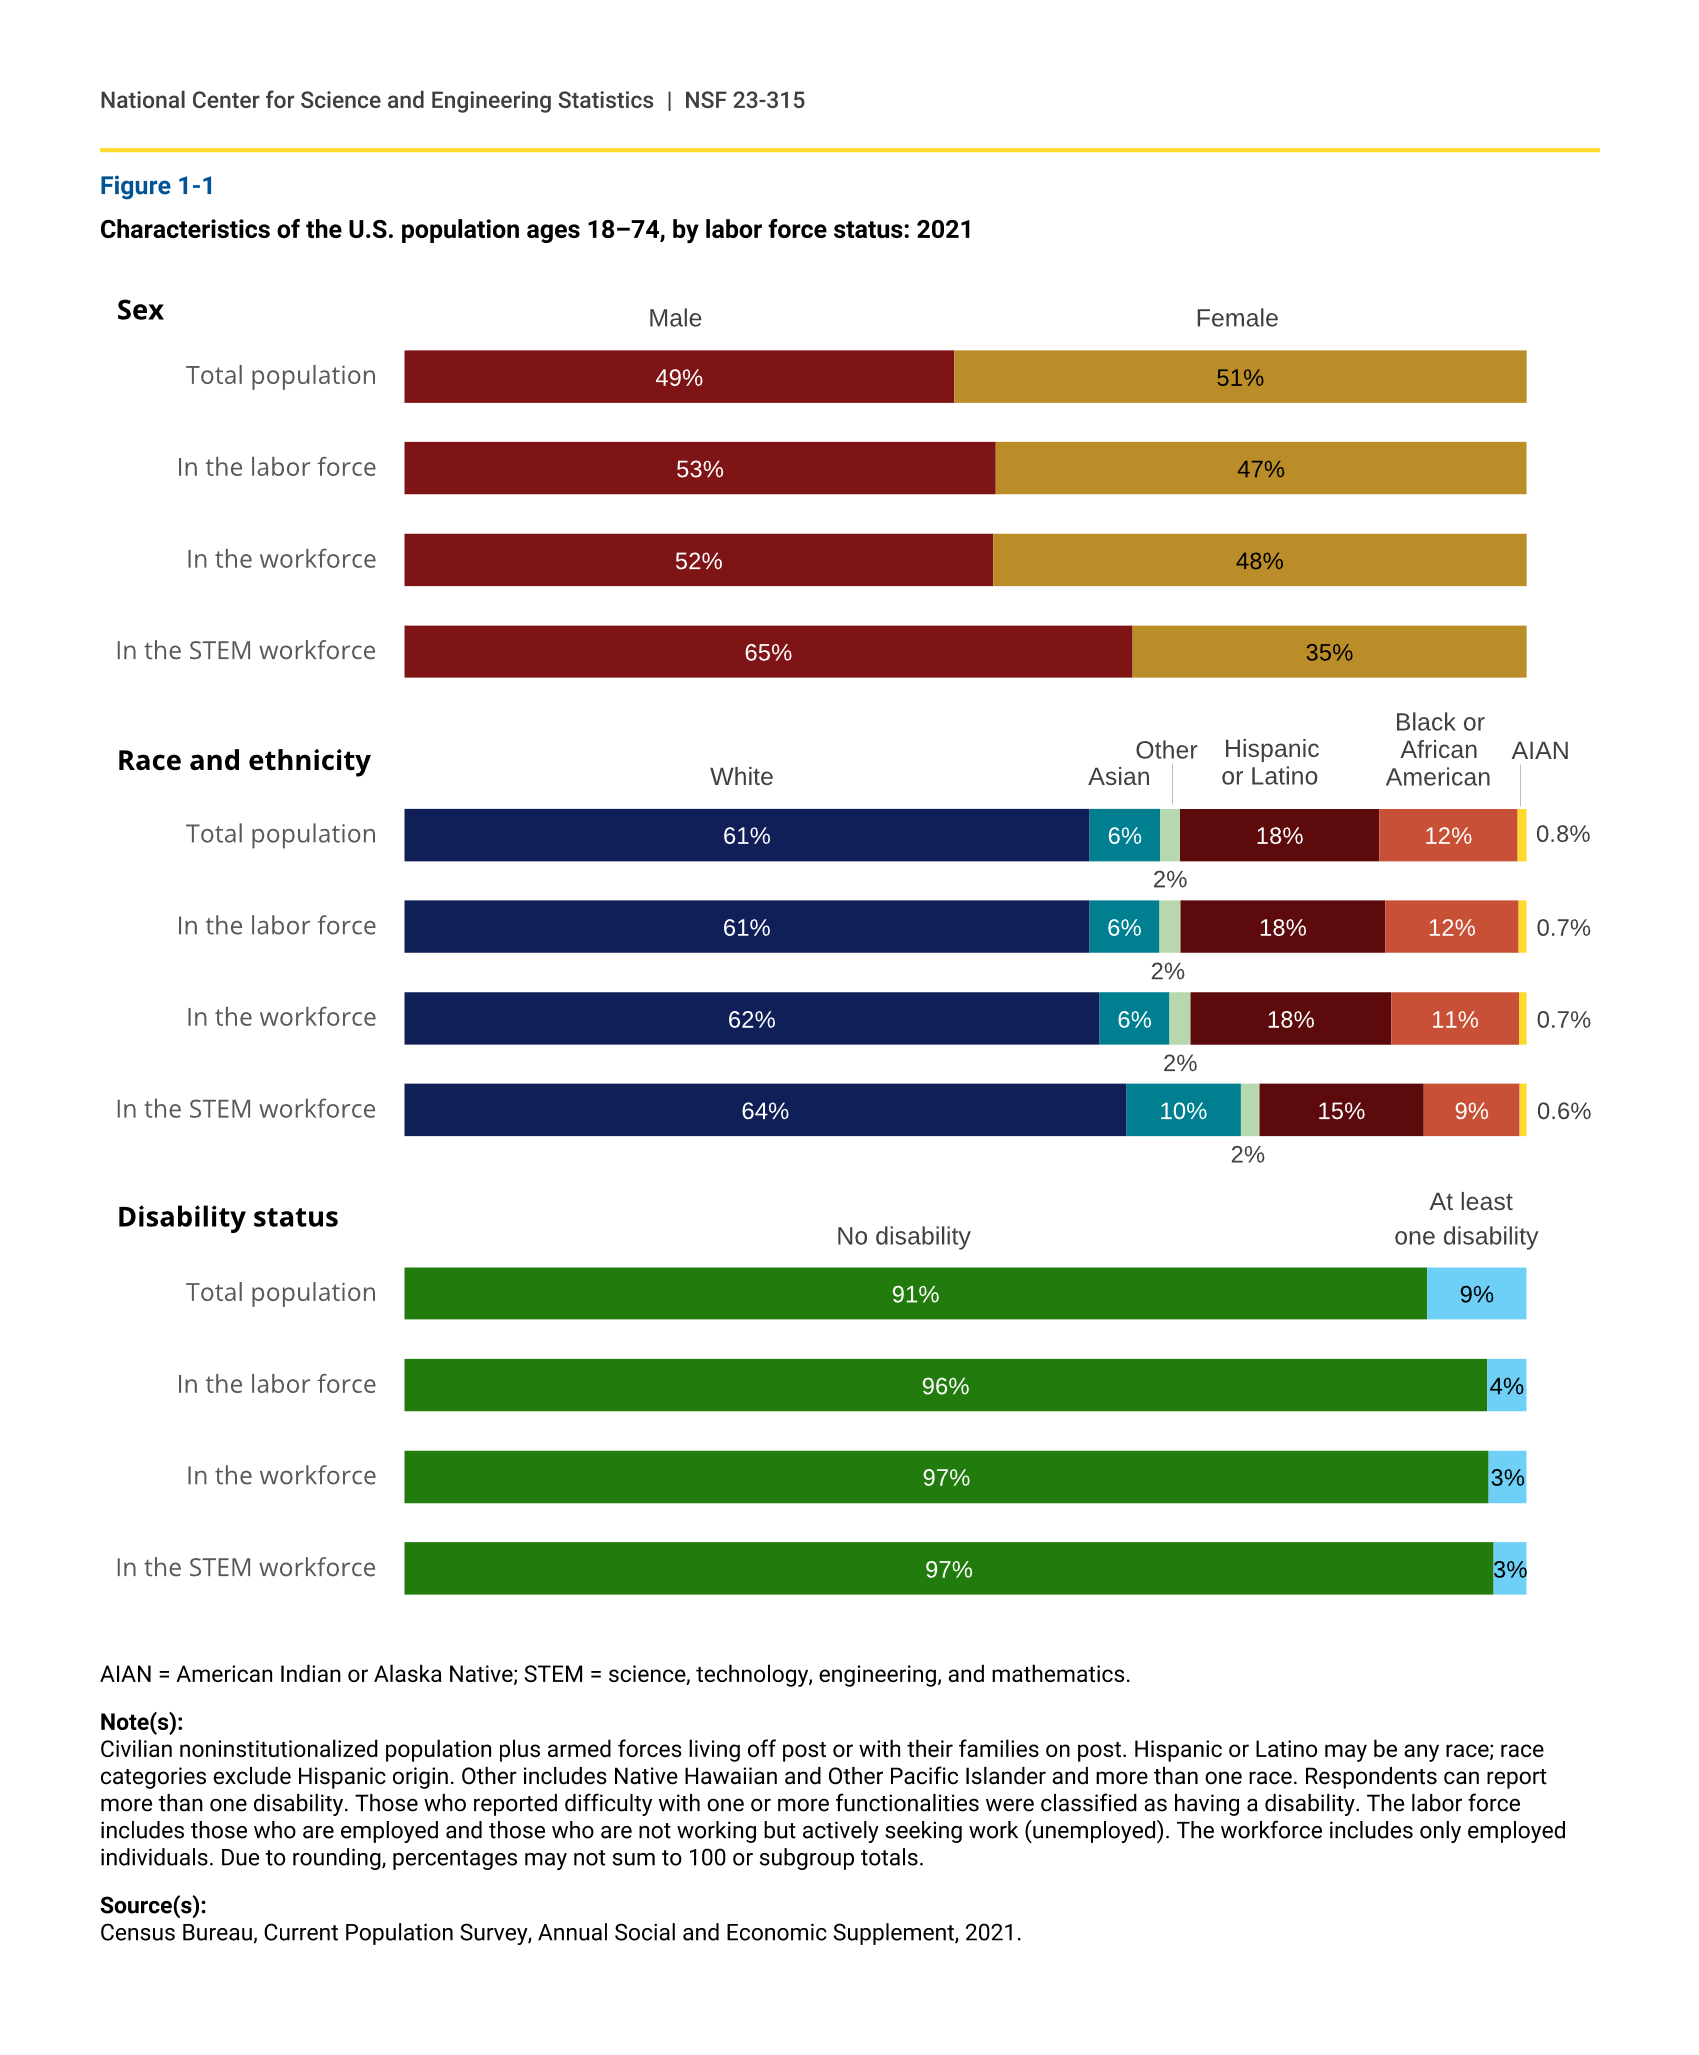
Representation of different groups based on sex, race or ethnicity, and disability status varies within the STEM workforce, and representation in STEM occupations is uneven relative to the distribution of these groups in the working age population. Women, persons with disabilities, and persons from some racial and ethnic minority groups—Hispanic or Latino, Black or African American, and American Indian or Alaska Native—are underrepresented in the STEM workforce when compared to their share of the total population. In 2021, women made up half (51%) of the total population ages 18 to 74 years and about a third (35%) of those employed in a STEM occupation (figure 1-1). Although 9% of the population had one or more disabilities at that time, 3% of those who work in STEM occupations did. When combined, Hispanics, Blacks, and American Indians or Alaska Natives—collectively referred to as underrepresented minorities—made up 31% of the total population and 24% of STEM workers in 2021.
Women and some racial and ethnic minority groups are also underrepresented in postsecondary science and engineering (S&E) education—which may be indicative of their future participation in the STEM workforce. Women earned approximately half of the S&E degrees at the associate’s and bachelor’s degree levels in 2020, which was similar to their share of the population ages 18 to 34 years (figure 1-2). This age group, referred to here as the college-age population, includes most students completing degrees at the associate through doctoral levels. Compared with the proportion of women earning associate’s degrees, women accounted for lower shares of advanced S&E degree recipients, earning 46% of S&E master’s degrees and 41% of S&E doctoral degrees in 2020.
Racial and ethnic groups also vary in their representation among S&E degree recipients relative to their share of 18-to-34-year-olds. Compared with their proportions of the college-age population, Whites and Asians account for a disproportionately high share of S&E degree recipients at the bachelor’s level and above, whereas Hispanics, Blacks, and American Indians or Alaska Natives account for a disproportionately low share of these degree recipients. The gap is increasingly pronounced at higher degree levels. Underrepresented minorities collectively accounted for 37% of the college-age population in 2021 and 26% of S&E bachelor’s, 24% of S&E master’s, and 16% of S&E doctoral degree recipients in 2020.
Characteristics of the U.S. population ages 18–74, by labor force status: 2021
AIAN = American Indian or Alaska Native; STEM = science, technology, engineering, and mathematics.
Note(s):
Civilian noninstitutionalized population plus armed forces living off post or with their families on post. Hispanic or Latino may be any race; race categories exclude Hispanic origin. Other includes Native Hawaiian and Other Pacific Islander and more than one race. Respondents can report more than one disability. Those who reported difficulty with one or more functionalities were classified as having a disability. The labor force includes those who are employed and those who are not working but actively seeking work (unemployed). The workforce includes only employed individuals. Due to rounding, percentages may not sum to 100 or subgroup totals.
Source(s):
Census Bureau, Current Population Survey, Annual Social and Economic Supplement, 2021.
Characteristics of S&E degree recipients, by degree level: 2020
AIAN = American Indian or Alaska Native; S&E = science and engineering.
Note(s):
Hispanic or Latino may be of any race; race categories exclude Hispanic origin. Other includes Native Hawaiian and Other Pacific Islander and more than one race. Race and ethnicity data for S&E degree recipients are available only for U.S. citizens and permanent residents.
Source(s):
National Center for Education Statistics, Integrated Postsecondary Education Data System, Completions Survey, 2020. U.S. population data from Census Bureau, Current Population Survey, Annual Social and Economic Supplement, 2021.
Purpose of Report
The purpose of this report, Diversity and STEM: Women, Minorities, and Persons with Disabilities 2023, is to provide statistical information about these three groups, all of whom have historically been underrepresented in the S&E enterprise. As mandated by the Science and Engineering Equal Opportunities Act (Public Law 96-516), the National Science Foundation through the National Center for Science and Engineering Statistics (NCSES) publishes a biennial report to assess the current standing of women, persons from racial or ethnic minority groups, and persons with disabilities in STEM employment and S&E education in relation to other groups. The analyses presented here are relevant to policymakers, program managers, and researchers interested in diversity and representation in the U.S. science and engineering enterprise.
Structure of Report
This report begins by describing the representation of women, persons from underrepresented minority groups, and persons with disabilities in the STEM workforce as a whole and in three types of STEM occupations (S&E, S&E-related, and middle-skill occupations) using data from 2011 and 2021. Analyses of comparative wage and salary earnings and the impact of educational attainment are presented using the survey data from 2021. The section on unemployment rates across these groups highlights the effects of the COVID-19 pandemic, focusing on the differences between 2019 and 2021. The section on the STEM workforce with at least a bachelor’s degree describes the representation of these groups in specific STEM occupations in 2021 and how part-time versus full-time employment varies across the groups.
Two sections of this report focus on S&E education. The section on degrees earned shows the data by broad S&E field from 2011 to 2020, with an emphasis on bachelor’s degree data for underrepresented minority groups. Representation of women among recipients of S&E technologies associate’s degrees, a typical entry point into the skilled technical workforce, is described in a sidebar. The section on enrollment addresses the effect of the COVID-19 pandemic on graduate enrollment, exploring differences based on sex, race, and ethnicity. Collectively, these sections provide insight into the likely representation of these groups in the future STEM labor force.
Defining the STEM Workforce, Racial and Ethnic Categories, and Disability Status
When discussing the STEM workforce, this report uses the definition of the STEM labor force as outlined in the Science and Engineering Indicators 2022 report The STEM Labor Force of Today: Scientists, Engineers, and Skilled Technical Workforce (NSB, NSF 2021) and the infographic Workforce Statistics (NCSES 2022). This new definition of the STEM labor force includes workers in S&E, S&E-related, and middle-skill occupations (see sidebar The STEM Workforce of the United States and the “Glossary” section for definitions).
Where possible, data for all three underrepresented minority groups—Hispanics, Blacks, and American Indians or Alaska Natives—are presented separately. However, the group of American Indians or Alaska Natives had a sample size that was too small to produce statistically reliable estimates in some cases, and those data are not shown. The sidebar Defining Race and Ethnicity provides details about how racial and ethnic groups are defined by the data sources used in this report.
The data sources used in this report estimate the number of persons with at least one disability in two different ways (see sidebar Defining Persons with at Least One Disability). The Current Population Survey (CPS) uses a set of six yes-or-no questions to assess disability. The NCSES surveys, including the National Survey of College Graduates, the Survey of Earned Doctorates, and the Survey of Doctoral Recipients, use a set of five scale questions to determine functional limitations. Although the two different classification criteria for disability measure the same broad concept, caution should be taken when comparing the estimates derived from the CPS and NCSES sources.