Report
STEM Workforce with at Least a Bachelor's Degree
Overview
A bachelor’s degree is typically seen as the gateway to better jobs, higher wages, and for some, a pathway out of poverty. Using data from the National Center for Science and Engineering Statistics’ (NCSES’s) 2021 National Survey of College Graduates (NSCG), this report evaluates the distribution of college-educated women, racial and ethnic minority groups, and people with one or more disabilities among workers in science and engineering (S&E) and S&E-related occupations. The section also analyzes college graduates in non-S&E occupations for comparative purposes. The information in this section complements that in the previous sections of this report on the science, technology, engineering, and mathematics (STEM) workforce that use data from the Census Bureau’s Current Population Survey (CPS). This section provides more details about the representation of these groups in specific S&E occupations (see https://ncses.nsf.gov/pubs/nsb20212/table/SLBR-4). Information is presented about full-time (35 hours or more per week) and part-time (less than 35 hours per week) employment of women, the group composed of underrepresented minorities (Hispanic or Latino, Black or African American, and American Indian or Alaska Native), and workers with at least one disability. Where sufficient data are available, specific S&E occupation details for each underrepresented minority group are provided. Because the data sources differ, there are some differences in the values between this section and the other sections on the STEM workforce. For details, see sidebar Defining Race and Ethnicity and sidebar Defining Persons with at Least One Disability.
Women with at least a bachelor’s degree were unevenly represented in S&E occupations, with the highest representation among social and related scientists and the lowest representation among engineers. Workers with one or more disabilities were relatively evenly distributed across S&E occupations. Among those working in S&E occupations with at least a bachelor’s degree, a greater proportion of women and those with one or more disabilities were employed part time than their counterparts (men and those without disabilities). Underrepresented minorities and their counterparts (collectively, Whites, Asians, and those in the “other” race group, which includes single race, Native Hawaiian or Other Pacific Islander, and multi-race groups, not Hispanic) had similar rates of part-time employment.
Representation in the Workforce with at Least a Bachelor’s Degree
Women make up a smaller portion of the S&E workforce than they do of the college-educated workforce overall.
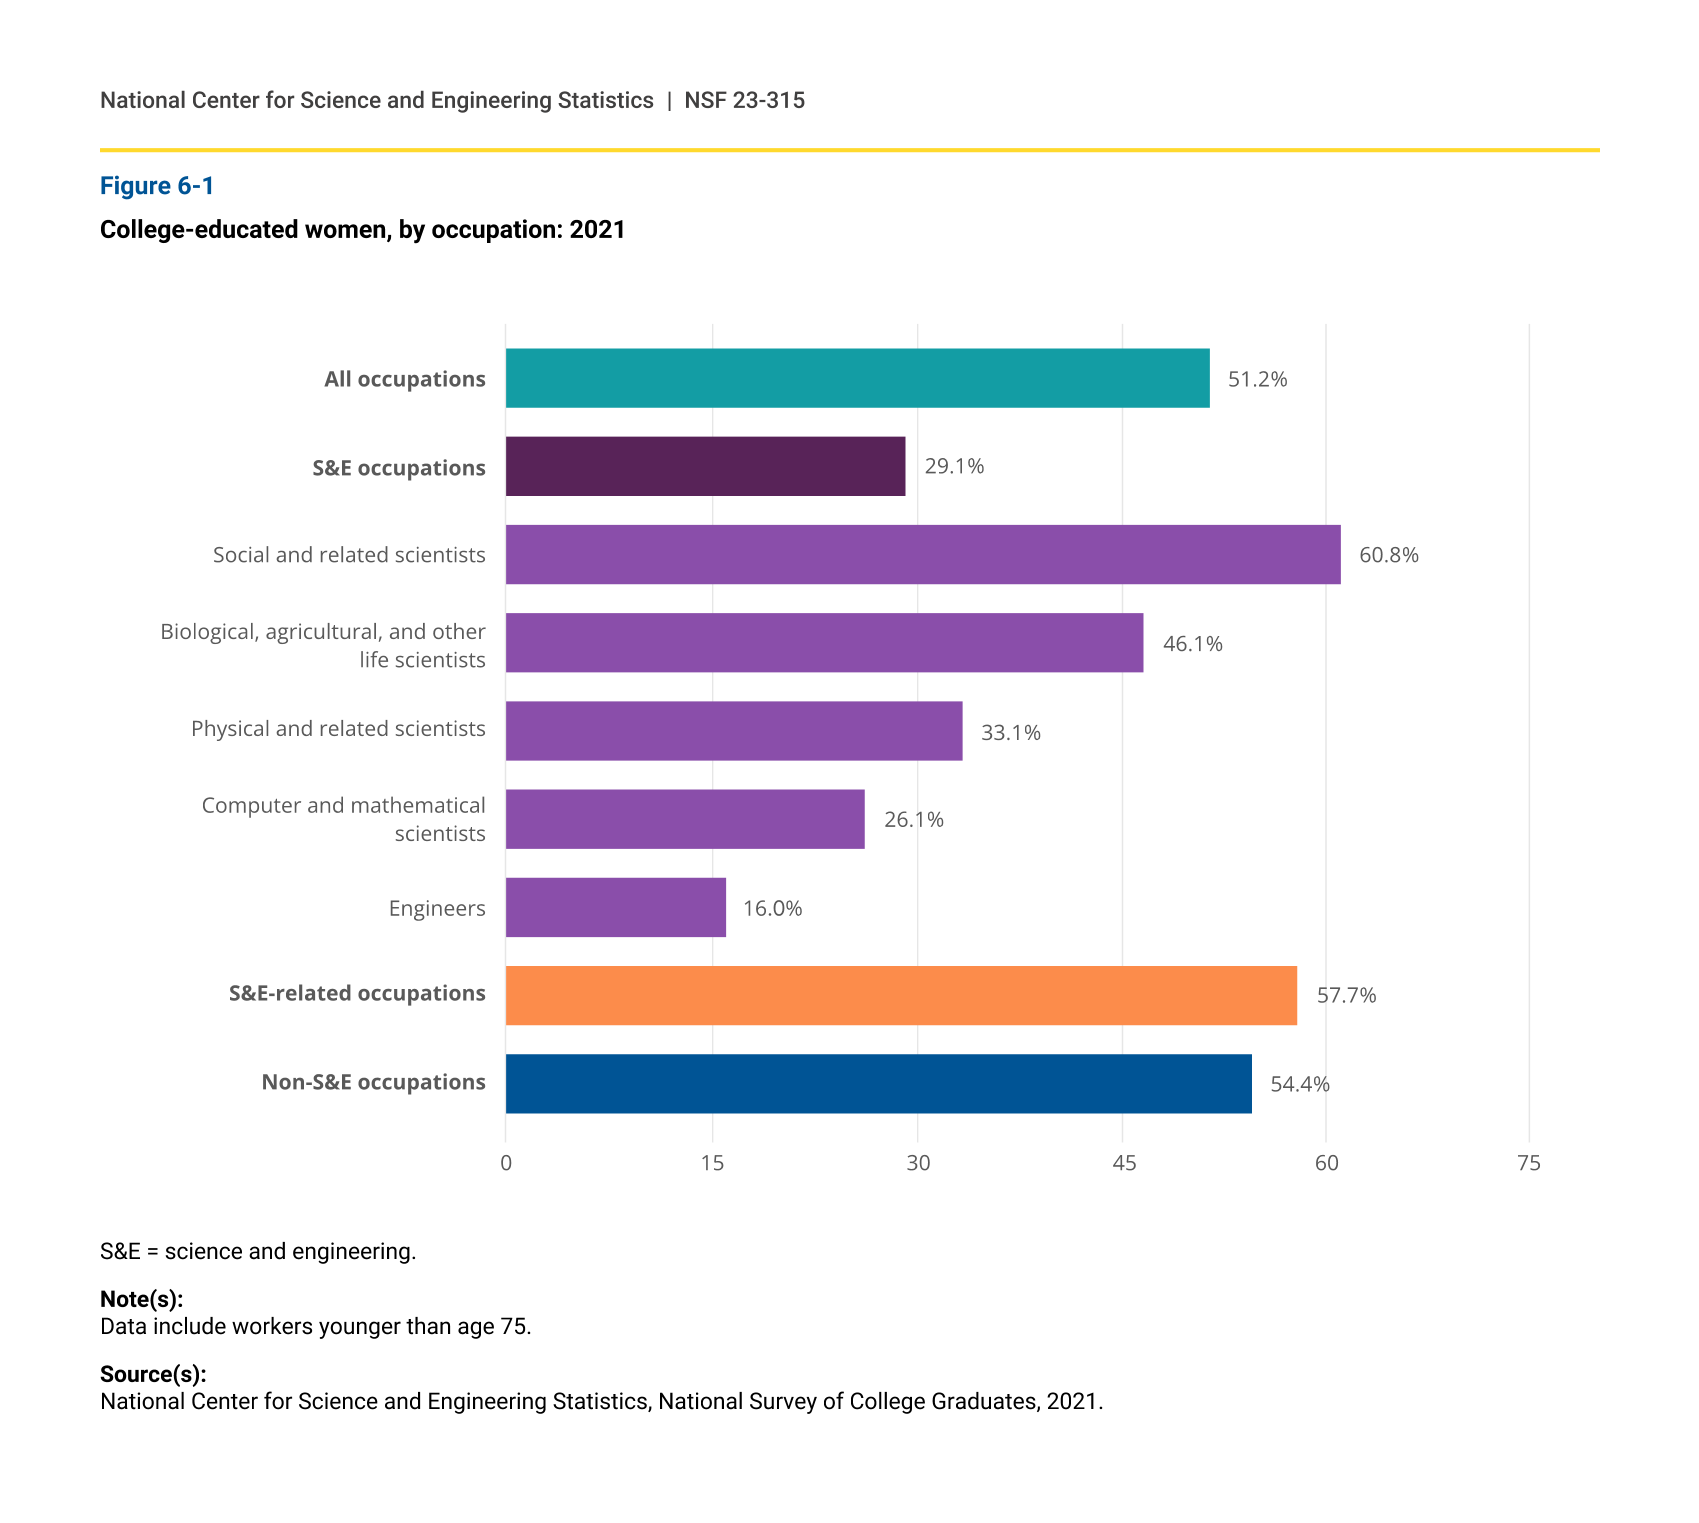
Women made up 51% of the total labor force with at least a bachelor’s degree (college-educated labor force) in 2021 (figure 6-1). Similar to the overall STEM workforce (figure 2-3), women represent a smaller proportion than men of the college-educated workforce in S&E occupations—29% were women (figure 6-1). The distribution of women among the S&E occupations is uneven in the college-educated labor force. In 2021, 61% of social and related scientists were women, as were 46% of biological, agricultural, and other life scientists, 33% of physical and related scientists, 26% of computer and mathematical scientists, and 16% of engineers. Compared with men, a greater share of college-educated workers in S&E-related occupations and non-S&E occupations were women (58% and 54%, respectively) in 2021.
College-educated women, by occupation: 2021
S&E = science and engineering.
Note(s):
Data include workers younger than age 75.
Source(s):
National Center for Science and Engineering Statistics, National Survey of College Graduates, 2021.
Black Americans make up a smaller proportion of workers in S&E occupations than they do of workers in S&E-related occupations.
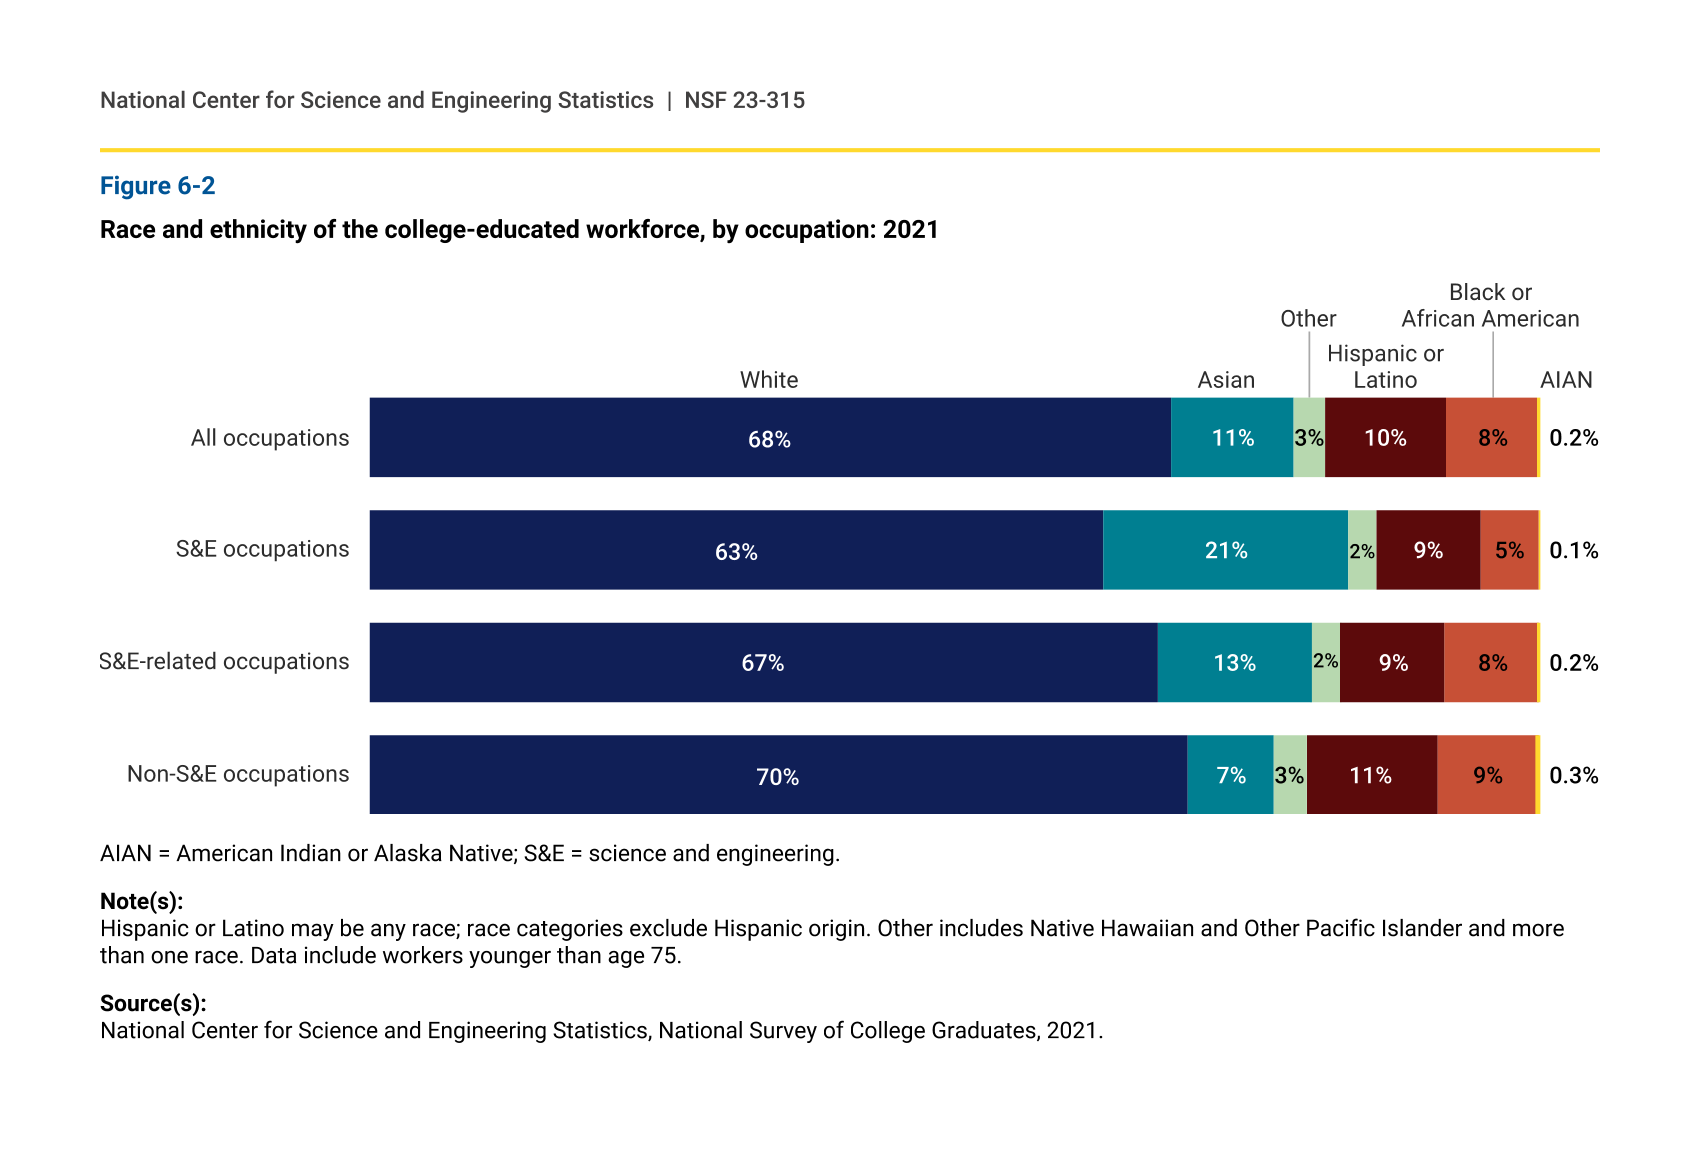
In 2021, 10% of the college-educated workforce were Hispanic, 8% were Black, and 0.2% were American Indian or Alaska Native (figure 6-2). Collectively, these underrepresented minorities constituted 14% of the college-educated workforce in S&E occupations, 17% of those in S&E-related occupations, and 20% of those in non-S&E occupations.
Race and ethnicity of the college-educated workforce, by occupation: 2021
AIAN = American Indian or Alaska Native; S&E = science and engineering.
Note(s):
Hispanic or Latino may be any race; race categories exclude Hispanic origin. Other includes Native Hawaiian and Other Pacific Islander and more than one race. Data include workers younger than age 75.
Source(s):
National Center for Science and Engineering Statistics, National Survey of College Graduates, 2021.
Representation of underrepresented minority groups as a whole in S&E occupations ranged from 12% to 18%.
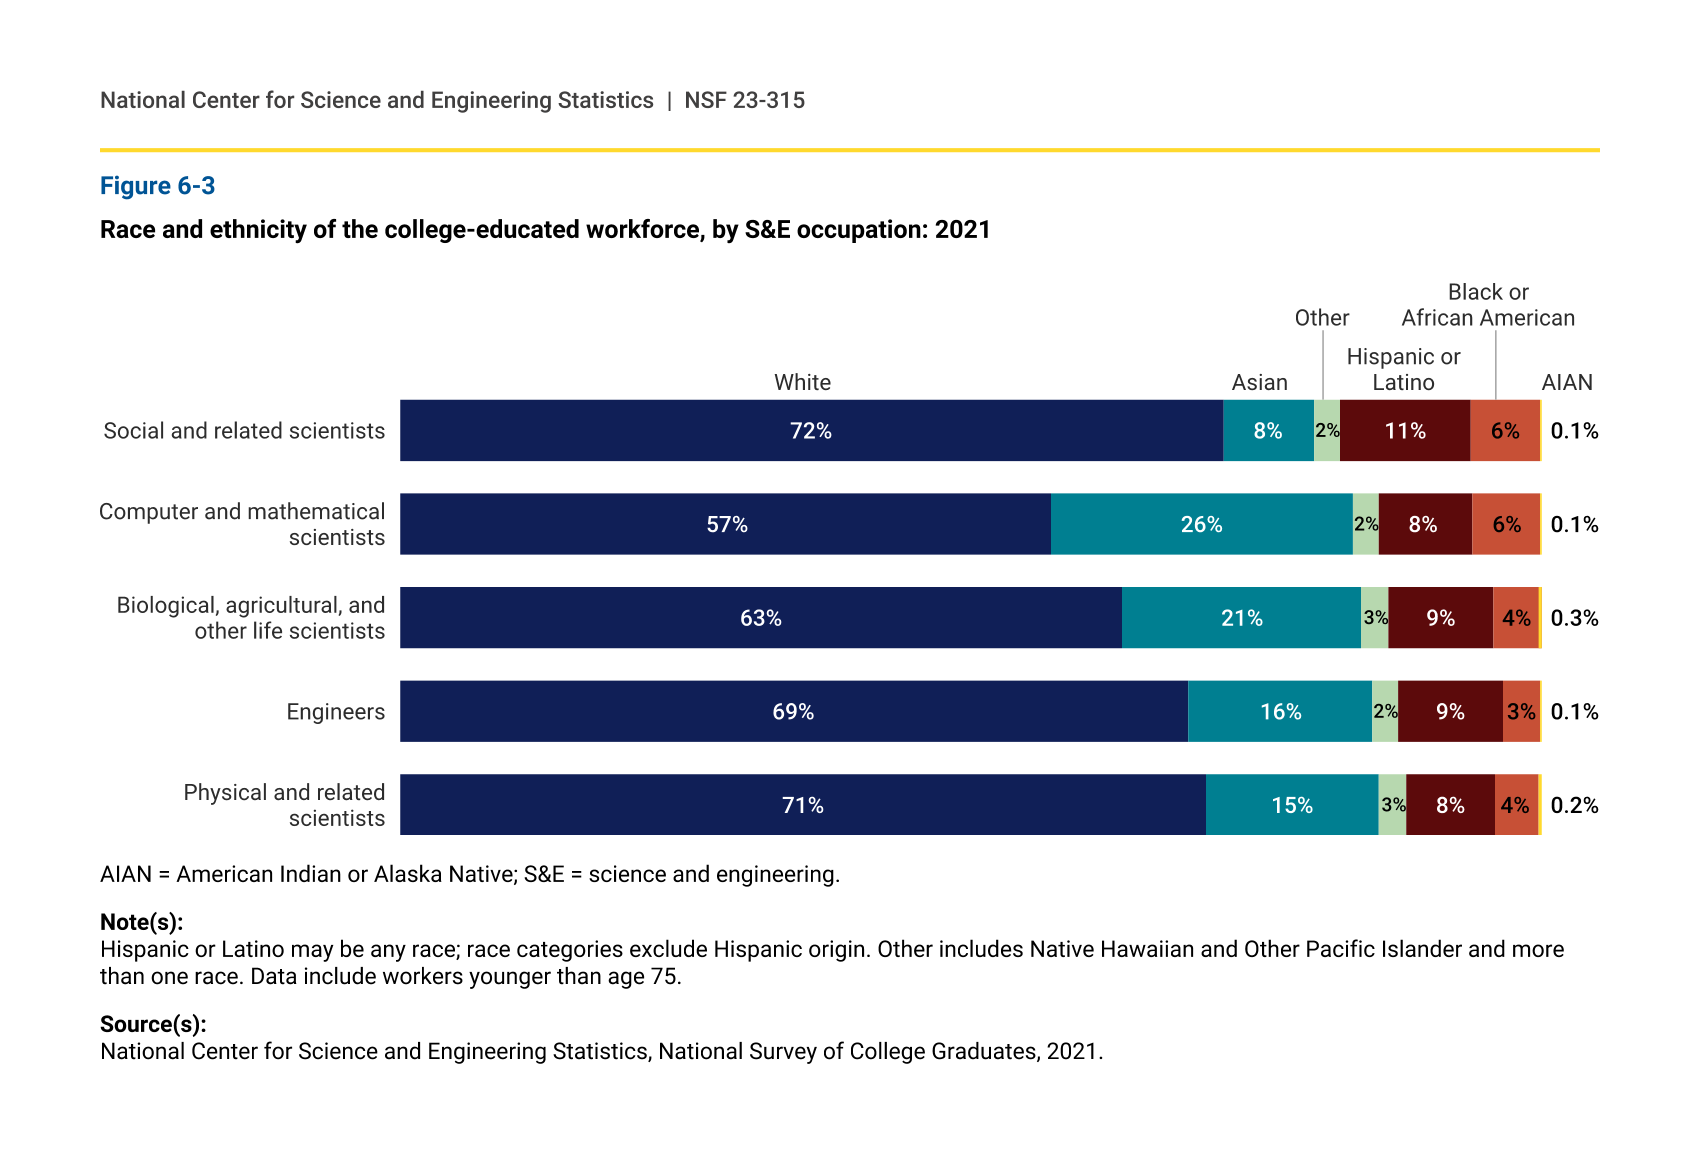
Within S&E occupations, a total of 18% of social and related scientists were Black, Hispanic, or American Indian or Alaska Native, and 12% of physical and related scientists and engineers were made up of these underrepresented groups (figure 6-3). The representation of Black workers varied little among the S&E occupations. Hispanic workers were highly represented among social and related scientists, making up 11% of this group. American Indian or Alaska Native individuals were less than 0.5% of the workers in any S&E occupation.
Race and ethnicity of the college-educated workforce, by S&E occupation: 2021
AIAN = American Indian or Alaska Native; S&E = science and engineering.
Note(s):
Hispanic or Latino may be any race; race categories exclude Hispanic origin. Other includes Native Hawaiian and Other Pacific Islander and more than one race. Data include workers younger than age 75.
Source(s):
National Center for Science and Engineering Statistics, National Survey of College Graduates, 2021.
Representation of workers with at least one disability varied little among S&E and S&E-related occupations.
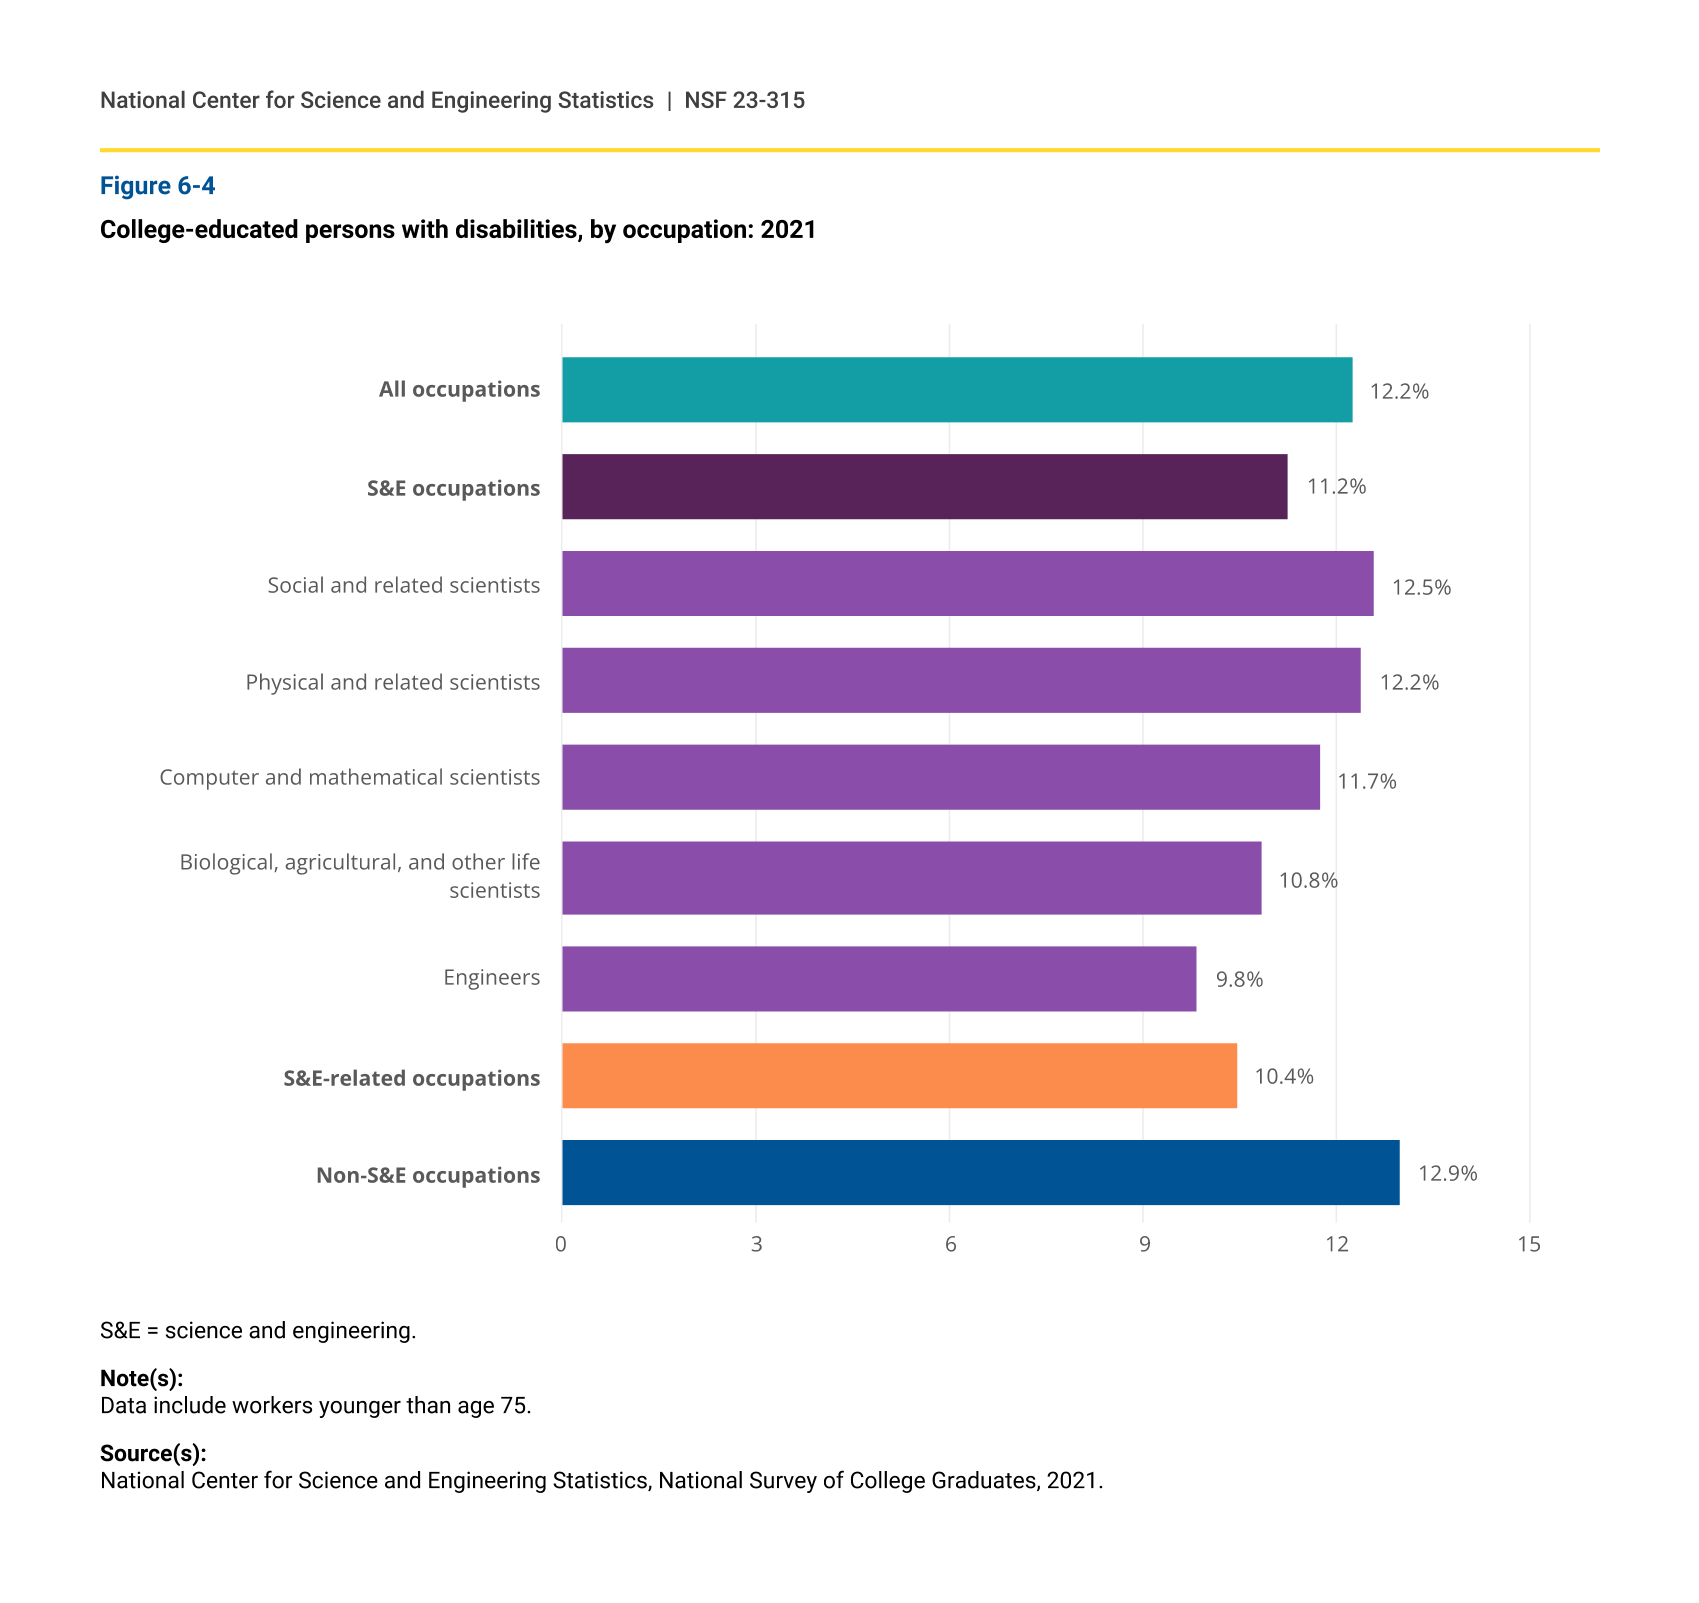
Among the employed college-educated workforce, 12% reported at least one disability in 2021 (figure 6-4). Although 13% of college-educated workers in non-S&E occupations had at least one disability, a smaller proportion of workers in S&E and S&E-related occupations reported having at least one disability (11% and 10%, respectively). Among those in S&E occupations, rates of disability were similar across the major occupation groups.
College-educated persons with disabilities, by occupation: 2021
S&E = science and engineering.
Note(s):
Data include workers younger than age 75.
Source(s):
National Center for Science and Engineering Statistics, National Survey of College Graduates, 2021.
Part-Time Employment in the Workforce with at Least a Bachelor’s Degree
The share of women working part time in the S&E workforce is nearly twice the share of men.
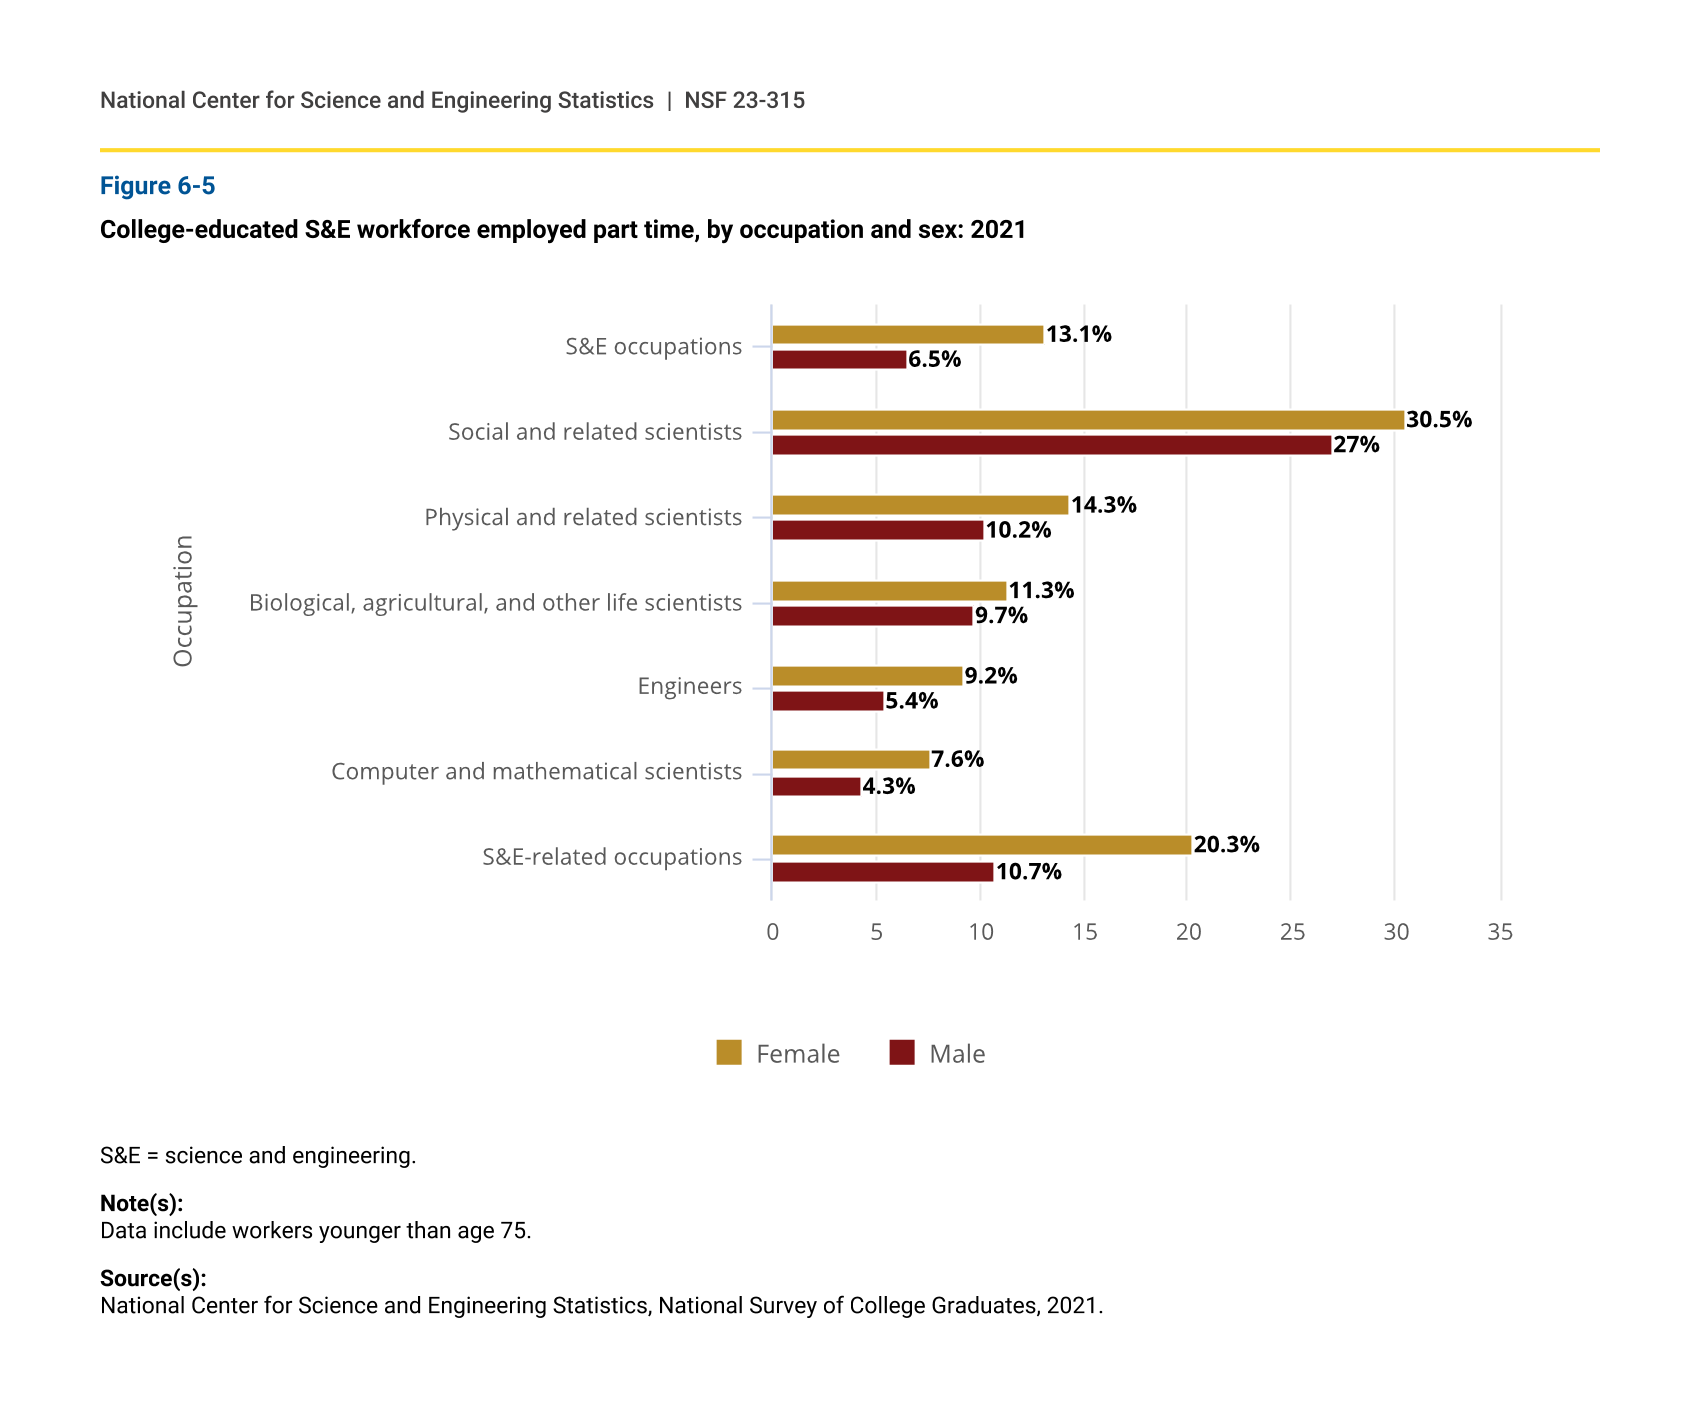
Among college-educated workers employed in S&E occupations in 2021, 13% of women and 7% of men worked part time (less than 35 hours per week) (figure 6-5). Among computer and mathematical scientists and engineers, women’s part-time employment rate was higher than that of men. The distribution of part-time work across the S&E occupations is uneven. A greater proportion of social and related scientists worked part time (30% among women and 27% among men) than did any other occupation group. Fewer engineers and computer and mathematical scientists worked part time: 8%–9% among women and 4%–5% among men. The only significant difference between men and women was among engineers and computer and mathematical scientists. In S&E-related occupations, a greater proportion of college-educated women (20%) than men (11%) worked part time.
College-educated S&E workforce employed part time, by occupation and sex: 2021
| Occupation | Female | Male |
|---|---|---|
| S&E occupations | 13.1 | 6.5 |
| Social and related scientists | 30.5 | 27.0 |
| Physical and related scientists | 14.3 | 10.2 |
| Biological, agricultural, and other life scientists | 11.3 | 9.7 |
| Engineers | 9.2 | 5.4 |
| Computer and mathematical scientists | 7.6 | 4.3 |
| S&E-related occupations | 20.3 | 10.7 |
S&E = science and engineering.
Note(s):
Data include workers younger than age 75.
Source(s):
National Center for Science and Engineering Statistics, National Survey of College Graduates, 2021.
The rate of part-time employment in the S&E workforce is independent of underrepresented minority status.
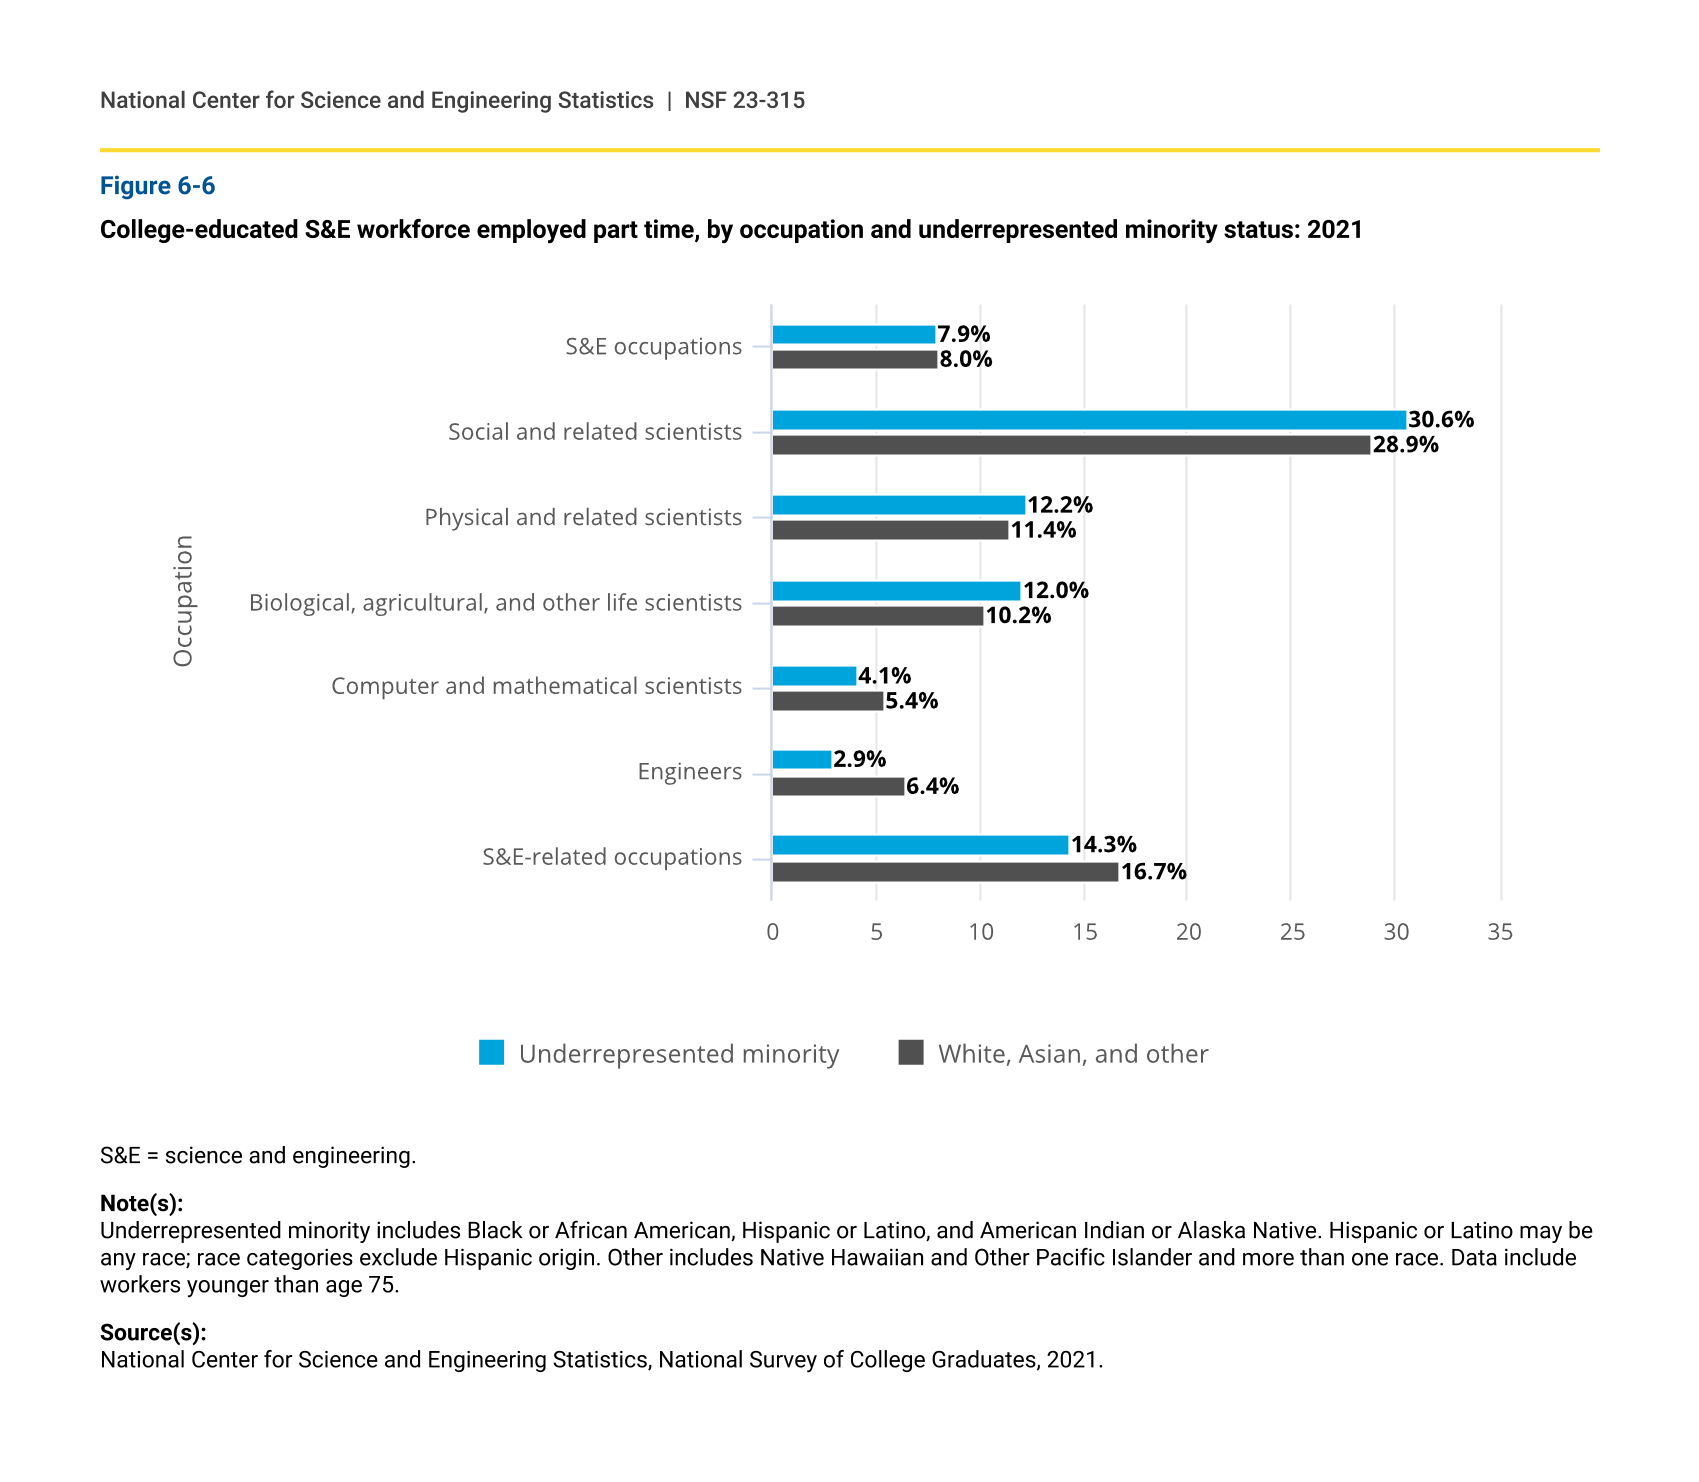
To make comparisons among racial and ethnic groups, part-time employment in S&E occupations among college-educated U.S. workers is presented based on two broad groups. The first group is the underrepresented minority group, which includes Hispanic, Black, and American Indian or Alaska Native workers. The second group consists of Whites, Asians, and those in the “other” category. Among college-educated workers employed in S&E occupations in 2021, 8% of each of these two broad groups were employed part time (figure 6-6). Furthermore, only among engineers was there a difference between these two broad groups among the S&E occupations: 3% of engineers in the underrepresented minority group worked part time, compared with 6% of engineers in the counterpart group. These two broad groups of college-educated workers also had similar rates of part-time employment in S&E-related occupations.
College-educated S&E workforce employed part time, by occupation and underrepresented minority status: 2021
| Occupation | Underrepresented minority | White, Asian, and other |
|---|---|---|
| S&E occupations | 7.9 | 8.0 |
| Social and related scientists | 30.6 | 28.9 |
| Physical and related scientists | 12.2 | 11.4 |
| Biological, agricultural, and other life scientists | 12.0 | 10.2 |
| Computer and mathematical scientists | 4.1 | 5.4 |
| Engineers | 2.9 | 6.4 |
| S&E-related occupations | 14.3 | 16.7 |
S&E = science and engineering.
Note(s):
Underrepresented minority includes Black or African American, Hispanic or Latino, and American Indian or Alaska Native. Hispanic or Latino may be any race; race categories exclude Hispanic origin. Other includes Native Hawaiian and Other Pacific Islander and more than one race. Data include workers younger than age 75.
Source(s):
National Center for Science and Engineering Statistics, National Survey of College Graduates, 2021.
A greater proportion of workers with a disability than those without a disability are employed part time in S&E occupations.
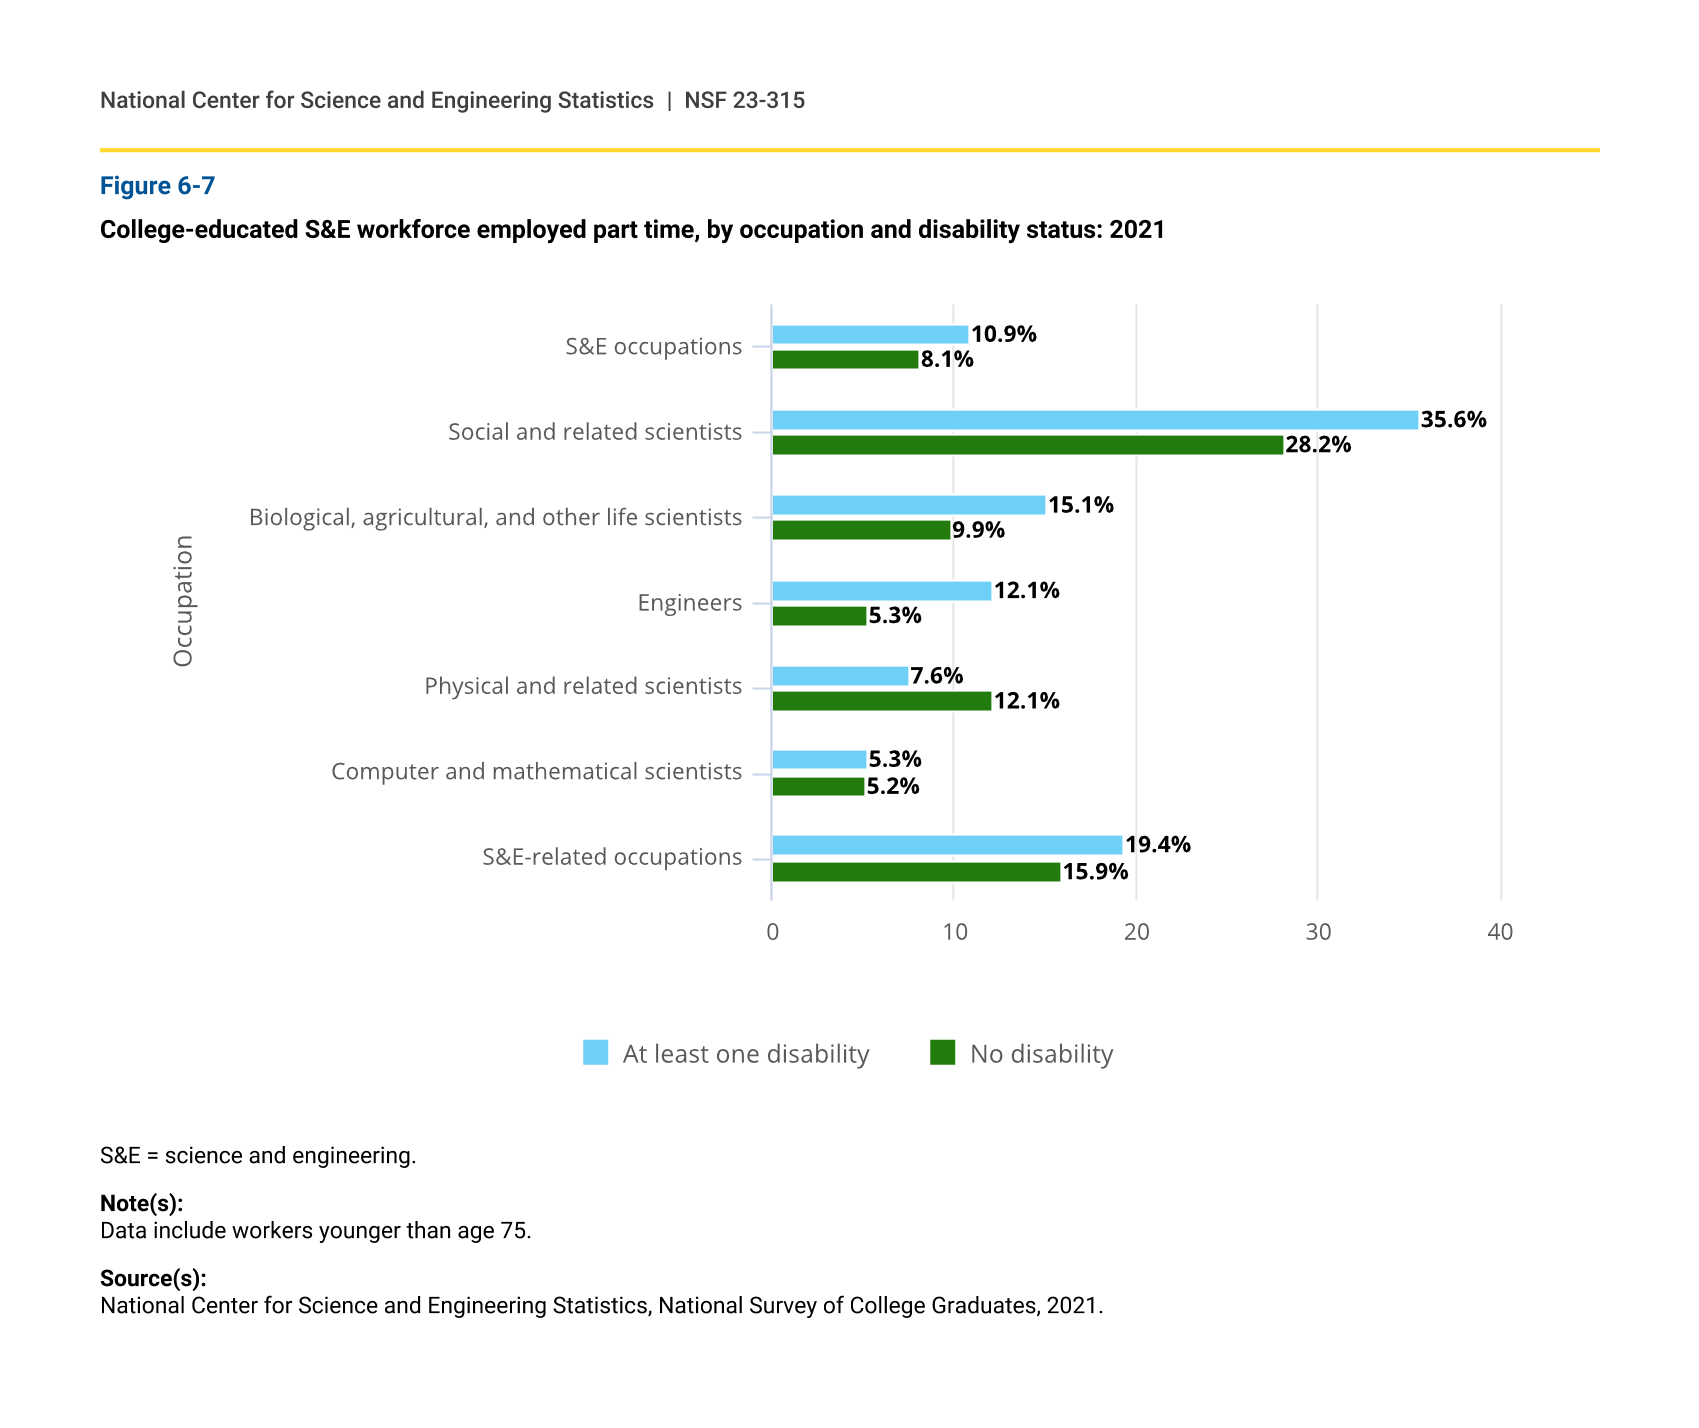
Among college-educated workers employed in S&E occupations in 2021, 11% with at least one disability worked part time, whereas 8% with no disability worked part time (figure 6-7). Although a similar pattern occurred among workers in S&E-related occupations, this difference was not statistically significant. Part-time employment was higher among engineers with at least one disability (12%) than among those without a disability (5%), but there were no statistically significant differences by disability in the other S&E occupation groups.
College-educated S&E workforce employed part time, by occupation and disability status: 2021
| Occupation | At least one disability | No disability |
|---|---|---|
| S&E occupations | 10.9 | 8.1 |
| Social and related scientists | 35.6 | 28.2 |
| Biological, agricultural, and other life scientists | 15.1 | 9.9 |
| Engineers | 12.1 | 5.3 |
| Physical and related scientists | 7.6 | 12.1 |
| Computer and mathematical scientists | 5.3 | 5.2 |
| S&E-related occupations | 19.4 | 15.9 |
S&E = science and engineering.
Note(s):
Data include workers younger than age 75.
Source(s):
National Center for Science and Engineering Statistics, National Survey of College Graduates, 2021.
Involuntary part-time employment falls disproportionately on persons with a disability for those in S&E-related occupations.
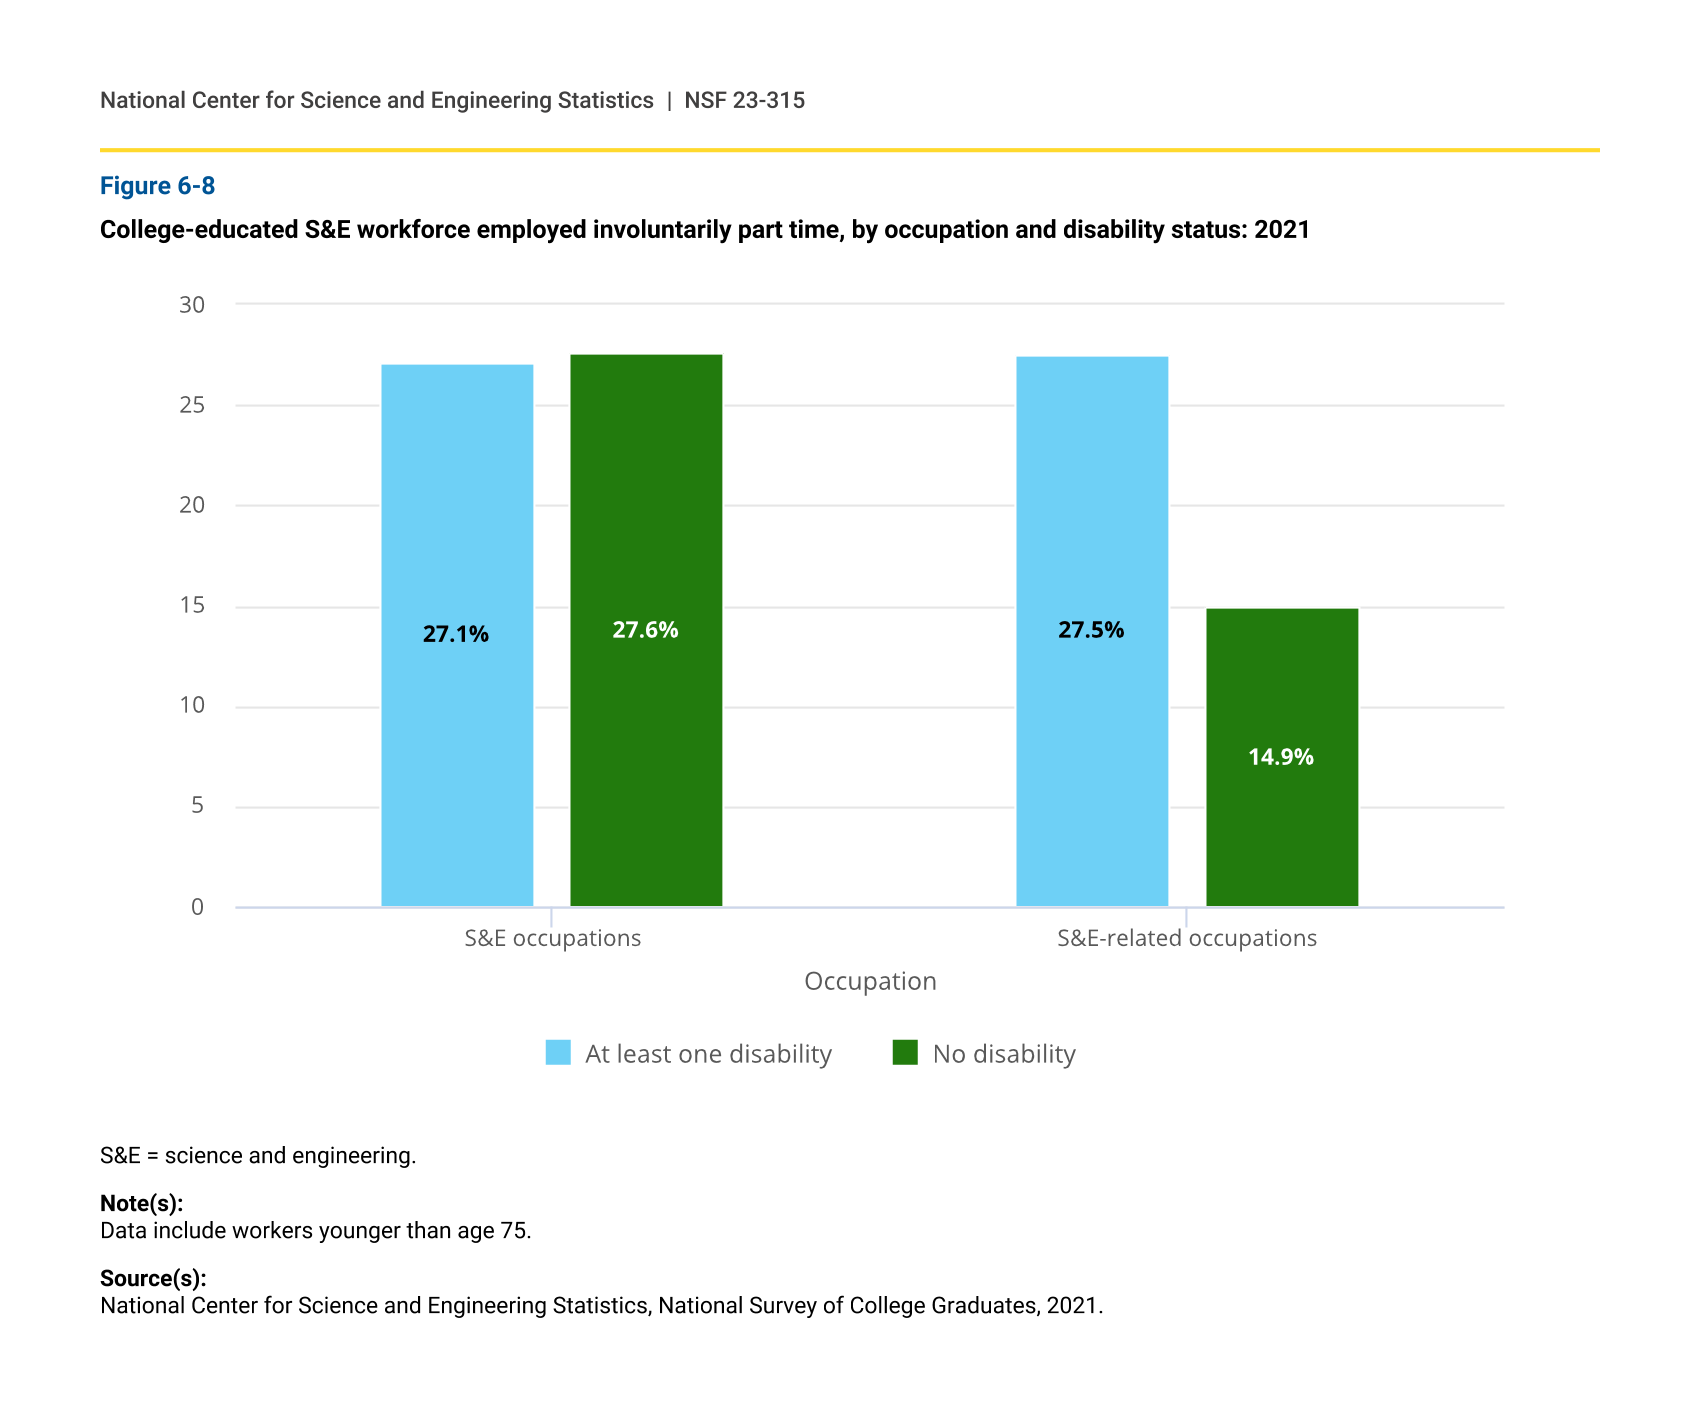
Among the college-educated workforce employed part time in S&E occupations in 2021, similar proportions of those with at least one disability (27%) and those without a disability (28%) reported wanting to work full time (figure 6-8). In contrast, among those in S&E-related occupations, persons with a disability who worked part time reported wanting to work full time at about twice the rate (28%) of those without a disability (15%).
College-educated S&E workforce employed involuntarily part time, by occupation and disability status: 2021
| Occupation | At least one disability | No disability |
|---|---|---|
| S&E occupations | 27.1 | 27.6 |
| S&E-related occupations | 27.5 | 14.9 |
S&E = science and engineering.
Note(s):
Data include workers younger than age 75.
Source(s):
National Center for Science and Engineering Statistics, National Survey of College Graduates, 2021.