Report
The STEM Workforce
Overview
The science, technology, engineering, and mathematics (STEM) workforce is made up of individuals at all education levels who work in science and engineering (S&E), S&E-related, and middle-skill occupations (see sidebar The STEM Workforce of the United States). Using data from the Census Bureau’s Current Population Survey (CPS), this section describes (1) the size of this workforce, (2) the representation of people according to sex, race, ethnicity, and disability status, and (3) how representation of these groups has changed between 2011 and 2021. Data show that although men and Whites still make up the largest share, the STEM workforce has been gradually diversifying over the past 10 years, with increased representation of women and underrepresented minorities—that is, Hispanics or Latinos, Blacks or African Americans, and American Indians or Alaska Natives.
Representation in the STEM Workforce
About a quarter of the U.S. workforce is employed in STEM occupations.
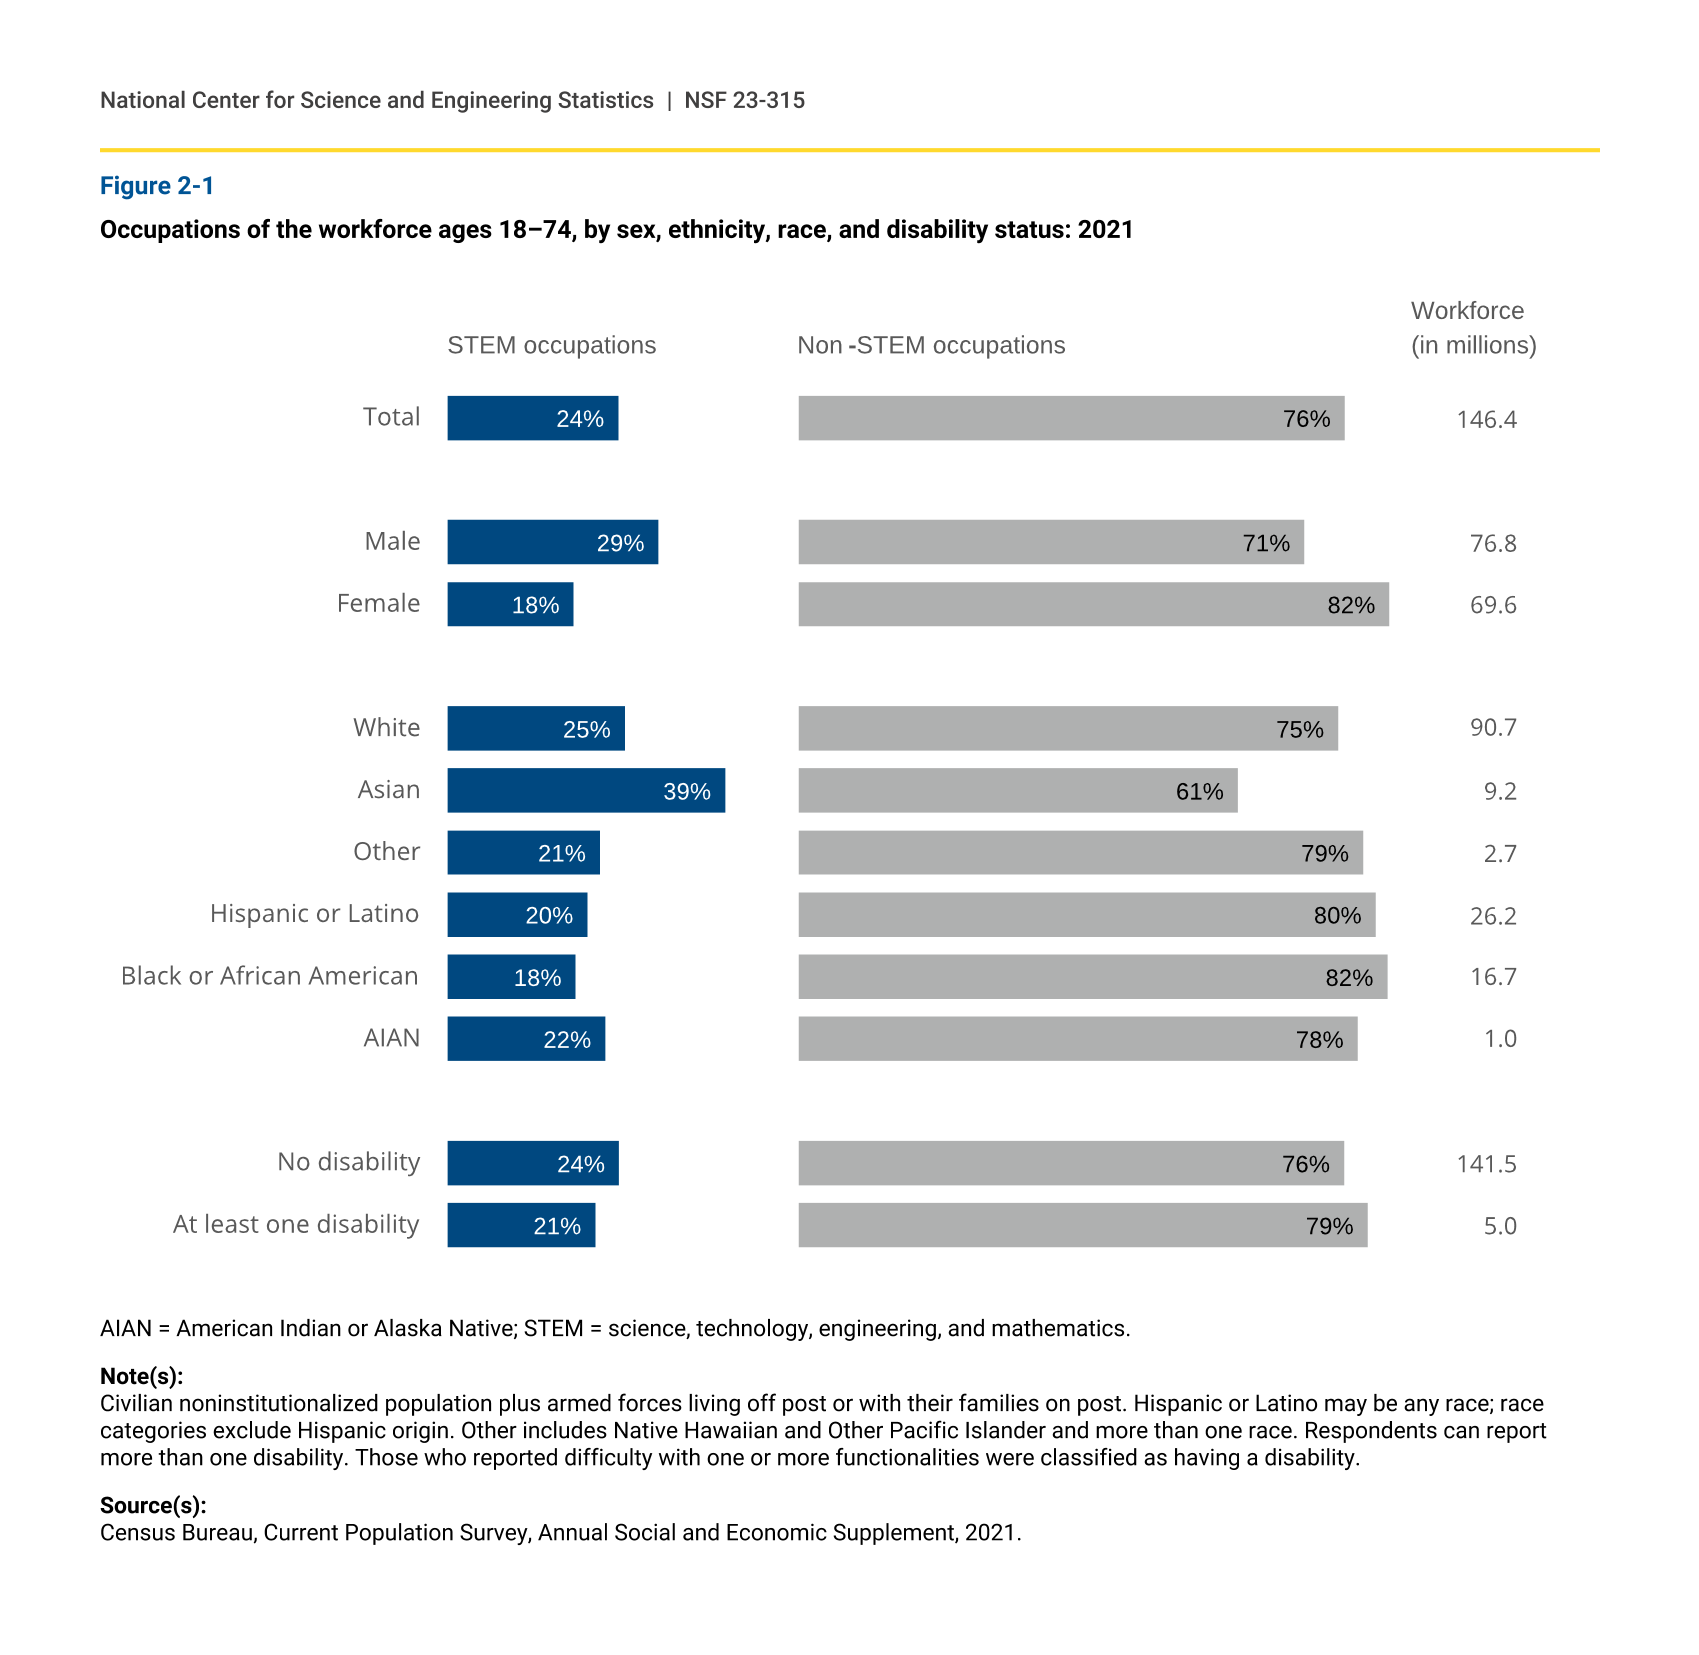
Of the 146.4 million people ages 18 to 74 in the workforce, 34.9 million (24%) were employed in STEM occupations in 2021 (figure 2-1). Although men and women represented similar proportions of the total workforce—52% men and 48% women (figure 1-1)—a greater share of men (29%) than women (18%) worked in STEM occupations. Among racial or ethnic groups, Asian workers had the highest share employed in STEM (39%), whereas the lowest share was among Black workers (18%). Within the other racial and ethnic groups, 20% to 25% worked in STEM. Workers with one or more disabilities represent a small proportion (3%) of the total workforce. Among workers with at least one disability, 21% worked in STEM occupations, which is slightly less than the 24% of nondisabled workers in STEM occupations.
In terms of age—and contrary to what is typically believed—STEM workers with at least one disability are not overwhelmingly concentrated in the older age groups. According to the 2021 CPS, among the STEM workforce ages 18 to 74 with one or more disabilities, 18% were in the early stages of their career (ages 18 to 34), 39% were midcareer (ages 35 to 54), and 43% were in the later stages of their career (age 55 and older).
Occupations of the workforce ages 18–74, by sex, ethnicity, race, and disability status: 2021
AIAN = American Indian or Alaska Native; STEM = science, technology, engineering, and mathematics.
Note(s):
Civilian noninstitutionalized population plus armed forces living off post or with their families on post. Hispanic or Latino may be any race; race categories exclude Hispanic origin. Other includes Native Hawaiian and Other Pacific Islander and more than one race. Respondents can report more than one disability. Those who reported difficulty with one or more functionalities were classified as having a disability.
Source(s):
Census Bureau, Current Population Survey, Annual Social and Economic Supplement, 2021.
Growth in the STEM Workforce between 2011 and 2021
The size of the STEM workforce grew between 2011 and 2021 for all groups.
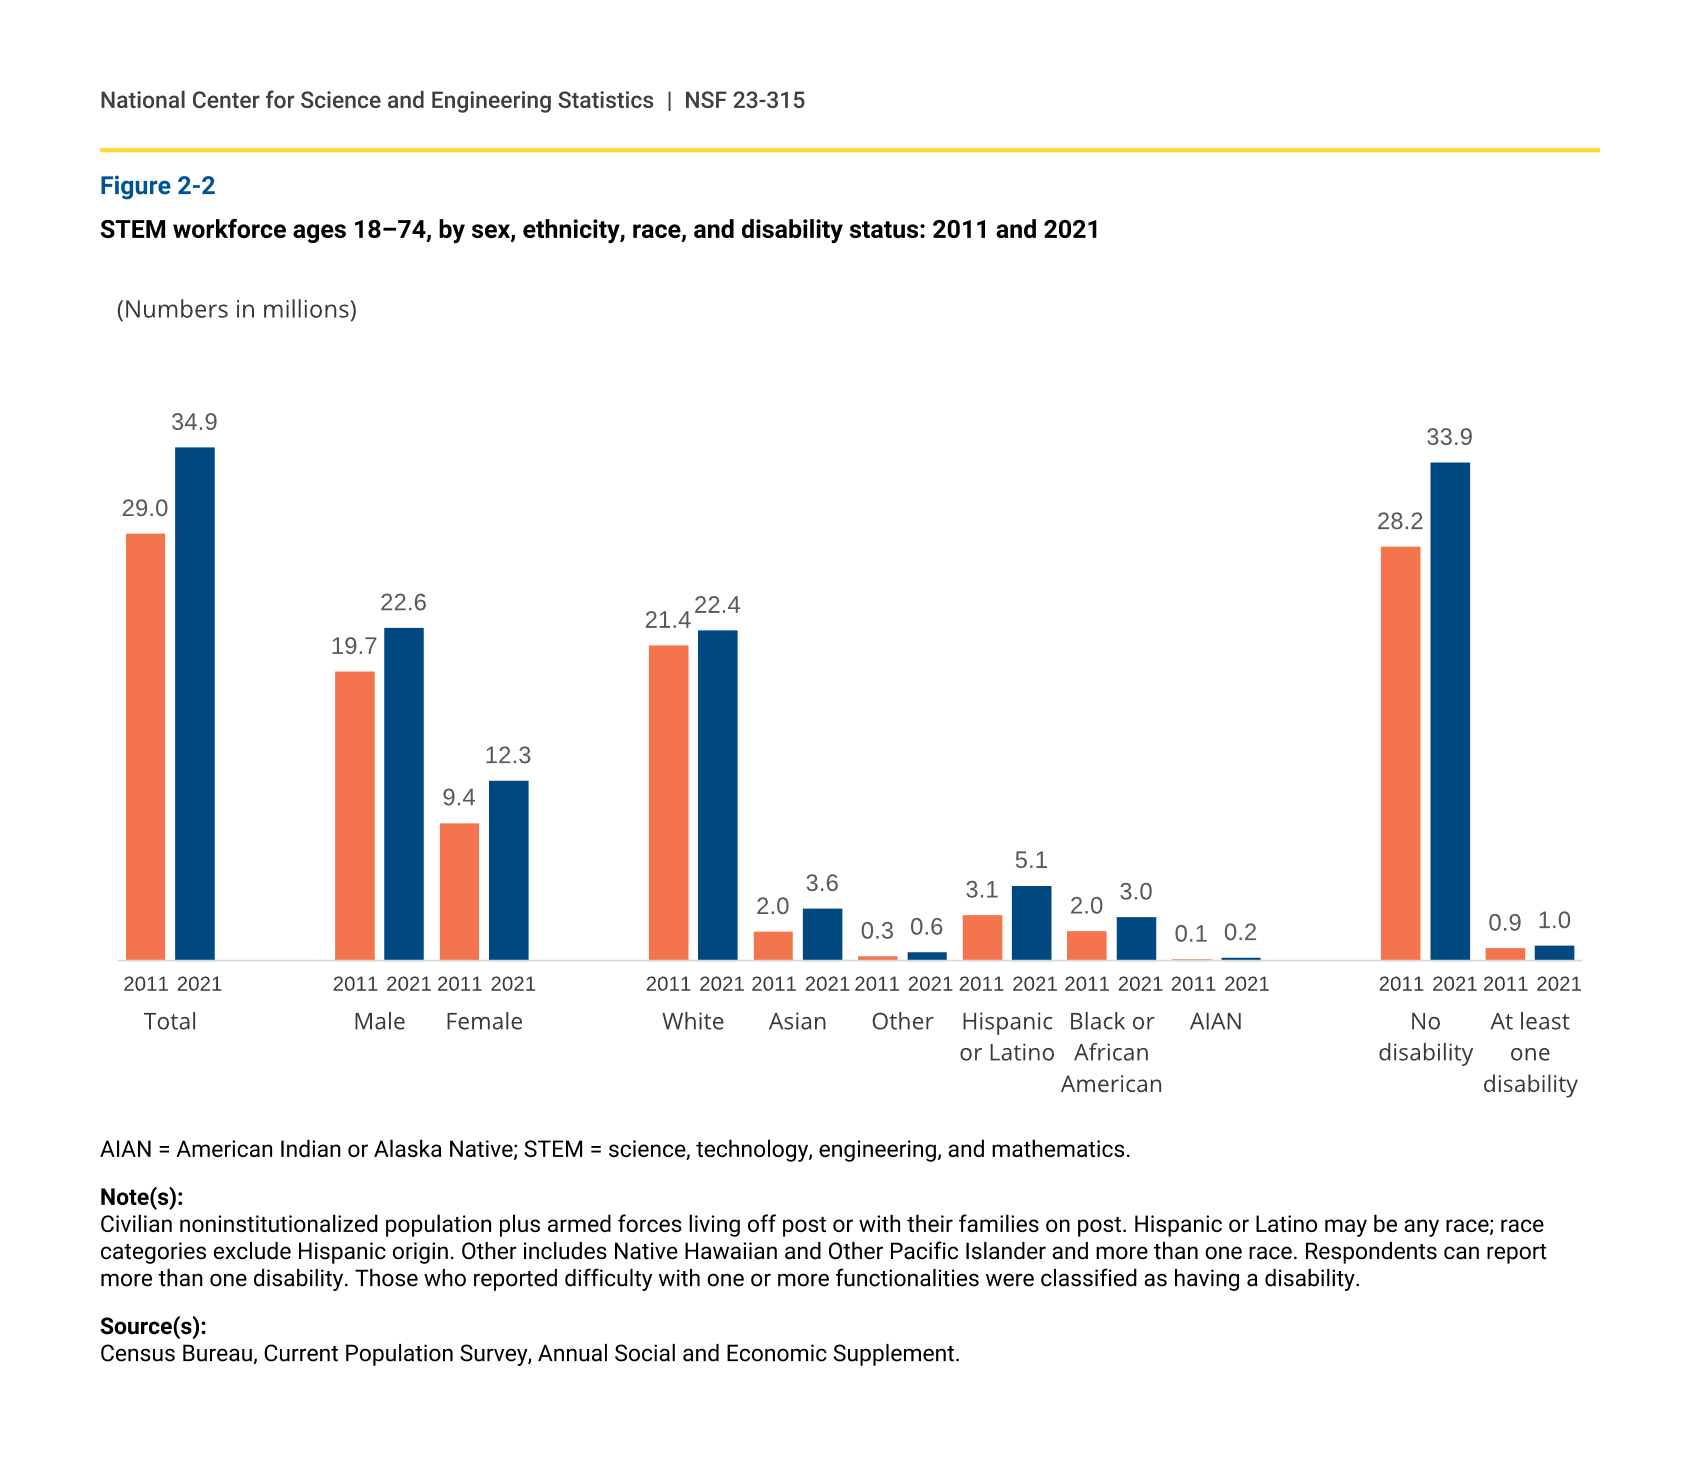
Between 2011 and 2021, the STEM workforce grew by 5.9 million, from 29.0 million to 34.9 million, representing a 20% increase (figure 2-2). STEM workers as a percentage of the total workforce also increased, from 21% in 2011 to 24% in 2021.
Although fewer women than men work in STEM occupations, their share of the STEM workforce grew at a faster rate. Between 2011 and 2021, the number of women in the STEM workforce increased 31%, from 9.4 million to 12.3 million. For men, 22.6 million were employed in STEM occupations in 2021, up 15% from the 19.7 million employed in 2011.
In 2021, White workers—at 22.4 million—represented the largest race and ethnic group in the STEM workforce, followed by workers who were Hispanic (5.1 million), Asian (3.6 million), Black (3.0 million), and American Indian or Alaska Native (216,000). Hispanic STEM workers experienced the greatest numeric growth over this period—2.0 million—increasing from 3.1 million to 5.1 million. Although the increase in STEM workers was mostly for those without disabilities, the number of STEM workers with at least one disability also increased, reaching about 1.0 million in 2021.
STEM workforce ages 18–74, by sex, ethnicity, race, and disability status: 2011 and 2021
AIAN = American Indian or Alaska Native; STEM = science, technology, engineering, and mathematics.
Note(s):
Civilian noninstitutionalized population plus armed forces living off post or with their families on post. Hispanic or Latino may be any race; race categories exclude Hispanic origin. Other includes Native Hawaiian and Other Pacific Islander and more than one race. Respondents can report more than one disability. Those who reported difficulty with one or more functionalities were classified as having a disability.
Source(s):
Census Bureau, Current Population Survey, Annual Social and Economic Supplement.
The share of women and underrepresented minorities in the STEM workforce increased between 2011 and 2021.
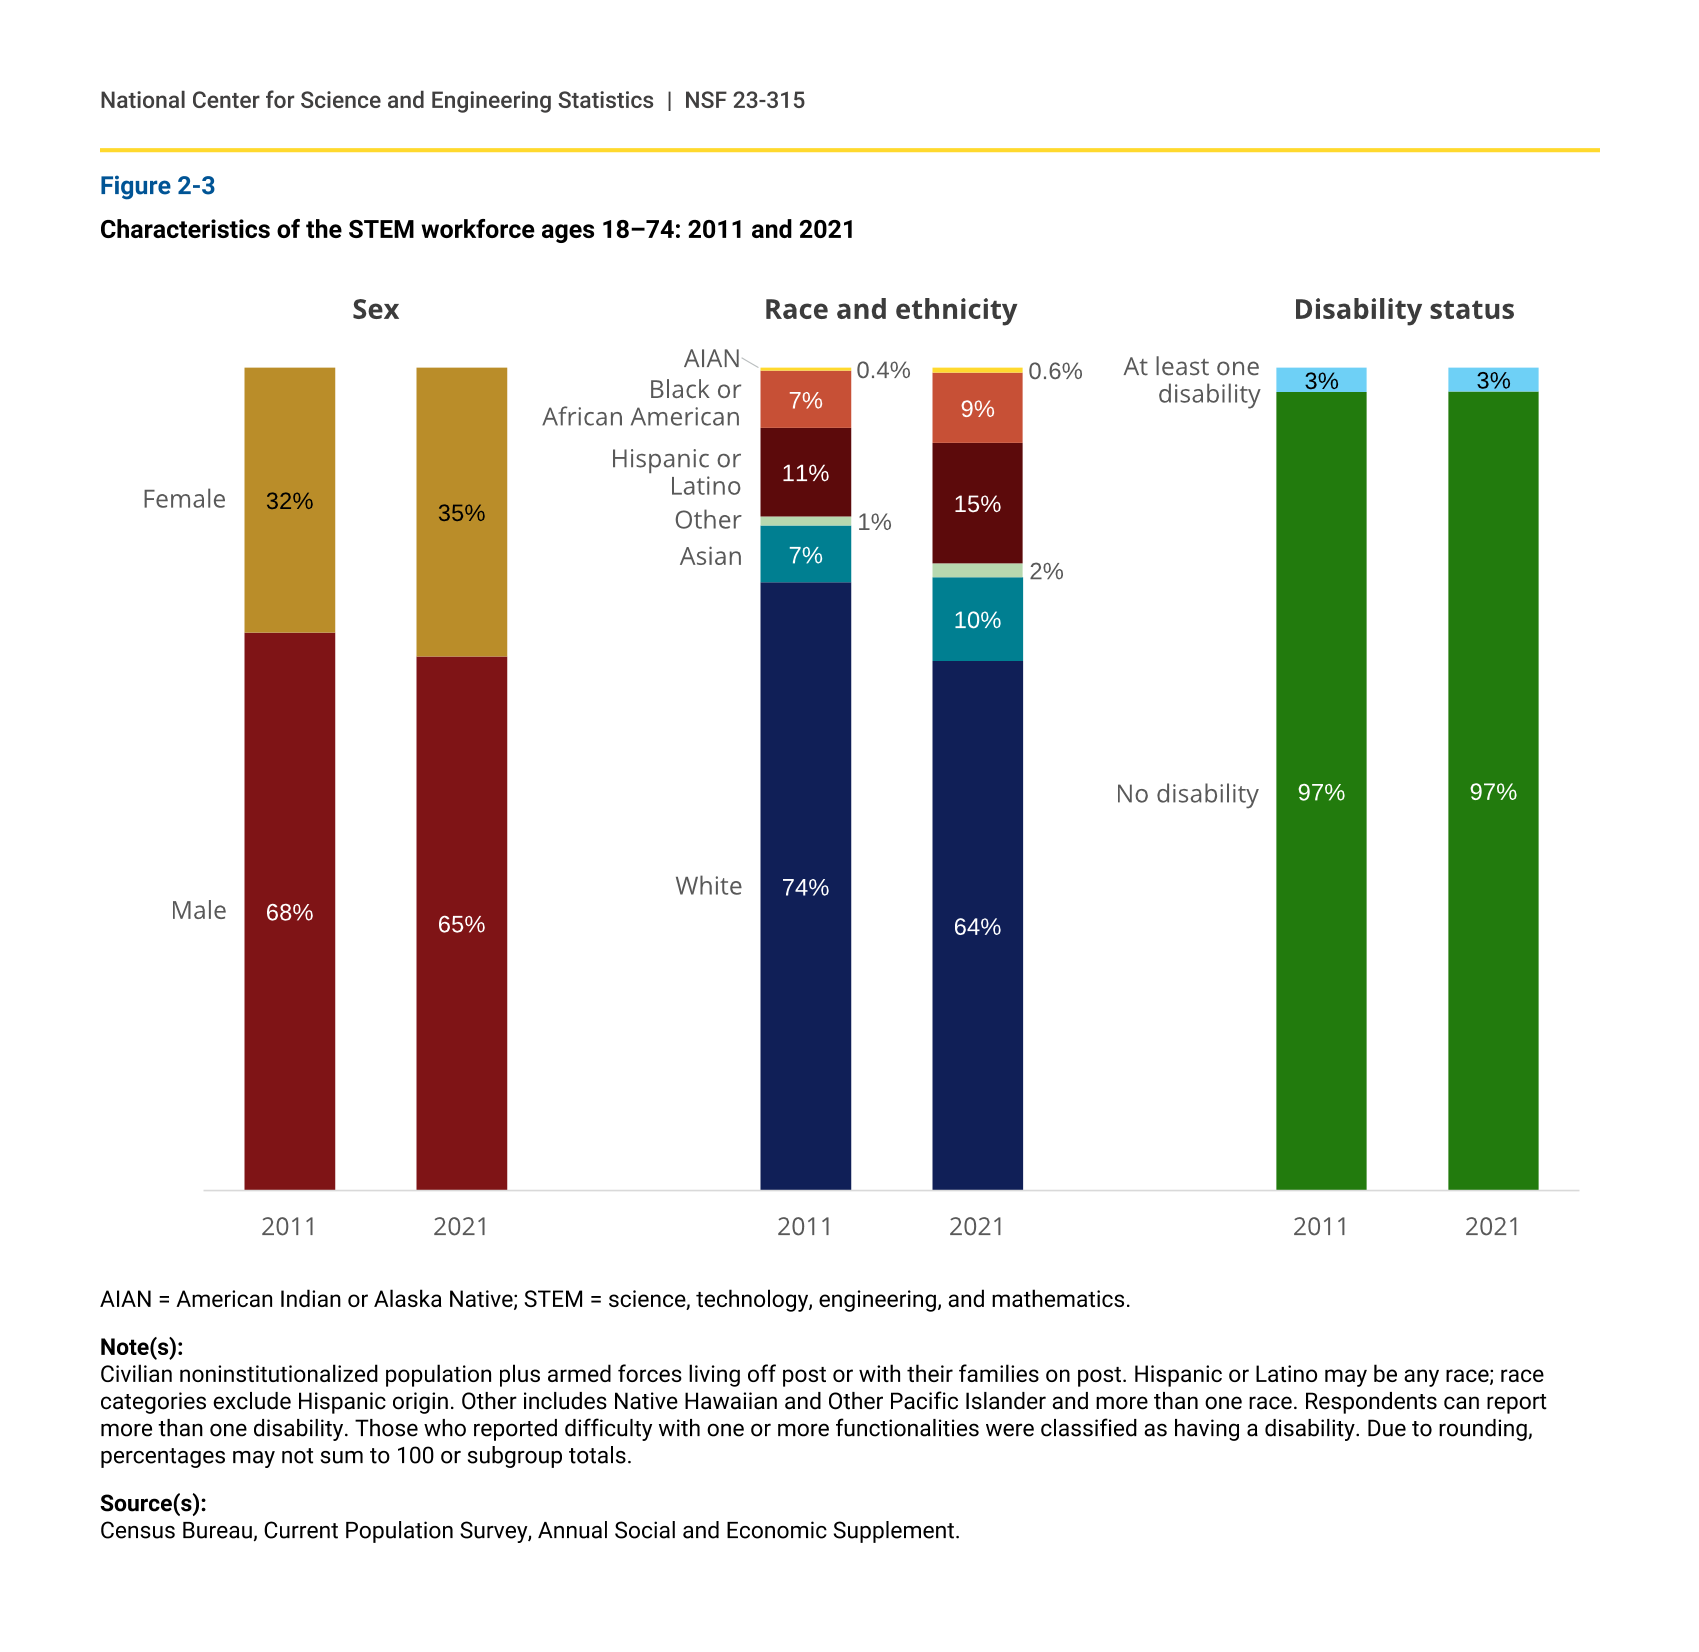
Compared with women, men make up the greater share of the STEM workforce. In 2021, about two-thirds (65%) of those employed in STEM occupations were men and about one-third (35%) were women (figure 2-3). Consistent with women’s faster growth than men’s in the STEM workforce, the proportion of the STEM workforce that were women increased by 3 percentage points from 2011 to 2021.
Collectively, underrepresented minorities—Hispanics, Blacks, and American Indians or Alaska Natives—represented nearly a quarter (24%) of the STEM workforce in 2021, up from 18% in 2011. Of these three groups, the share of Hispanics increased the most, from 11% in 2011 to 15% in 2021. As the proportion of other racial and ethnic groups increased, the proportion of White STEM workers decreased from 74% in 2011 to 64% in 2021. These data show increasing diversity within the STEM workforce over this 10-year period.
Despite the increase in the number of STEM workers with a disability, the proportion of these workers in the STEM workforce was unchanged from 2011 to 2021.
Characteristics of the STEM workforce ages 18–74: 2011 and 2021
AIAN = American Indian or Alaska Native; STEM = science, technology, engineering, and mathematics.
Note(s):
Civilian noninstitutionalized population plus armed forces living off post or with their families on post. Hispanic or Latino may be any race; race categories exclude Hispanic origin. Other includes Native Hawaiian and Other Pacific Islander and more than one race. Respondents can report more than one disability. Those who reported difficulty with one or more functionalities were classified as having a disability. Due to rounding, percentages may not sum to 100 or subgroup totals.
Source(s):
Census Bureau, Current Population Survey, Annual Social and Economic Supplement.