Report
STEM Unemployment
Overview
The unemployment rate measures the share of workers in the labor force who do not currently have a job but are available and actively looking for work. In general, underrepresented minorities—Hispanics or Latinos, Blacks or African Americans, and American Indians or Alaska Natives—experience higher rates of unemployment than their White and Asian counterparts. Data from the Census Bureau’s Current Population Survey show that during the COVID-19 pandemic, the unemployment rates of the labor force in science, technology, engineering, and mathematics (STEM) and non-STEM occupations increased between 2019 and 2021 for most demographic groups. The 2021 unemployment rates of these groups are also examined in STEM occupations according to broad occupational type—science and engineering (S&E), S&E-related, and middle-skill occupations—and according to educational attainment—with or without at least a bachelor’s degree. Although the COVID-19 pandemic affected unemployment rates of individuals in STEM occupations less than it affected the rates of those in non-STEM occupations, persistent disparities among racial and ethnic groups exist. Black STEM workers experienced the highest rate of unemployment in 2021, followed by Hispanic STEM workers. White and Asian STEM workers experienced the lowest rates of unemployment.
Unemployment Rates for STEM and Non-STEM Occupations in 2019 and 2021
Unemployment rates for both STEM and non-STEM occupations increased between 2019 and 2021.
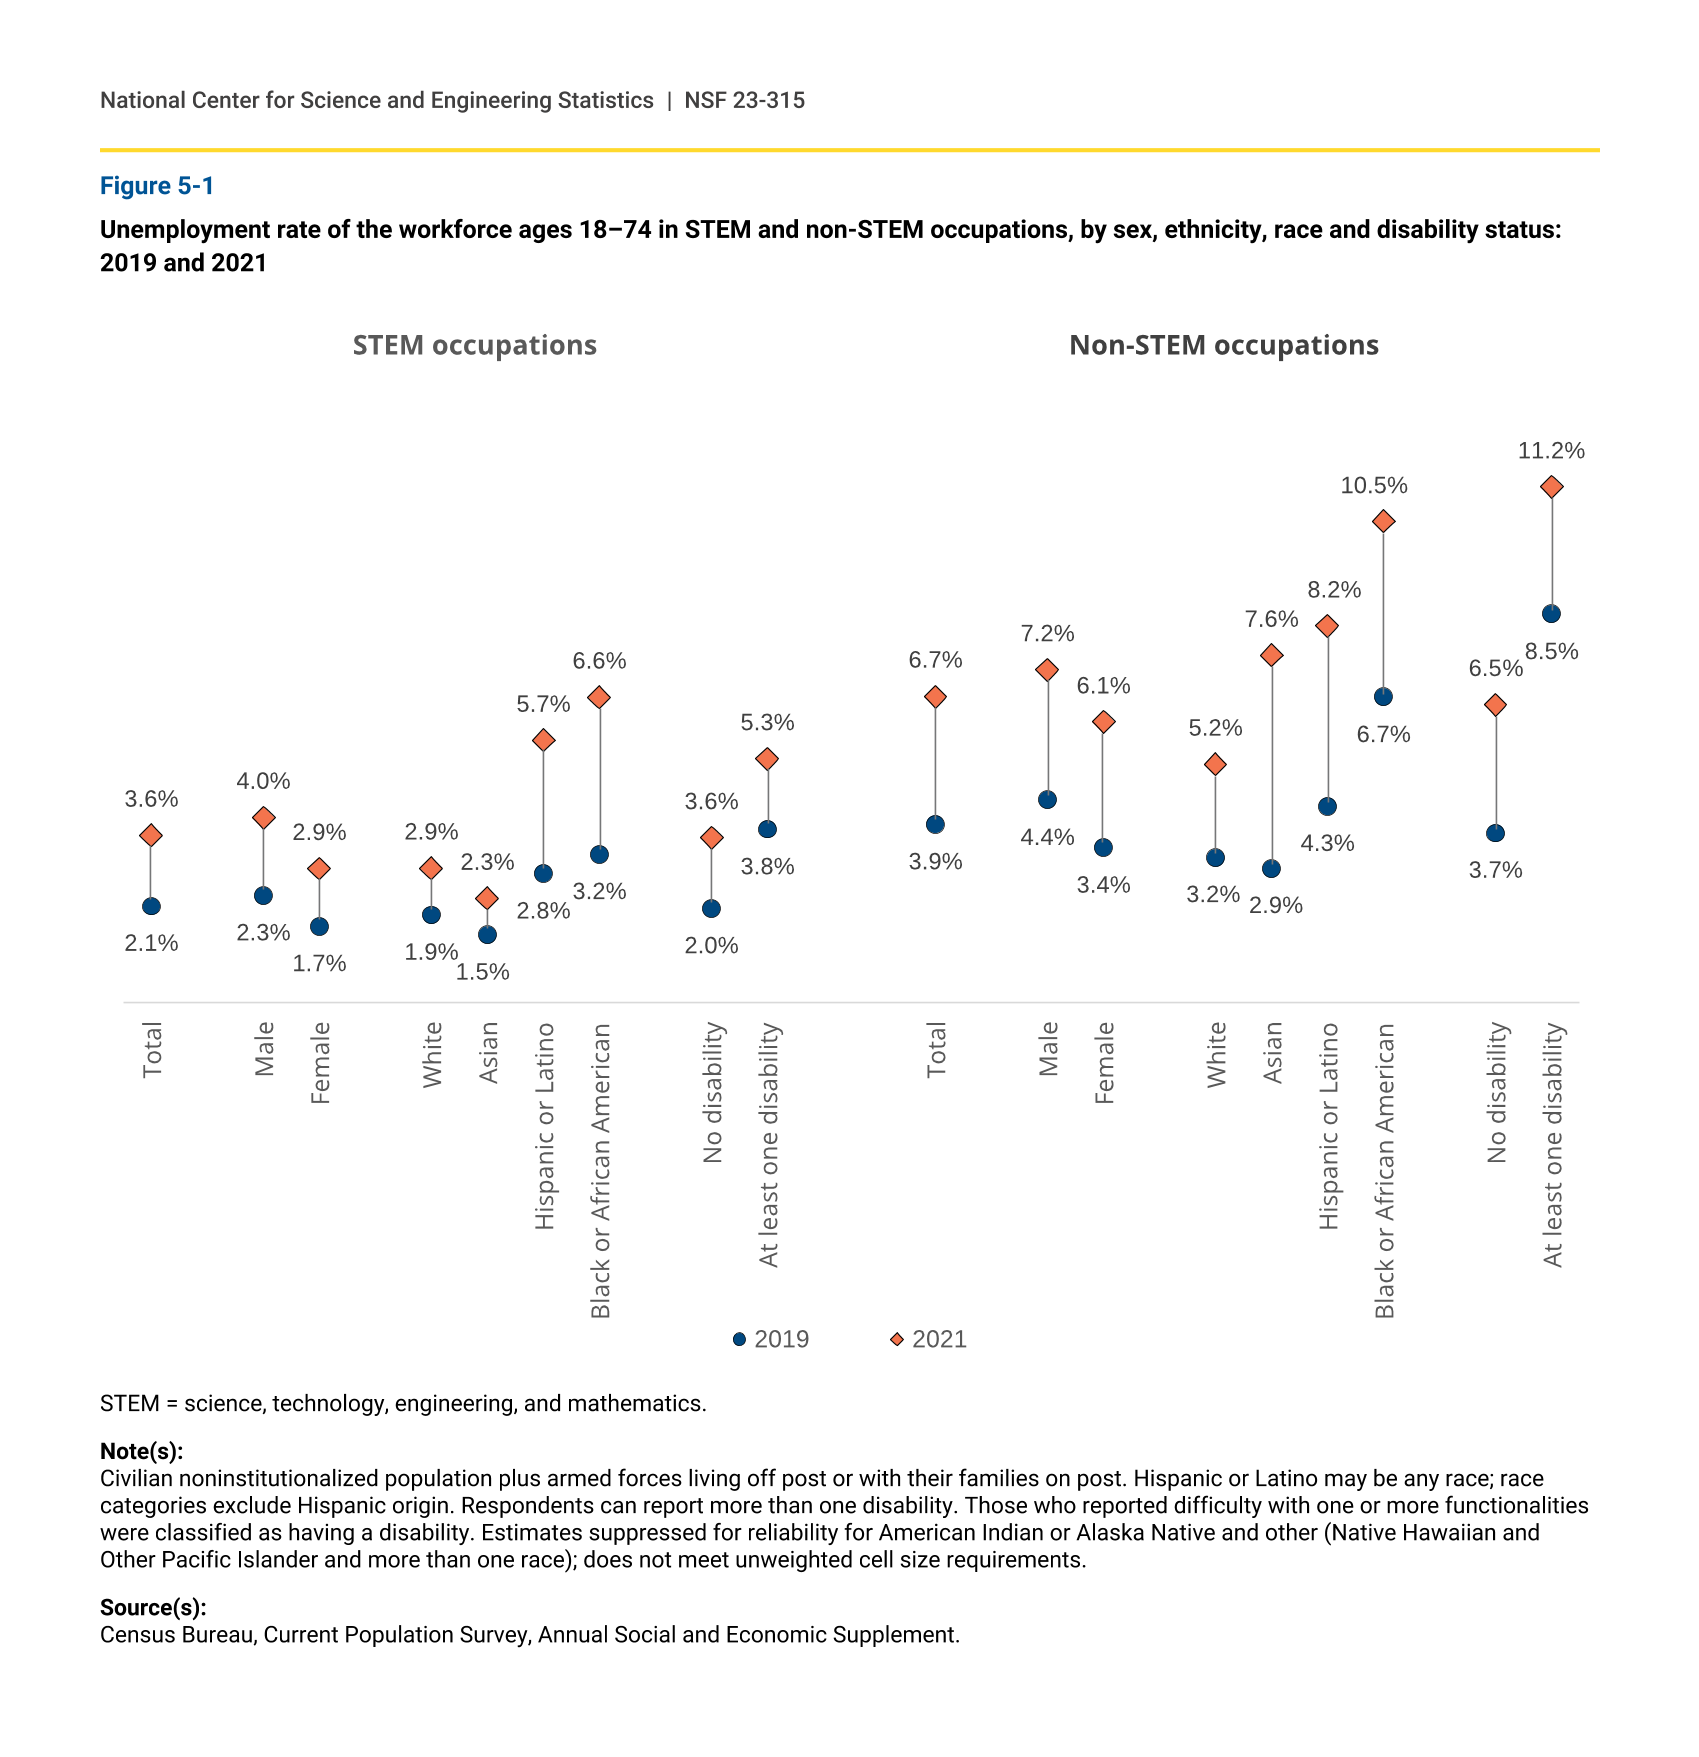
The COVID-19 pandemic had a profoundly negative impact on employment across the U.S. workforce. However, the impact was less for workers in STEM occupations than it was for those in non-STEM occupations (figure 5-1). Unemployment rates for STEM workers increased 1.5 percentage points between 2019 and 2021 (from 2.1% to 3.6%), whereas unemployment for non-STEM workers increased 2.8 percentage points (from 3.9% to 6.7%) during this period.
Unemployment rates reflect both employer and employee sides of employment. Unemployment rates are increased by job loss (employer side effect) and are decreased by workers leaving the workforce, either voluntarily or due to layoffs or job loss and not seeking reemployment. The pandemic increased the demand for some occupations and reduced the demand for others.
Unemployment rates for both men and women in STEM and non-STEM occupations increased over this 3-year period. Within each occupation group, the amount of increase for men and women was comparable. However, for both years (2019 and 2021) and both occupation groups (STEM and non-STEM), the unemployment rates for men were higher than those for women.
Within the racial and ethnic groups, increases in STEM unemployment rates between 2019 and 2021 were statistically significant for Whites, Hispanics, and Blacks but not for Asians. However, when comparing among groups, the increase was greater for Blacks (3.4 percentage points from 3.2% to 6.6%) and Hispanics (2.9 percentage points from 2.8% to 5.7%) than it was for Whites (1.0 percentage point from 1.9% to 2.9%). For non-STEM occupations, the unemployment rates in 2021 were higher than the rates in 2019 for White, Asian, Hispanic, and Black workers. The increases over the 3-year period for Asians (4.6 percentage points from 2.9% to 7.6%), Hispanics (3.9 percentage points from 4.3% to 8.2%), and Blacks (3.8 percentage points from 6.7% to 10.5%) were higher than those for Whites (2.0 percentage points 3.2% to 5.2%). Both in 2019 and 2021 and for all racial and ethnic groups, those working in STEM occupations had lower unemployment rates than those in non-STEM occupations.
Overall, the unemployment rates of workers with or without one or more disabilities were lower if they worked in STEM rather than in non-STEM occupations. However, both groups experienced comparable increases in unemployment in STEM and non-STEM occupations from 2019 to 2021. The unemployment rate for workers in non-STEM occupations with at least one disability was higher in 2021 (11.2%) than in 2019 (8.5%). In contrast, unemployment rates were comparable in 2021 (5.3%) and in 2019 (3.8%) for workers with at least one disability in STEM occupations. For those without a disability, the unemployment rates for both occupation groups increased over the 3-year period.
Unemployment rate of the workforce ages 18–74 in STEM and non-STEM occupations, by sex, ethnicity, race and disability status: 2019 and 2021
STEM = science, technology, engineering, and mathematics.
Note(s):
Civilian noninstitutionalized population plus armed forces living off post or with their families on post. Hispanic or Latino may be any race; race categories exclude Hispanic origin. Respondents can report more than one disability. Those who reported difficulty with one or more functionalities were classified as having a disability. Estimates suppressed for reliability for American Indian or Alaska Native and other (Native Hawaiian and Other Pacific Islander and more than one race); does not meet unweighted cell size requirements.
Source(s):
Census Bureau, Current Population Survey, Annual Social and Economic Supplement.
Unemployment Rates in S&E, S&E-Related, and Middle-Skill Occupations
STEM workers in middle-skill occupations have a higher unemployment rate than those in S&E or S&E-related occupations.
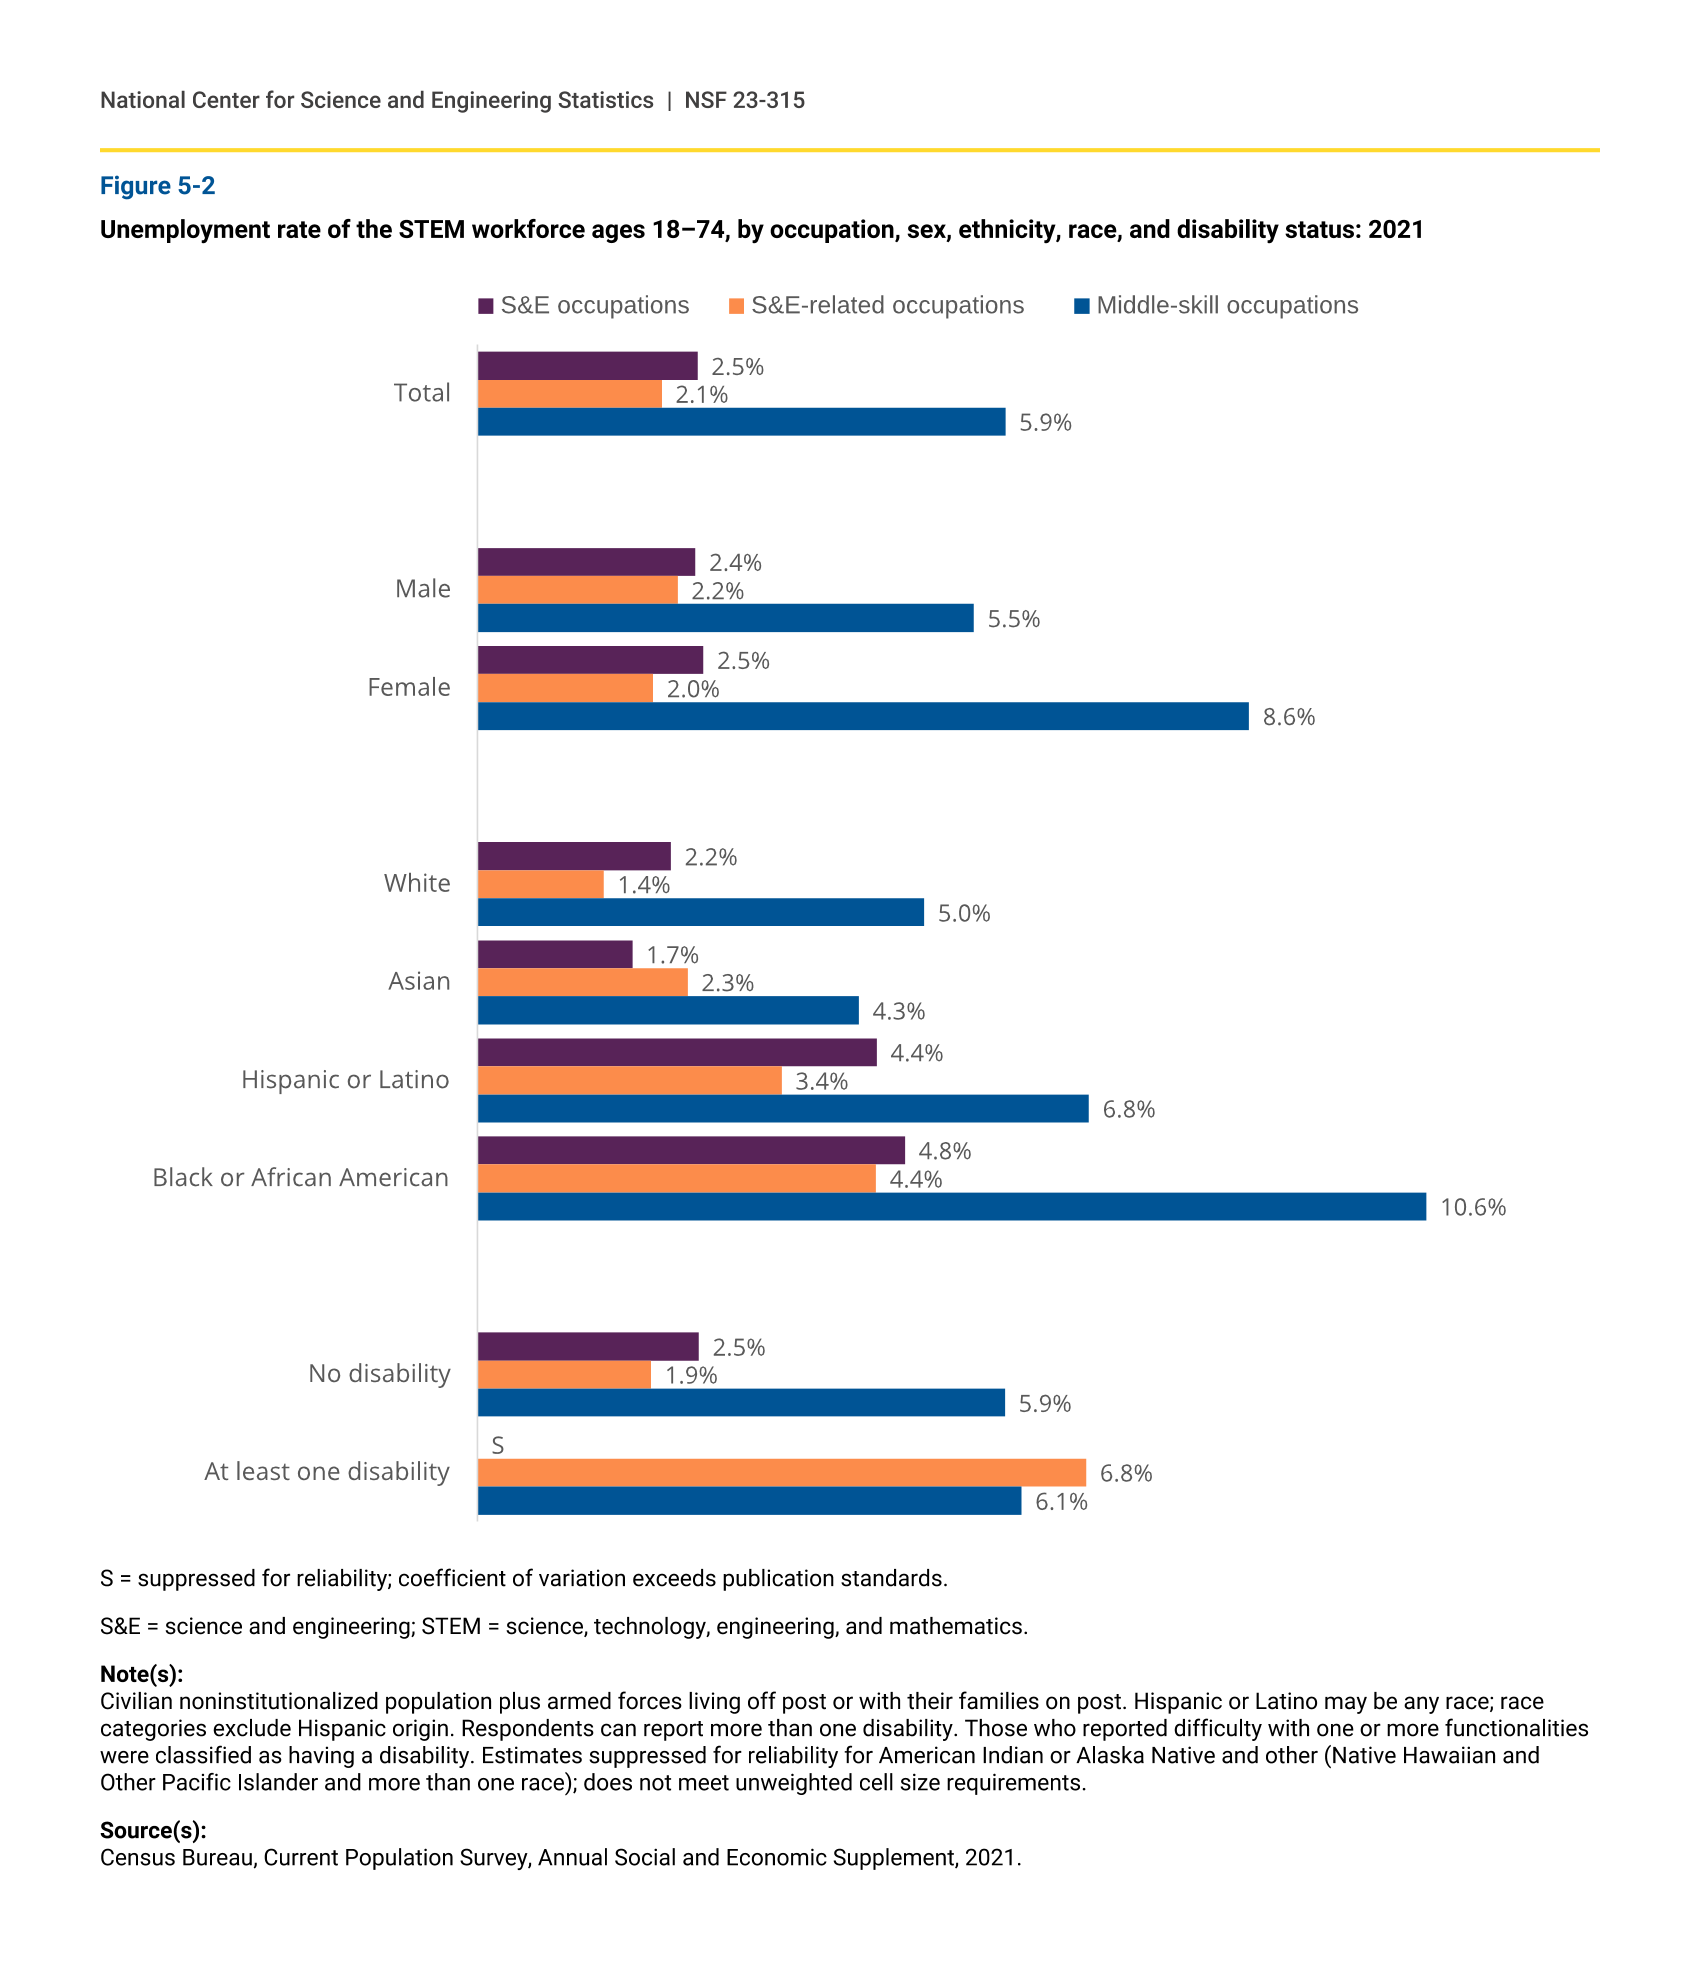
When the STEM workforce is divided by broad occupation type, those in middle-skill occupations had the highest unemployment rate in 2021 (5.9%), which was about twice that of S&E (2.5%) and over twice that of S&E-related (2.1%) occupations (figure 5-2). Higher unemployment rates for middle-skill occupations occurred across all groups of workers except for those with at least one disability.
Unemployment rate of the STEM workforce ages 18–74, by occupation, sex, ethnicity, race, and disability status: 2021
S = suppressed for reliability; coefficient of variation exceeds publication standards.
S&E = science and engineering; STEM = science, technology, engineering, and mathematics.
Note(s):
Civilian noninstitutionalized population plus armed forces living off post or with their families on post. Hispanic or Latino may be any race; race categories exclude Hispanic origin. Respondents can report more than one disability. Those who reported difficulty with one or more functionalities were classified as having a disability. Estimates suppressed for reliability for American Indian or Alaska Native and other (Native Hawaiian and Other Pacific Islander and more than one race); does not meet unweighted cell size requirements.
Source(s):
Census Bureau, Current Population Survey, Annual Social and Economic Supplement, 2021.
Although women in middle-skill occupations had a higher unemployment rate than men in these occupations, the unemployment rates for men and women in S&E or S&E-related occupations were similar.
In the middle-skill occupations, Blacks experienced the highest unemployment rate (10.6%) out of all the racial and ethnic groups. Unemployment rates for S&E workers who are Black (4.8%) or Hispanic (4.4%) were higher than those who are Asian (1.7%) or White (2.2%). In S&E-related occupations, Whites had lower unemployment rates (1.4%) than did Blacks (4.4%) and Hispanics (3.4%), but they had rates that were comparable to Asians (2.3%).
Although STEM workers with no disabilities had similar unemployment rates as those with disabilities in middle-skill occupations (5.9% and 6.1%, respectively), their rate was notably lower than that for those with a disability in S&E-related occupations (1.9% and 6.8%, respectively).
Unemployment Rates by Educational Attainment in the STEM Labor Force
The skilled technical workforce has a higher unemployment rate than STEM workers with a bachelor’s degree or higher.
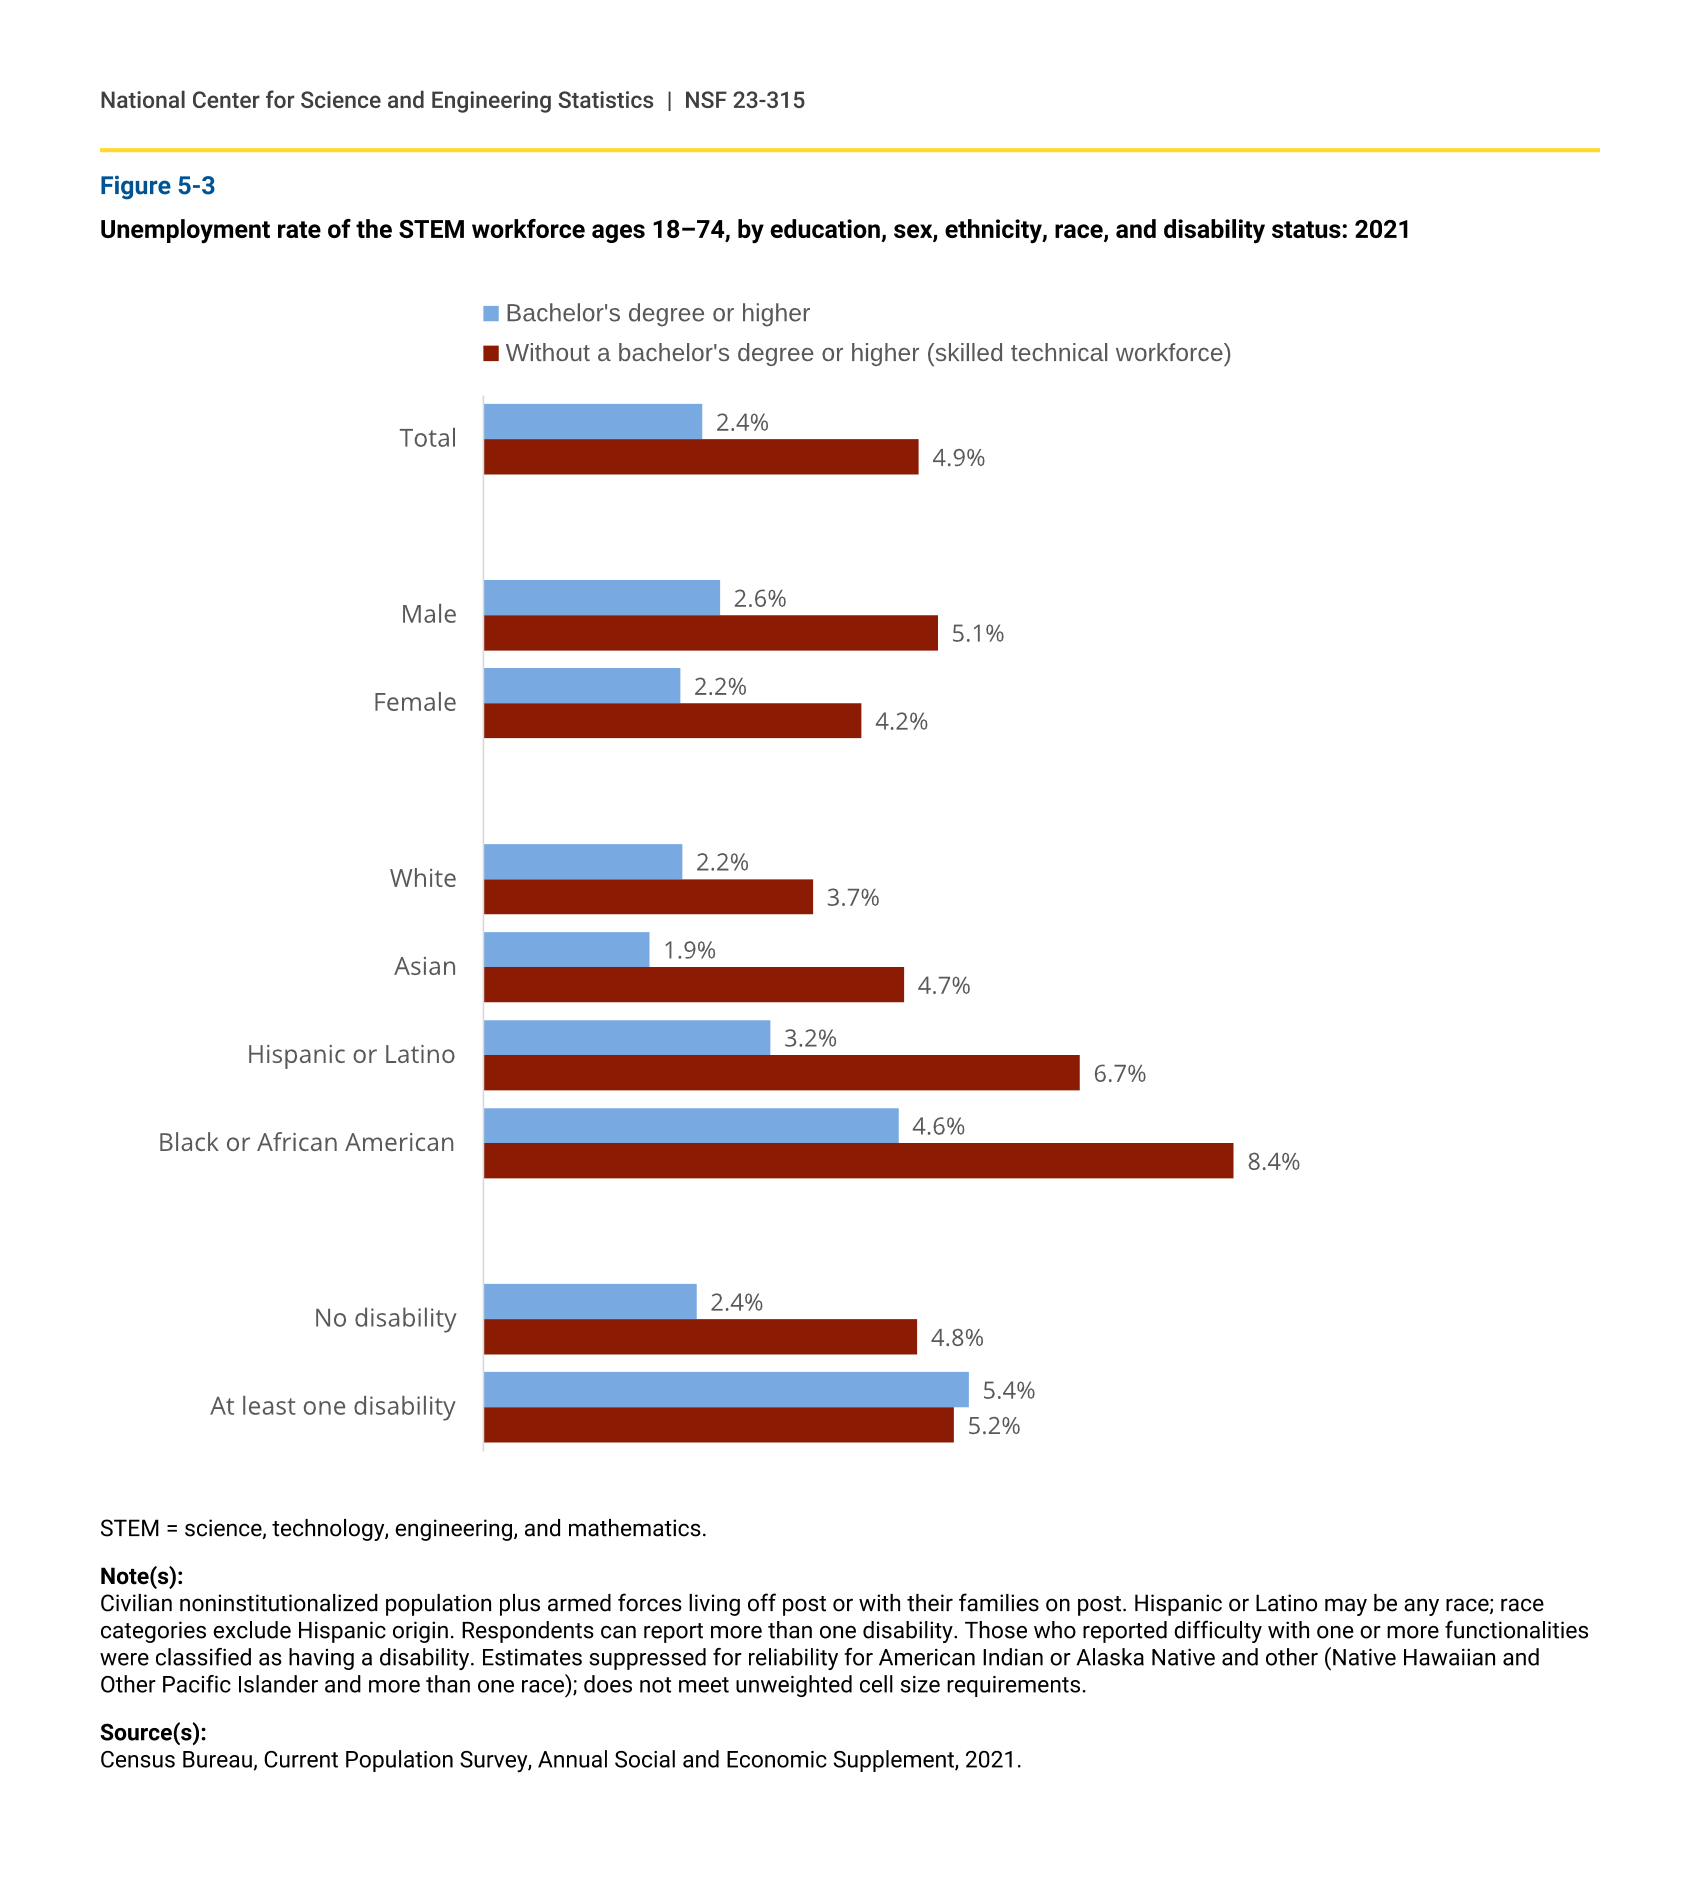
Overall, among all STEM workers in 2021, higher educational attainment is associated with lower unemployment (figure 5-3). STEM workers with a bachelor’s degree or higher had a lower unemployment rate than those employed in the skilled technical workforce (2.4% vs. 4.9%).
For both men and women, unemployment was higher if they worked in the skilled technical workforce than if they were STEM workers with at least a bachelor’s degree. However, there was no difference in the unemployment rates of men and women in the STEM workforce by education: 2.6% of men and 2.2% of women with at least a bachelor’s degree were unemployed, as were 5.1% men and 4.2% of women without a bachelor’s degree.
The pattern of higher unemployment rates for workers in the skilled technical workforce than for STEM workers with at least a bachelor’s degree persists across all racial and ethnic groups. However, in both educational groups, Blacks had higher unemployment rates than Whites or Asians, but their rates were not statistically different from rates of Hispanic unemployment. In the skilled technical workforce, Hispanic unemployment was higher than White unemployment, but it was not statistically different from the unemployment rates of Asians and Blacks.
For STEM workers with at least one disability, educational attainment had little effect on unemployment. For those with a disability, the unemployment rate among the skilled technical workforce (5.2%) was about the same as the rate among the workforce with a bachelor’s degree or higher (5.4%). Likewise, when comparing the unemployment rates of each educational group by disability status, the differences between the estimates are not statistically significant. That is, unemployment rates are comparable between those with at least a bachelor’s degree who have one or more disabilities (5.4%) and those who have no disability (2.4%). Additionally, there is no statistical difference between the unemployment rates for those without a bachelor’s degree by disability status (5.2% with at least one disability vs. 4.8% with no disability).
Unemployment rate of the STEM workforce ages 18–74, by education, sex, ethnicity, race, and disability status: 2021
STEM = science, technology, engineering, and mathematics.
Note(s):
Civilian noninstitutionalized population plus armed forces living off post or with their families on post. Hispanic or Latino may be any race; race categories exclude Hispanic origin. Respondents can report more than one disability. Those who reported difficulty with one or more functionalities were classified as having a disability. Estimates suppressed for reliability for American Indian or Alaska Native and other (Native Hawaiian and Other Pacific Islander and more than one race); does not meet unweighted cell size requirements.
Source(s):
Census Bureau, Current Population Survey, Annual Social and Economic Supplement, 2021.