 An official website of the United States government
Report
Postgraduation trends
A graduate’s first position after earning their doctoral degree may reflect broad economic conditions and can shape later career opportunities, earnings, and choices. Over the longer term, the early career patterns of doctorate recipients may influence the decisions of future students considering careers as scientists, engineers, scholars, and researchers.
Definite commitments at graduation
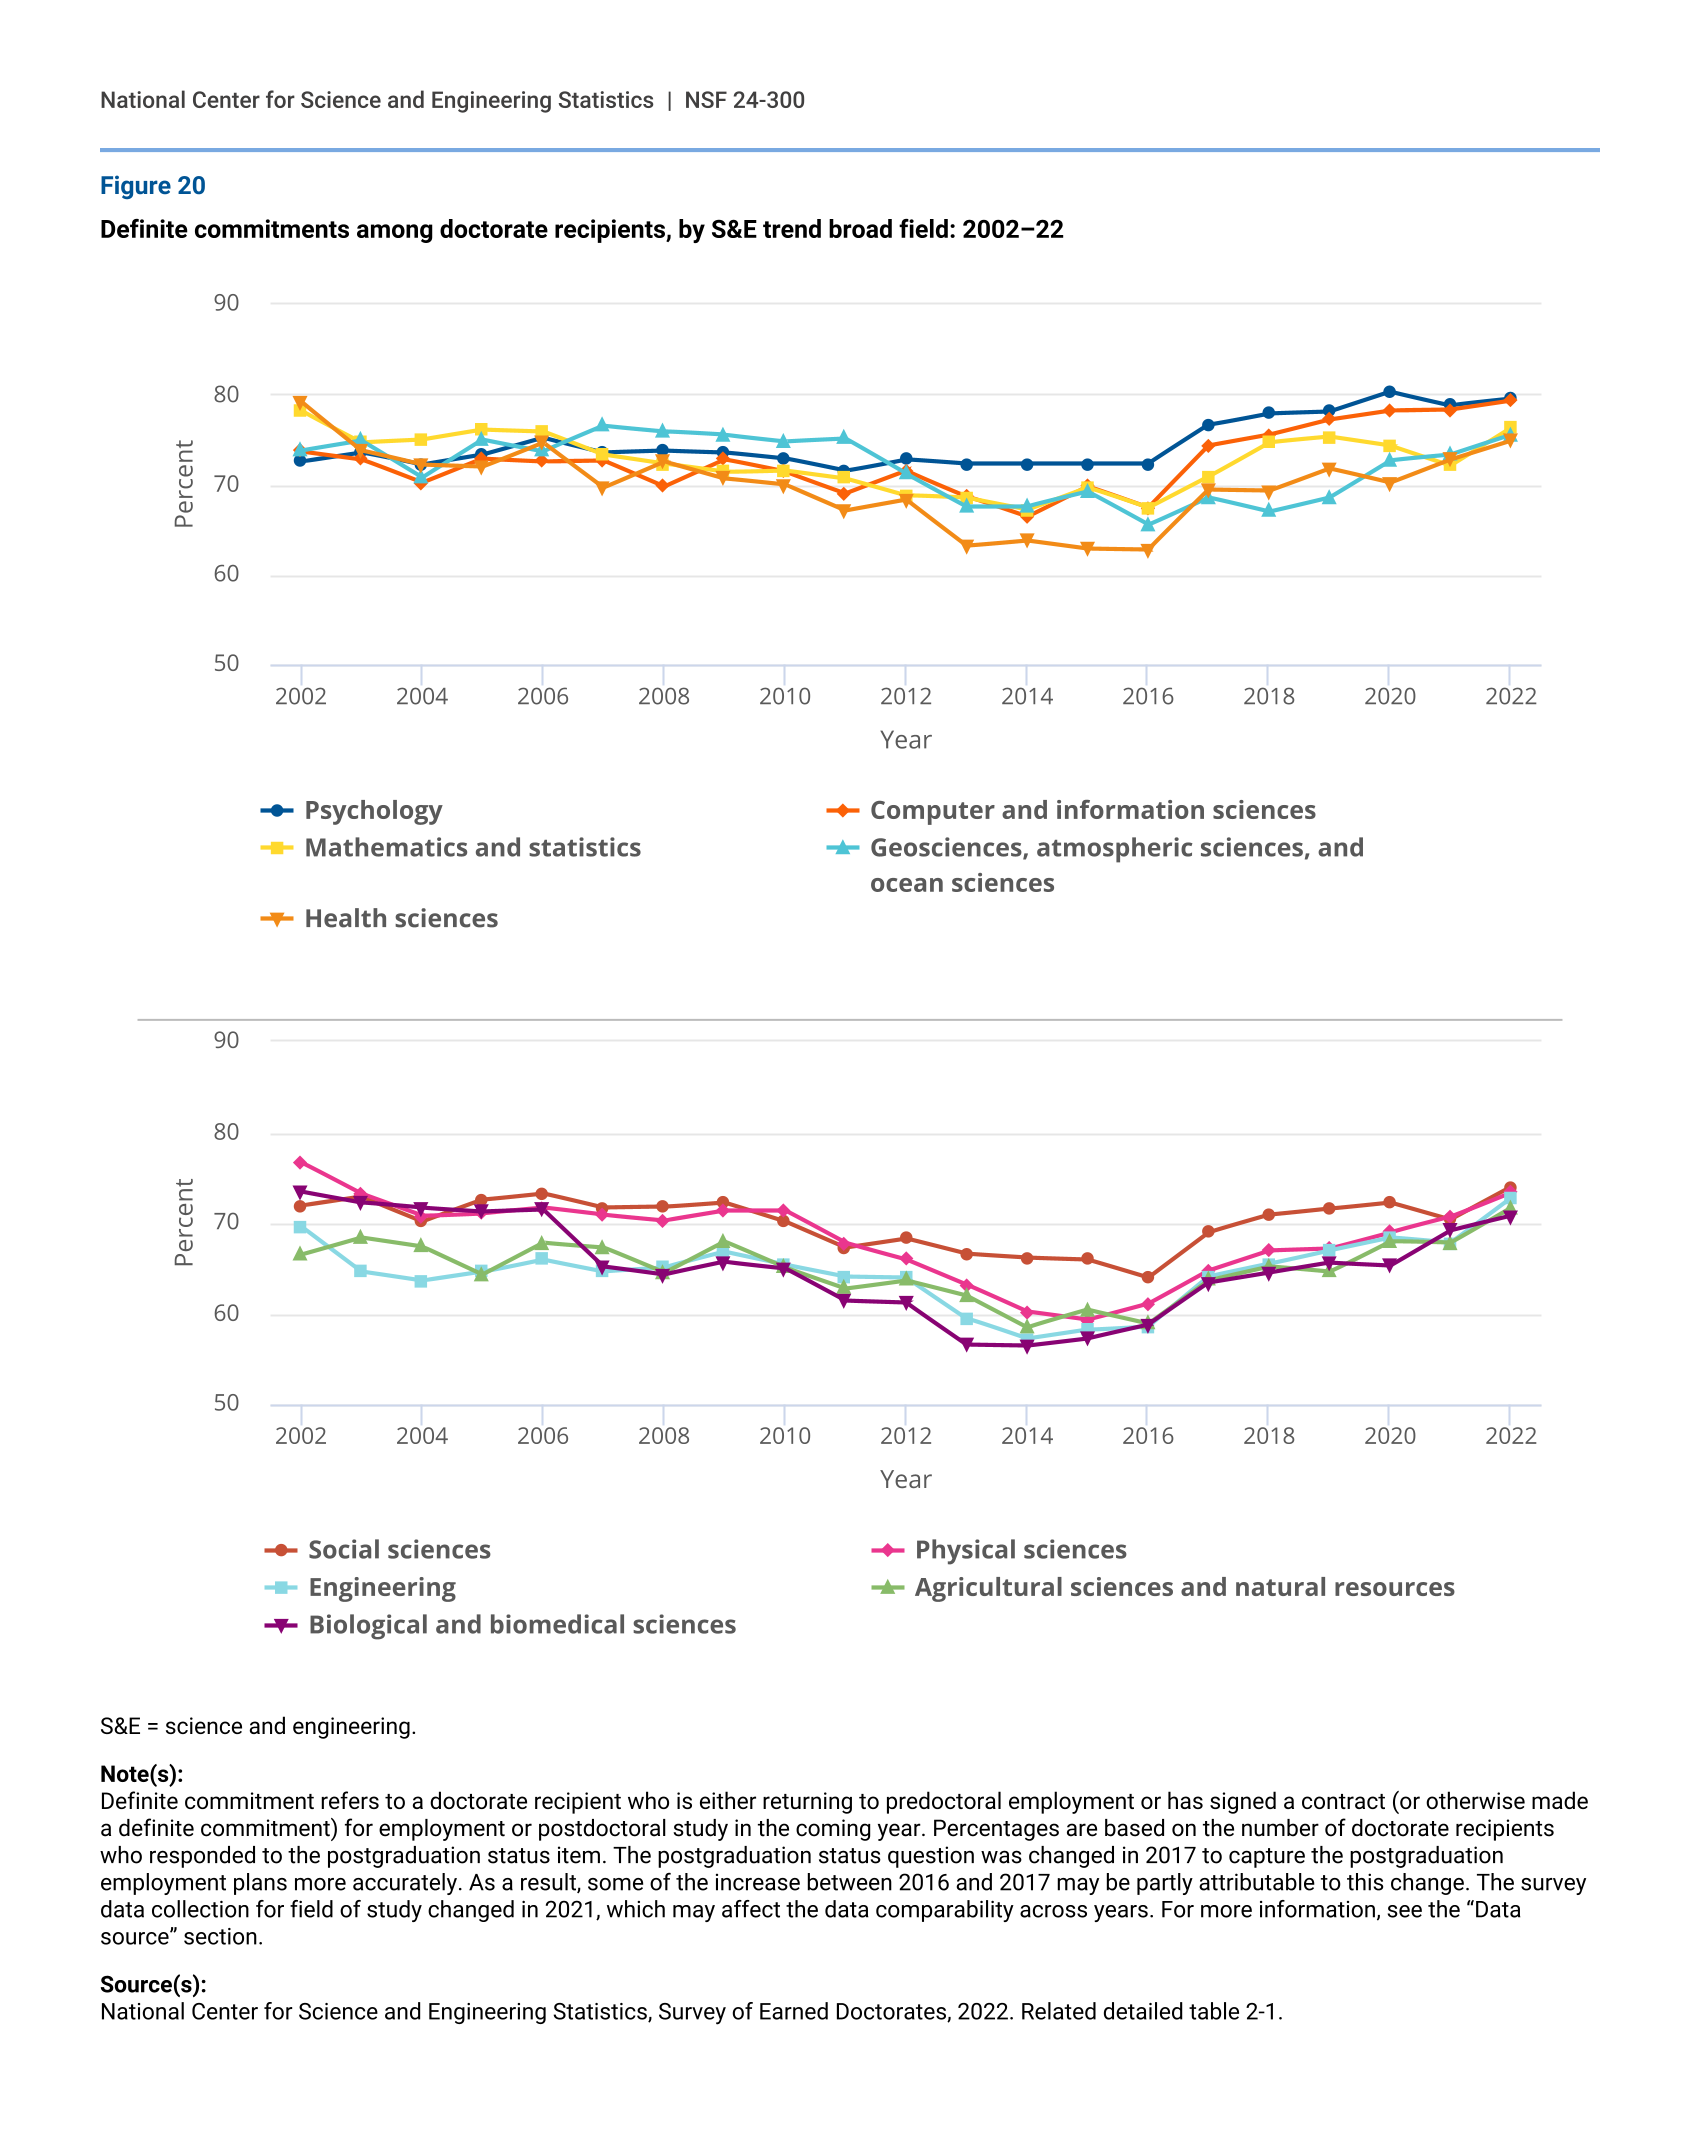
At any given time, the job market outlook for new doctorate recipients will be better in some doctorate fields than in others. Though all fields tend to follow patterns that generally reflect overall trends in economic conditions, definite commitments at graduation are likely to be influenced by many factors. In general, doctorate recipients in S&E fields tend to have robust postgraduation career prospects. The proportions of 2022 doctorate recipients in S&E with definite commitments, including postdoctoral study (postdoc) positions, ranged from 71% and 72% in biological and biomedical sciences and in agricultural sciences to 79% and 80% in computer and information sciences and in psychology (figure 20). In 2022, the proportions of computer and information sciences and psychology doctorate recipients with definite commitments were at or near their all-time high.
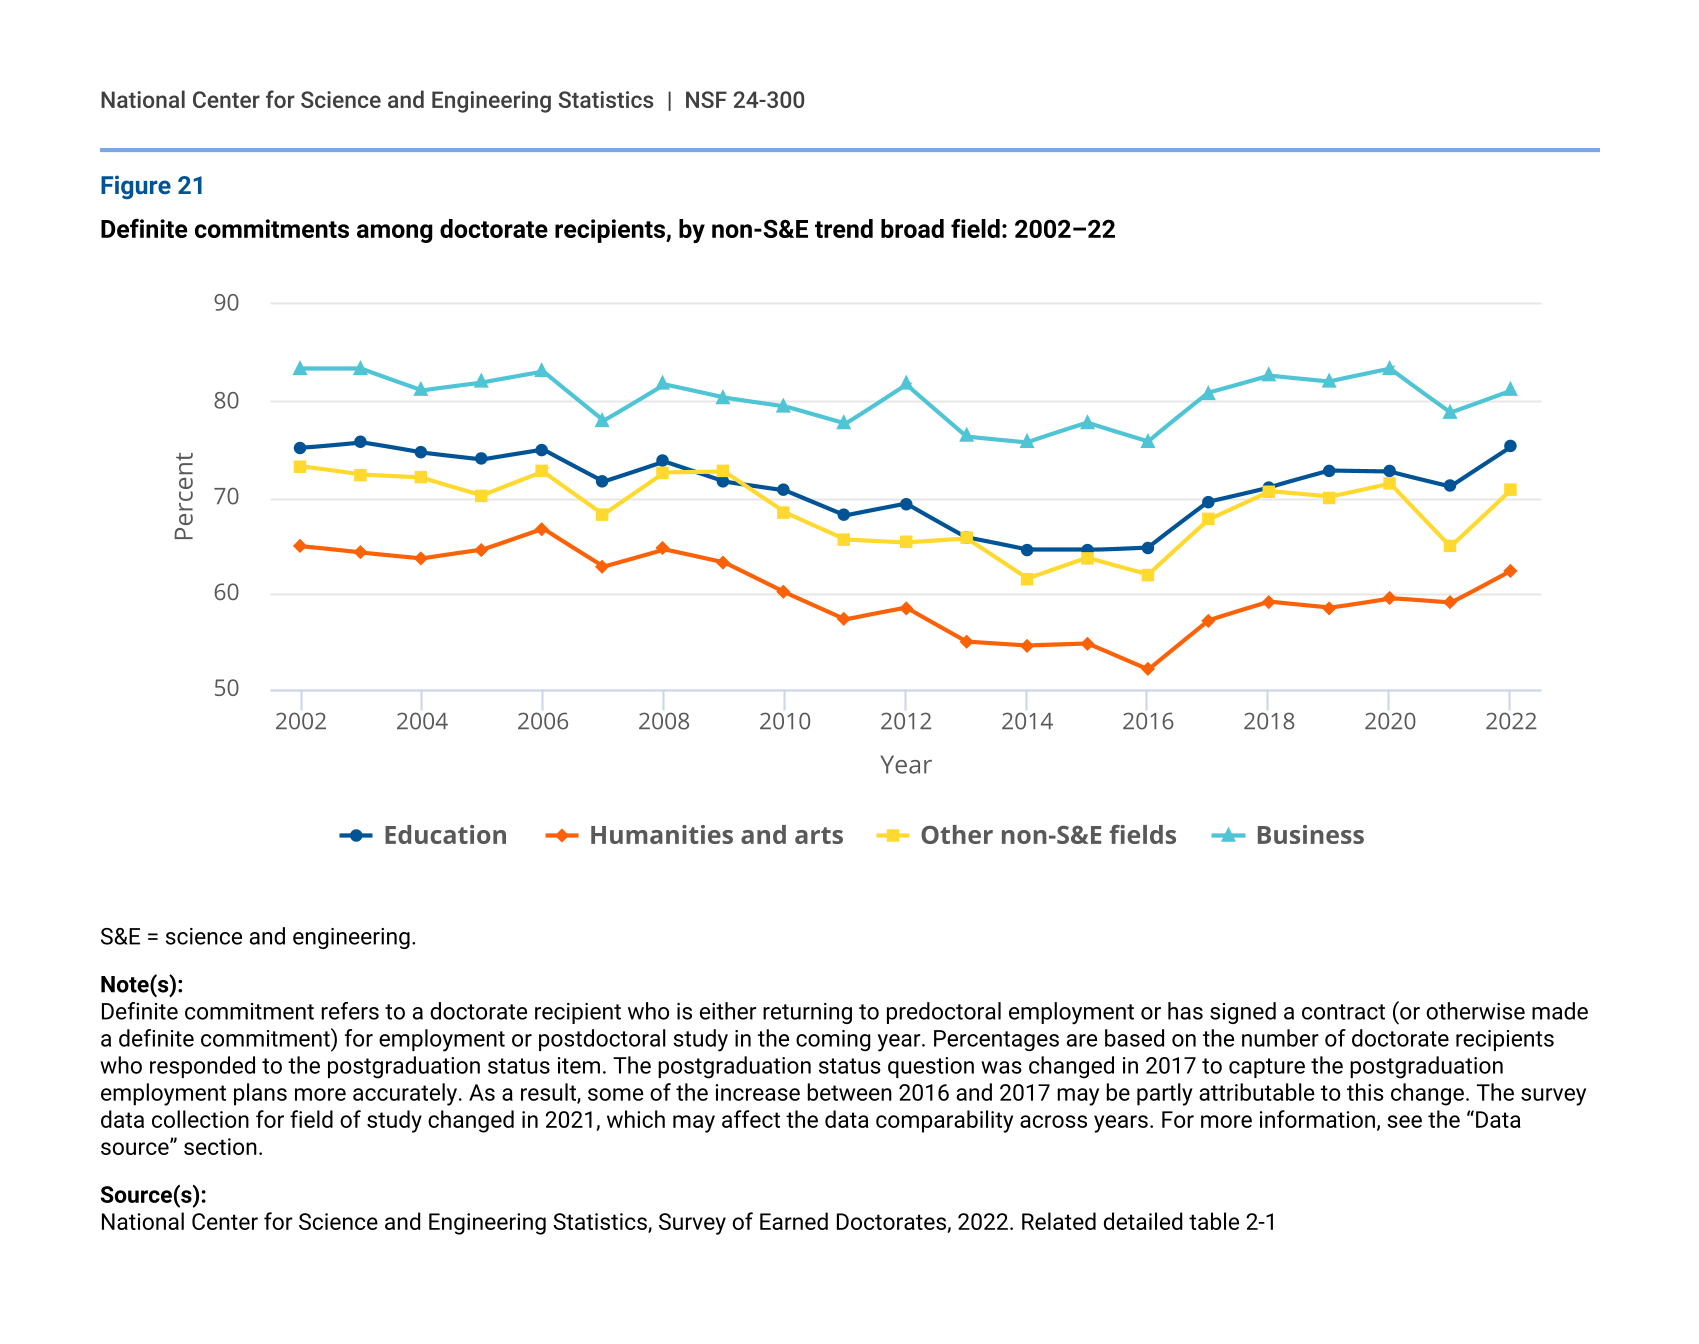
In several S&E broad fields, the proportion of doctorate recipients with definite commitments at graduation was lower compared with 20 years ago. The fields with declines between 2002 and 2022 were in health sciences (from 79% to 75%), physical sciences (from 77% to 73%), biological and biomedical sciences (from 74% to 71%), and mathematics and statistics (from 78% to 76%). Since 2021, the proportion of doctorate recipients with definite commitments increased in all fields. The largest percentage-point increases in definite commitments were in engineering; mathematics and statistics; agricultural sciences and natural resources; and social sciences. (For more details on the effects of the pandemic on definite commitments, see section “Special focus: COVID-19 pandemic impacts on doctorate recipients”). Between 2002 and 2022 the proportion of doctorate recipients in non-S&E fields reporting definite commitments declined in humanities and arts and business, with a bottoming out of all non-S&E fields from 2014 to 2016 (figure 21). Doctorate recipients in non-S&E broad fields experienced another drop between 2020 and 2021 during the pandemic, but these fields rebounded from those declines by 2022.
Definite commitments among doctorate recipients, by S&E trend broad field: 2002–22
| Year | Psychology | Computer and information sciences | Mathematics and statistics | Geosciences, atmospheric sciences, and ocean sciences | Health sciences |
|---|---|---|---|---|---|
| 2002 | 72.6 | 73.7 | 78.2 | 73.8 | 79.2 |
| 2003 | 73.6 | 72.8 | 74.7 | 74.9 | 73.8 |
| 2004 | 72.2 | 70.2 | 75.0 | 70.8 | 72.2 |
| 2005 | 73.3 | 72.9 | 76.1 | 75.0 | 72.0 |
| 2006 | 75.2 | 72.6 | 75.9 | 73.7 | 74.7 |
| 2007 | 73.6 | 72.7 | 73.3 | 76.5 | 69.7 |
| 2008 | 73.8 | 69.8 | 72.3 | 75.9 | 72.6 |
| 2009 | 73.6 | 72.8 | 71.4 | 75.5 | 70.7 |
| 2010 | 72.9 | 71.4 | 71.6 | 74.8 | 70.0 |
| 2011 | 71.5 | 69.0 | 70.7 | 75.1 | 67.1 |
| 2012 | 72.8 | 71.5 | 68.8 | 71.2 | 68.3 |
| 2013 | 72.3 | 68.7 | 68.5 | 67.6 | 63.2 |
| 2014 | 72.3 | 66.4 | 67.2 | 67.6 | 63.8 |
| 2015 | 72.3 | 69.8 | 69.7 | 69.2 | 62.9 |
| 2016 | 72.3 | 67.4 | 67.4 | 65.5 | 62.8 |
| 2017 | 76.6 | 74.3 | 70.9 | 68.6 | 69.4 |
| 2018 | 77.9 | 75.5 | 74.7 | 67.0 | 69.3 |
| 2019 | 78.1 | 77.2 | 75.3 | 68.6 | 71.8 |
| 2020 | 80.3 | 78.2 | 74.3 | 72.7 | 70.2 |
| 2021 | 78.8 | 78.3 | 72.1 | 73.3 | 72.8 |
| 2022 | 79.5 | 79.3 | 76.3 | 75.5 | 74.9 |
| Year | Social sciences | Physical sciences | Engineering | Agricultural sciences and natural resources | Biological and biomedical sciences |
|---|---|---|---|---|---|
| 2002 | 71.9 | 76.7 | 69.6 | 66.5 | 73.5 |
| 2003 | 72.9 | 73.2 | 64.6 | 68.4 | 72.3 |
| 2004 | 70.2 | 70.8 | 63.6 | 67.4 | 71.7 |
| 2005 | 72.6 | 71.1 | 64.6 | 64.3 | 71.3 |
| 2006 | 73.3 | 71.7 | 66.0 | 67.8 | 71.5 |
| 2007 | 71.7 | 70.9 | 64.7 | 67.3 | 65.2 |
| 2008 | 71.8 | 70.3 | 65.1 | 64.5 | 64.3 |
| 2009 | 72.3 | 71.4 | 66.8 | 68.0 | 65.7 |
| 2010 | 70.2 | 71.4 | 65.4 | 65.1 | 65.0 |
| 2011 | 67.3 | 67.8 | 64.1 | 62.8 | 61.4 |
| 2012 | 68.3 | 66.0 | 64.0 | 63.7 | 61.2 |
| 2013 | 66.6 | 63.2 | 59.5 | 62.0 | 56.6 |
| 2014 | 66.2 | 60.2 | 57.2 | 58.5 | 56.5 |
| 2015 | 66.0 | 59.3 | 58.2 | 60.4 | 57.3 |
| 2016 | 64.0 | 61.1 | 58.6 | 58.9 | 58.8 |
| 2017 | 69.0 | 64.8 | 64.1 | 63.7 | 63.4 |
| 2018 | 70.9 | 67.0 | 65.5 | 65.2 | 64.5 |
| 2019 | 71.6 | 67.2 | 67.0 | 64.6 | 65.6 |
| 2020 | 72.3 | 69.0 | 68.4 | 68.0 | 65.3 |
| 2021 | 70.4 | 70.7 | 67.8 | 67.8 | 69.2 |
| 2022 | 74.0 | 73.4 | 72.8 | 71.7 | 70.8 |
S&E = science and engineering.
Note(s):
Definite commitment refers to a doctorate recipient who is either returning to predoctoral employment or has signed a contract (or otherwise made a definite commitment) for employment or postdoctoral study in the coming year. Percentages are based on the number of doctorate recipients who responded to the postgraduation status item. The postgraduation status question was changed in 2017 to capture the postgraduation employment plans more accurately. As a result, some of the increase between 2016 and 2017 may be partly attributable to this change. The survey data collection for field of study changed in 2021, which may affect the data comparability across years. For more information, see the “Data source” section.
Source(s):
National Center for Science and Engineering Statistics, Survey of Earned Doctorates, 2022. Related detailed table 2-1.
Definite commitments among doctorate recipients, by non-S&E trend broad field: 2002–22
| Year | Education | Humanities and arts | Other non-S&E fields | Business |
|---|---|---|---|---|
| 2002 | 75.1 | 64.9 | 73.2 | 83.3 |
| 2003 | 75.7 | 64.2 | 72.3 | 83.3 |
| 2004 | 74.6 | 63.6 | 72.0 | 81.1 |
| 2005 | 73.9 | 64.5 | 70.2 | 81.9 |
| 2006 | 74.9 | 66.7 | 72.6 | 83.0 |
| 2007 | 71.6 | 62.8 | 68.2 | 77.9 |
| 2008 | 73.7 | 64.6 | 72.5 | 81.7 |
| 2009 | 71.6 | 63.2 | 72.6 | 80.3 |
| 2010 | 70.7 | 60.1 | 68.4 | 79.4 |
| 2011 | 68.1 | 57.3 | 65.6 | 77.6 |
| 2012 | 69.3 | 58.5 | 65.3 | 81.7 |
| 2013 | 65.8 | 55.0 | 65.7 | 76.3 |
| 2014 | 64.5 | 54.6 | 61.5 | 75.7 |
| 2015 | 64.5 | 54.8 | 63.7 | 77.7 |
| 2016 | 64.8 | 52.1 | 62.0 | 75.8 |
| 2017 | 69.5 | 57.2 | 67.7 | 80.8 |
| 2018 | 71.0 | 59.1 | 70.6 | 82.6 |
| 2019 | 72.7 | 58.5 | 70.0 | 82.0 |
| 2020 | 72.6 | 59.5 | 71.4 | 83.3 |
| 2021 | 71.1 | 59.0 | 64.9 | 78.8 |
| 2022 | 75.2 | 62.4 | 70.8 | 81.1 |
S&E = science and engineering.
Note(s):
Definite commitment refers to a doctorate recipient who is either returning to predoctoral employment or has signed a contract (or otherwise made a definite commitment) for employment or postdoctoral study in the coming year. Percentages are based on the number of doctorate recipients who responded to the postgraduation status item. The postgraduation status question was changed in 2017 to capture the postgraduation employment plans more accurately. As a result, some of the increase between 2016 and 2017 may be partly attributable to this change. The survey data collection for field of study changed in 2021, which may affect the data comparability across years. For more information, see the “Data source” section.
Source(s):
National Center for Science and Engineering Statistics, Survey of Earned Doctorates, 2022. Related detailed table 2-1
First postgraduate employment
Academic employment
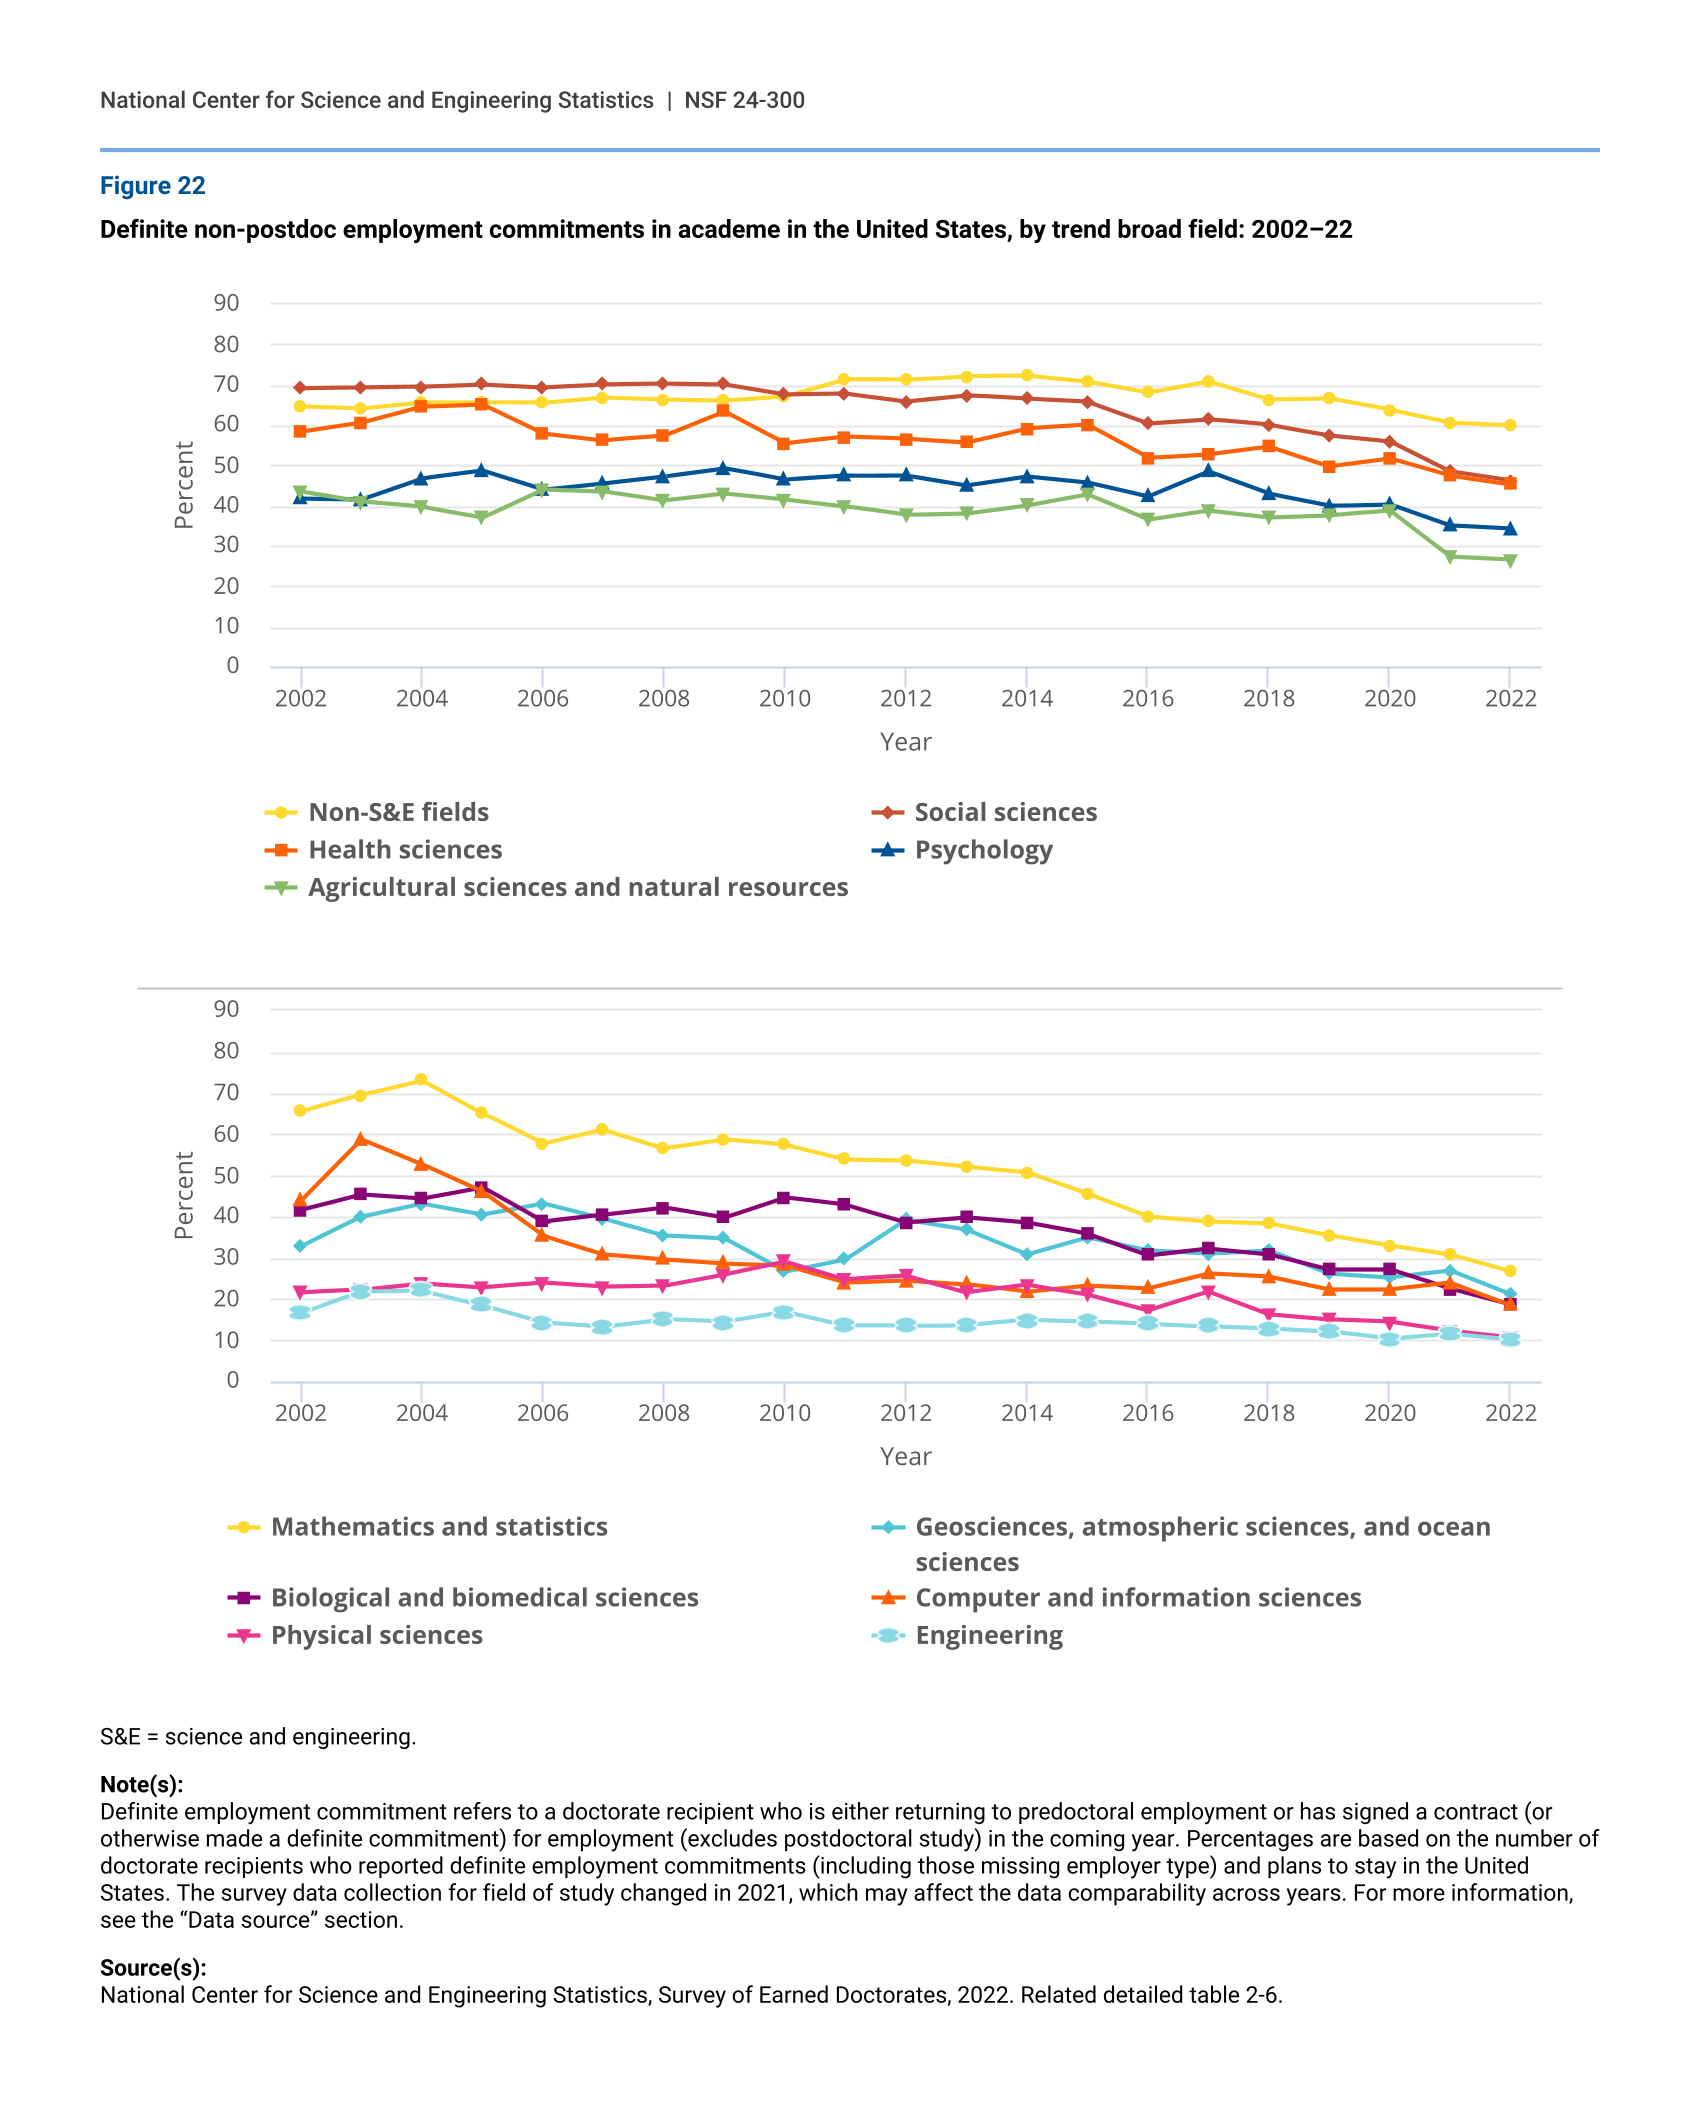
Doctorate recipients have shifted away from academic employment over time. In 2022, 33% of doctorate recipients with definite non-postdoc employment commitments in the United States reported that their principal job would be in academe, down from 52% in 2002. The highest rates of non-postdoc academic employment commitments in 2022 were reported by doctorate recipients in non-S&E fields (60%) and the lowest rates were in engineering (10%) and in physical sciences (11%) (figure 22).
In the past 20 years, the proportion of non-postdoc academic employment commitments in the United States declined in all S&E fields. The largest decline was in mathematics and statistics, from 66% in 2002 to 27% in 2022. Between 2021 and 2022, the proportion of doctorate recipients with non-postdoc academic employment commitments dropped in all S&E fields, particularly in geosciences, atmospheric, and ocean sciences (6 percentage points) and computer and information sciences (5 percentage points); the smallest declines were in agricultural sciences and natural resources and in psychology (less than 1 percentage point each).
Definite non-postdoc employment commitments in academe in the United States, by trend broad field: 2002–22
| Year | Non-S&E fields | Social sciences | Health sciences | Psychology | Agricultural sciences and natural resources |
|---|---|---|---|---|---|
| 2002 | 64.7 | 69.2 | 58.3 | 41.8 | 43.5 |
| 2003 | 64.1 | 69.3 | 60.6 | 41.6 | 41.0 |
| 2004 | 65.6 | 69.5 | 64.6 | 46.8 | 39.7 |
| 2005 | 65.6 | 70.1 | 65.2 | 48.7 | 37.1 |
| 2006 | 65.5 | 69.4 | 58.0 | 44.0 | 44.1 |
| 2007 | 66.9 | 70.1 | 56.3 | 45.6 | 43.6 |
| 2008 | 66.4 | 70.3 | 57.4 | 47.3 | 41.3 |
| 2009 | 66.2 | 70.1 | 63.5 | 49.3 | 43.0 |
| 2010 | 67.2 | 67.6 | 55.5 | 46.4 | 41.5 |
| 2011 | 71.4 | 67.8 | 57.1 | 47.4 | 39.8 |
| 2012 | 71.2 | 65.9 | 56.6 | 47.5 | 37.7 |
| 2013 | 72.1 | 67.4 | 55.7 | 45.0 | 38.1 |
| 2014 | 72.2 | 66.5 | 59.2 | 47.2 | 40.1 |
| 2015 | 70.8 | 65.8 | 60.1 | 45.7 | 42.8 |
| 2016 | 68.1 | 60.5 | 51.9 | 42.2 | 36.5 |
| 2017 | 70.9 | 61.5 | 52.8 | 48.4 | 38.8 |
| 2018 | 66.4 | 60.1 | 54.7 | 42.9 | 37.1 |
| 2019 | 66.6 | 57.5 | 49.8 | 40.0 | 37.6 |
| 2020 | 63.8 | 56.0 | 51.7 | 40.4 | 38.7 |
| 2021 | 60.7 | 48.5 | 47.4 | 35.1 | 27.3 |
| 2022 | 60.0 | 46.2 | 45.3 | 34.3 | 26.6 |
| Year | Mathematics and statistics | Geosciences, atmospheric sciences, and ocean sciences | Biological and biomedical sciences | Computer and information sciences | Physical sciences | Engineering |
|---|---|---|---|---|---|---|
| 2002 | 65.5 | 32.8 | 41.6 | 44.0 | 21.6 | 16.5 |
| 2003 | 69.5 | 39.9 | 45.4 | 58.8 | 22.2 | 21.7 |
| 2004 | 73.1 | 43.1 | 44.4 | 52.7 | 23.8 | 22.0 |
| 2005 | 65.1 | 40.5 | 47.1 | 46.0 | 22.8 | 18.5 |
| 2006 | 57.6 | 43.2 | 38.7 | 35.4 | 23.9 | 14.3 |
| 2007 | 61.0 | 39.5 | 40.4 | 30.9 | 22.9 | 13.3 |
| 2008 | 56.6 | 35.5 | 42.2 | 29.6 | 23.2 | 15.1 |
| 2009 | 58.7 | 34.7 | 39.7 | 28.6 | 26.0 | 14.4 |
| 2010 | 57.4 | 26.6 | 44.6 | 28.2 | 29.1 | 16.9 |
| 2011 | 53.9 | 29.6 | 42.8 | 24.0 | 24.8 | 13.6 |
| 2012 | 53.7 | 39.2 | 38.6 | 24.5 | 25.6 | 13.5 |
| 2013 | 52.2 | 36.9 | 39.8 | 23.6 | 21.6 | 13.6 |
| 2014 | 50.8 | 30.9 | 38.5 | 21.7 | 23.4 | 14.9 |
| 2015 | 45.6 | 35.0 | 35.8 | 23.3 | 21.1 | 14.5 |
| 2016 | 40.1 | 31.8 | 30.6 | 22.6 | 17.3 | 14.0 |
| 2017 | 38.9 | 31.0 | 32.3 | 26.2 | 21.8 | 13.4 |
| 2018 | 38.4 | 31.8 | 30.9 | 25.4 | 16.3 | 12.8 |
| 2019 | 35.4 | 26.2 | 27.2 | 22.3 | 15.0 | 12.1 |
| 2020 | 32.9 | 25.3 | 27.2 | 22.3 | 14.4 | 10.3 |
| 2021 | 30.7 | 26.9 | 22.5 | 23.9 | 12.3 | 11.6 |
| 2022 | 26.6 | 21.1 | 18.7 | 18.5 | 10.7 | 10.2 |
S&E = science and engineering.
Note(s):
Definite employment commitment refers to a doctorate recipient who is either returning to predoctoral employment or has signed a contract (or otherwise made a definite commitment) for employment (excludes postdoctoral study) in the coming year. Percentages are based on the number of doctorate recipients who reported definite employment commitments (including those missing employer type) and plans to stay in the United States. The survey data collection for field of study changed in 2021, which may affect the data comparability across years. For more information, see the “Data source” section.
Source(s):
National Center for Science and Engineering Statistics, Survey of Earned Doctorates, 2022. Related detailed table 2-6.
Industry or business employment
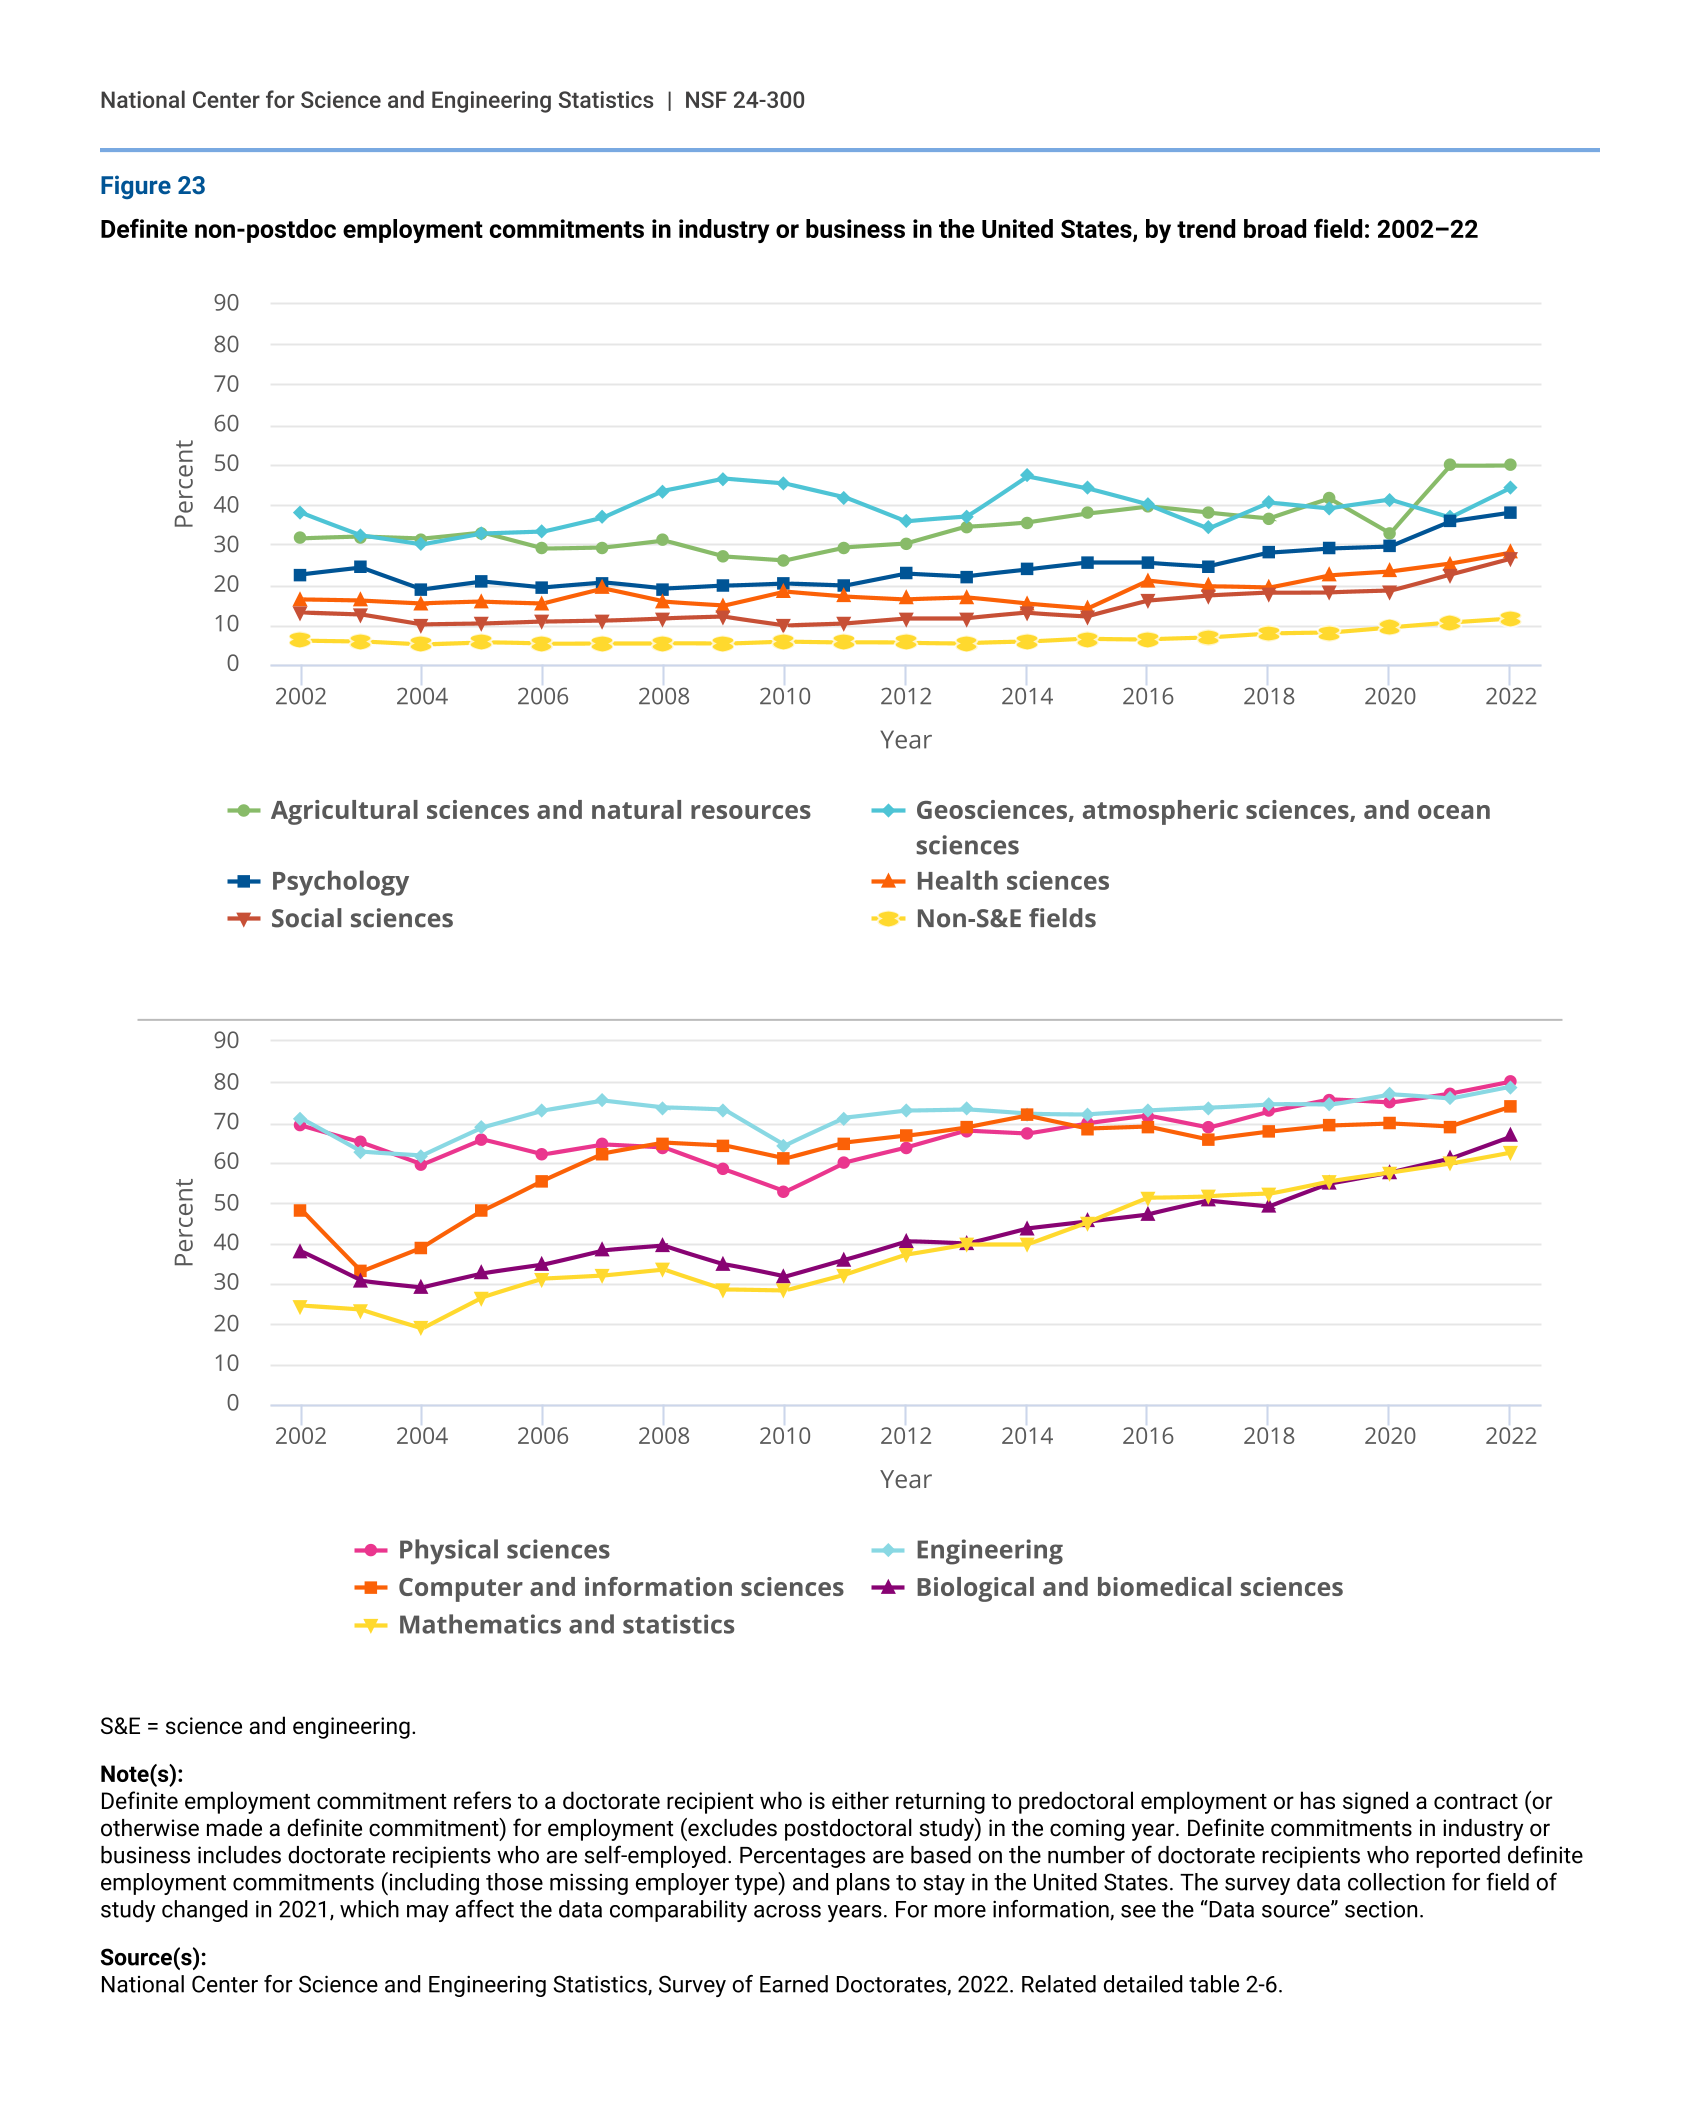
In contrast to the decline in definite non-postdoc employment commitments in academia, the proportion of doctorate recipients with job commitments in industry or business in the United States doubled since 2002, comprising close to half of all employment commitments of doctorate recipients in 2022. Definite commitments in industry and business have become more popular across all fields. In 2002, only physical sciences (69%) and engineering (71%) had more than half of their doctorate recipients commit to industry or business positions at graduation (figure 23). By 2022, several more fields had 50% or more of their doctorate recipients commit to industry or business positions: computer and information sciences; biological and biomedical sciences; mathematics and statistics; and agricultural sciences and natural resources. In comparison, only about a quarter (27%) of doctorate recipients in social sciences had definite commitments in industry or business—the lowest among S&E fields. Between 2021 and 2022, the largest increases were in geosciences, atmospheric, and ocean sciences (7 percentage points); biological and biomedical sciences (6 percentage points); and computer and information sciences (5 percentage points).
Definite non-postdoc employment commitments in industry or business in the United States, by trend broad field: 2002–22
| Year | Agricultural sciences and natural resources | Geosciences, atmospheric sciences, and ocean sciences | Psychology | Health sciences | Social sciences | Non-S&E fields |
|---|---|---|---|---|---|---|
| 2002 | 31.5 | 37.9 | 22.5 | 16.3 | 13.0 | 6.1 |
| 2003 | 31.9 | 32.3 | 24.2 | 16.0 | 12.5 | 5.9 |
| 2004 | 31.4 | 30.0 | 18.8 | 15.3 | 10.0 | 5.1 |
| 2005 | 33.0 | 32.7 | 20.8 | 15.7 | 10.2 | 5.6 |
| 2006 | 29.0 | 33.2 | 19.3 | 15.3 | 10.7 | 5.2 |
| 2007 | 29.3 | 36.8 | 20.5 | 19.0 | 11.0 | 5.3 |
| 2008 | 31.1 | 43.4 | 18.9 | 15.7 | 11.6 | 5.3 |
| 2009 | 27.1 | 46.5 | 19.7 | 14.8 | 12.0 | 5.2 |
| 2010 | 26.1 | 45.3 | 20.3 | 18.3 | 9.9 | 5.8 |
| 2011 | 29.3 | 41.8 | 19.8 | 17.1 | 10.4 | 5.6 |
| 2012 | 30.2 | 35.8 | 22.8 | 16.4 | 11.6 | 5.5 |
| 2013 | 34.4 | 36.9 | 22.1 | 16.8 | 11.6 | 5.4 |
| 2014 | 35.6 | 47.1 | 23.7 | 15.2 | 12.9 | 5.7 |
| 2015 | 37.8 | 44.0 | 25.4 | 14.0 | 12.1 | 6.5 |
| 2016 | 39.6 | 39.9 | 25.4 | 21.0 | 15.9 | 6.4 |
| 2017 | 38.0 | 34.1 | 24.6 | 19.6 | 17.2 | 6.8 |
| 2018 | 36.6 | 40.6 | 27.9 | 19.2 | 17.9 | 7.8 |
| 2019 | 41.5 | 39.1 | 29.0 | 22.3 | 18.0 | 8.0 |
| 2020 | 32.8 | 41.2 | 29.5 | 23.2 | 18.4 | 9.3 |
| 2021 | 49.7 | 36.8 | 35.7 | 25.2 | 22.6 | 10.5 |
| 2022 | 49.8 | 44.2 | 37.9 | 28.0 | 26.6 | 11.5 |
| Year | Physical sciences | Engineering | Computer and information sciences | Biological and biomedical sciences | Mathematics and statistics |
|---|---|---|---|---|---|
| 2002 | 69.2 | 71.0 | 48.3 | 38.0 | 24.4 |
| 2003 | 65.0 | 62.7 | 33.0 | 30.6 | 23.4 |
| 2004 | 59.5 | 61.8 | 38.9 | 29.1 | 18.9 |
| 2005 | 65.8 | 68.7 | 48.0 | 32.5 | 26.6 |
| 2006 | 62.0 | 72.9 | 55.6 | 34.6 | 31.1 |
| 2007 | 64.5 | 75.4 | 62.3 | 38.2 | 31.9 |
| 2008 | 63.7 | 73.7 | 64.9 | 39.3 | 33.4 |
| 2009 | 58.2 | 73.1 | 64.2 | 34.8 | 28.5 |
| 2010 | 52.7 | 64.3 | 60.9 | 31.6 | 28.2 |
| 2011 | 60.1 | 71.1 | 64.9 | 35.9 | 32.2 |
| 2012 | 63.7 | 72.9 | 66.6 | 40.5 | 37.1 |
| 2013 | 67.9 | 73.2 | 68.8 | 39.8 | 39.7 |
| 2014 | 67.2 | 72.1 | 71.7 | 43.7 | 39.7 |
| 2015 | 69.8 | 72.0 | 68.5 | 45.4 | 45.2 |
| 2016 | 71.6 | 72.9 | 69.0 | 47.2 | 51.3 |
| 2017 | 68.6 | 73.6 | 65.8 | 50.5 | 51.7 |
| 2018 | 72.7 | 74.5 | 67.7 | 49.1 | 52.2 |
| 2019 | 75.7 | 74.3 | 69.3 | 54.7 | 55.4 |
| 2020 | 74.8 | 77.0 | 69.8 | 57.5 | 57.5 |
| 2021 | 77.2 | 75.8 | 69.0 | 61.0 | 59.8 |
| 2022 | 80.2 | 78.8 | 73.8 | 66.5 | 62.6 |
S&E = science and engineering.
Note(s):
Definite employment commitment refers to a doctorate recipient who is either returning to predoctoral employment or has signed a contract (or otherwise made a definite commitment) for employment (excludes postdoctoral study) in the coming year. Definite commitments in industry or business includes doctorate recipients who are self-employed. Percentages are based on the number of doctorate recipients who reported definite employment commitments (including those missing employer type) and plans to stay in the United States. The survey data collection for field of study changed in 2021, which may affect the data comparability across years. For more information, see the “Data source” section.
Source(s):
National Center for Science and Engineering Statistics, Survey of Earned Doctorates, 2022. Related detailed table 2-6.
Postdoc positions
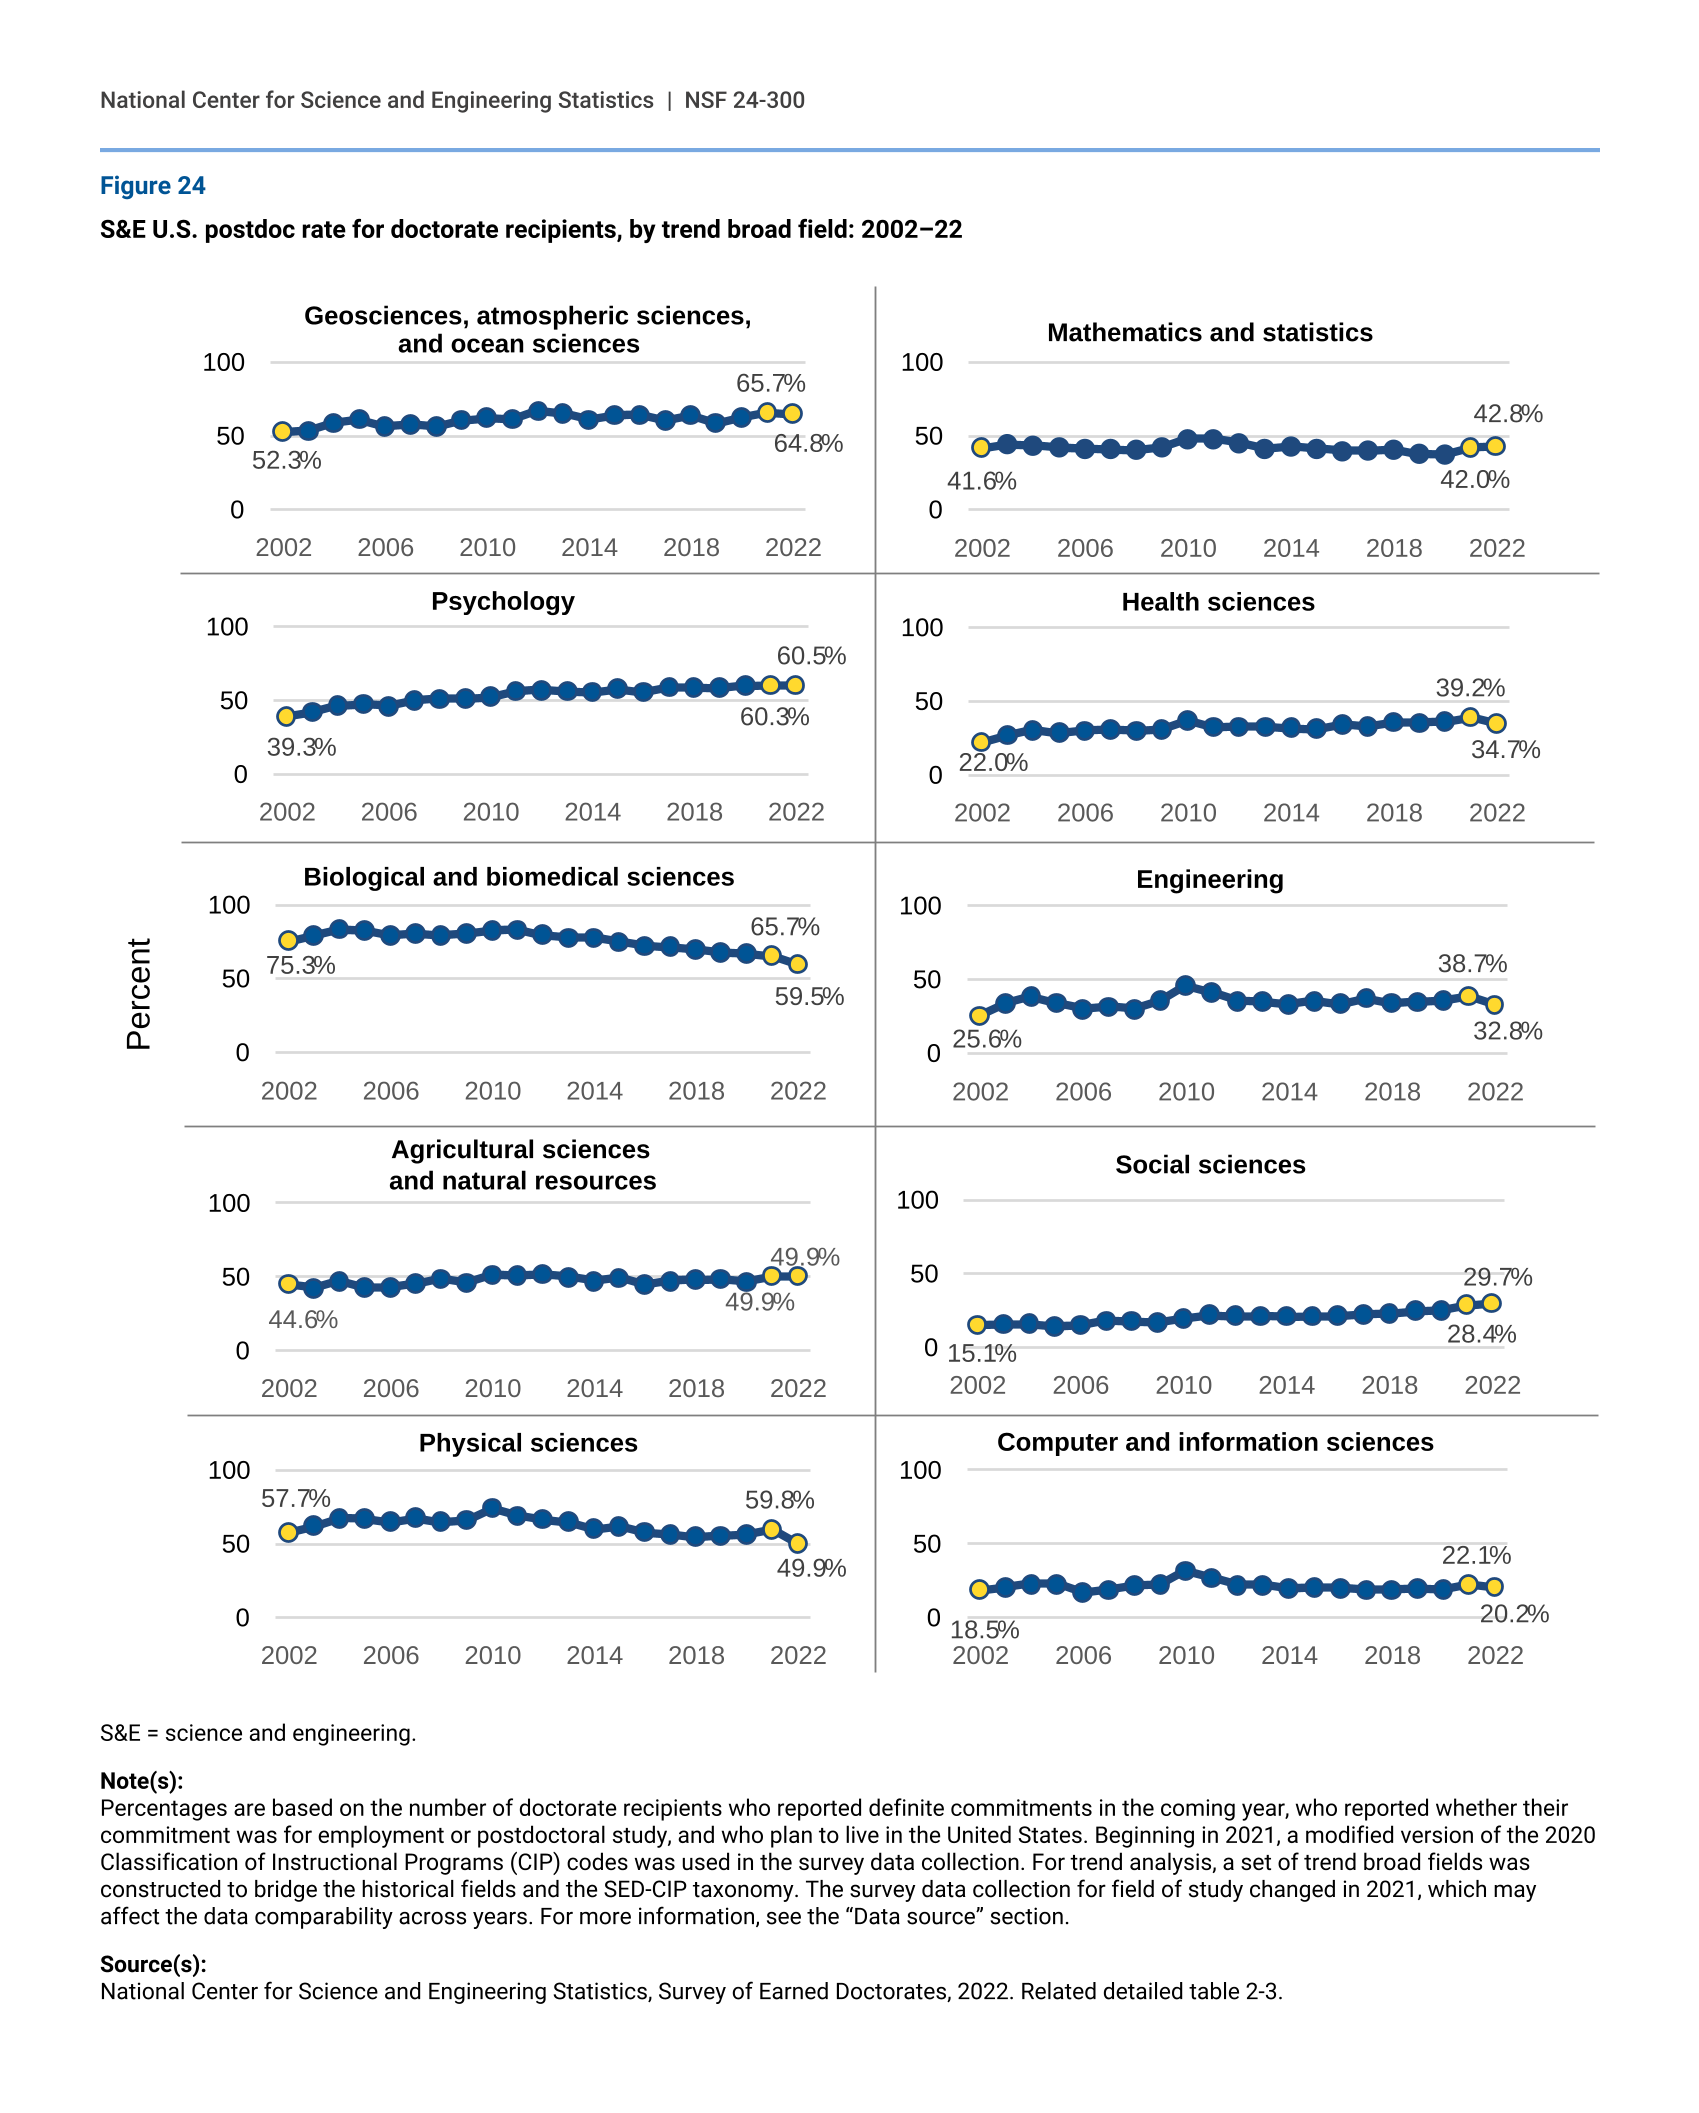
Historically, postdoc positions have been a customary part of the early career paths of doctorate recipients in biological and biomedical sciences; physical sciences; and geosciences, atmospheric, and ocean sciences, comprising over half of definite commitments. By 2022, the postdoc rates in psychology and in agricultural sciences and natural resources had also reached or exceeded 50% (figure 24). In the past 20 years, the largest increases in postdoc rates were in psychology (21 percentage point), social sciences (15 percentage points), and health sciences (13 percentage points), though the proportions of doctorate recipients with postdoc positions in the latter two fields were no more than 35% in 2022. The only fields to experience a decline over the past 20 years were biological and biomedical sciences and physical sciences.
Between 2021 and 2022, the postdoc rate decreased in most S&E fields. The largest declines were in physical sciences, biological and biomedical sciences, engineering, and health sciences. Only psychology, mathematics and statistics, and social sciences saw gains, ranging from 0.2 to 1.3 percentage points.
S&E U.S. postdoc rate for doctorate recipients, by trend broad field: 2002–22
S&E = science and engineering.
Note(s):
Percentages are based on the number of doctorate recipients who reported definite commitments in the coming year, who reported whether their commitment was for employment or postdoctoral study, and who plan to live in the United States. Beginning in 2021, a modified version of the 2020 Classification of Instructional Programs (CIP) codes was used in the survey data collection. For trend analysis, a set of trend broad fields was constructed to bridge the historical fields and the SED-CIP taxonomy. The survey data collection for field of study changed in 2021, which may affect the data comparability across years. For more information, see the “Data source” section.
Source(s):
National Center for Science and Engineering Statistics, Survey of Earned Doctorates, 2022. Related detailed table 2-3.
Median salaries
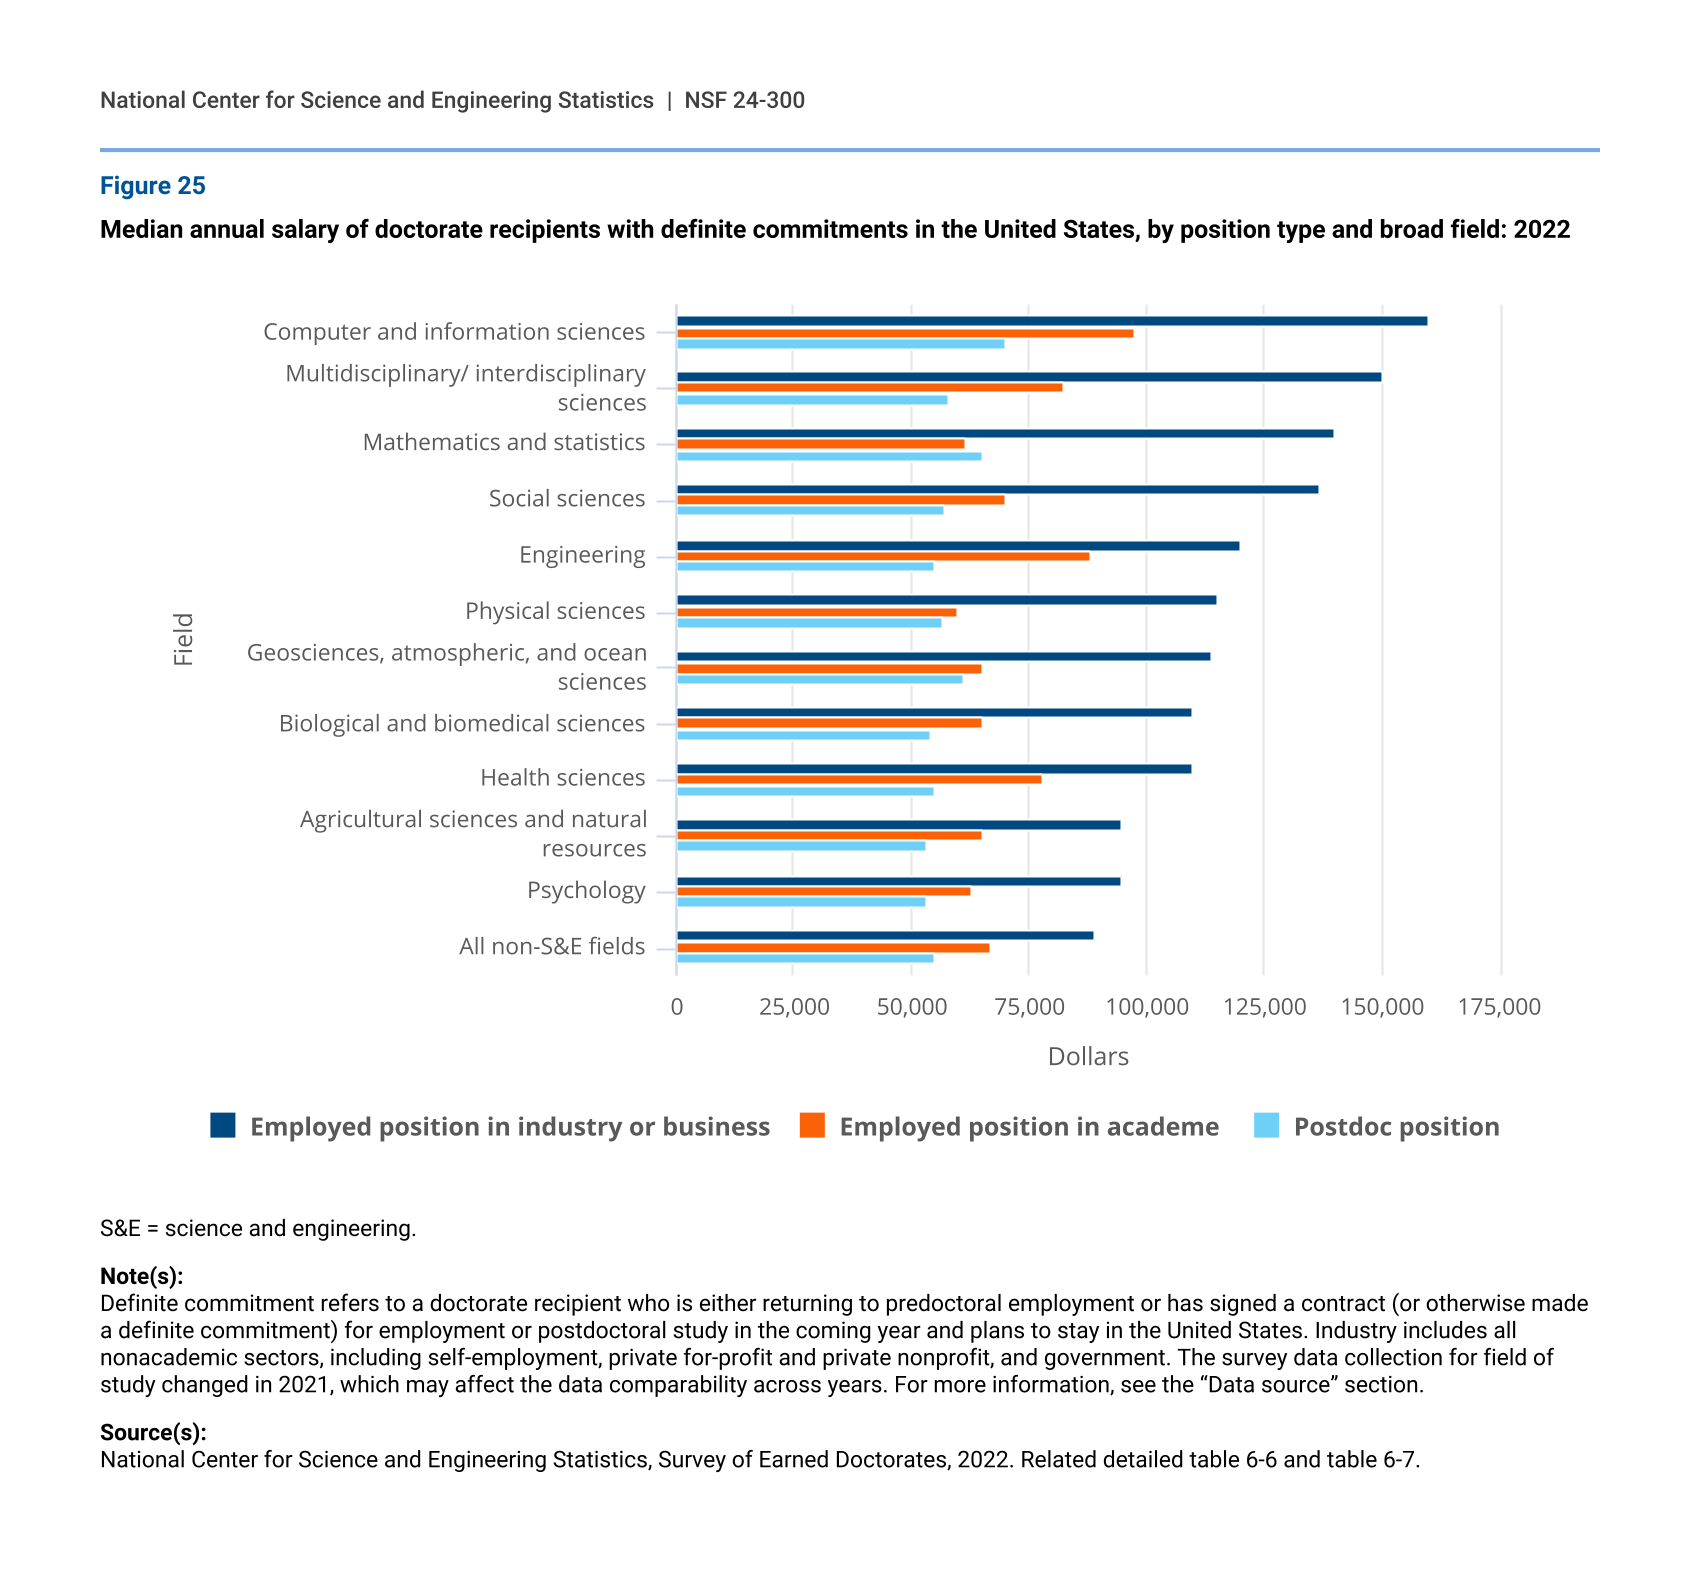
In 2022, doctorate recipients who had definite commitments for employment or a postdoc in the United States at graduation reported expected annual salaries that varied by their doctorate field and the type of position to which they committed. In every field, expected median salaries for doctorate recipients committing to non-postdoc jobs in industry were higher than those committing to postdocs and non-postdoc employment in the academic sector (figure 25). The expected median salaries for postdocs in most broad fields were relatively similar, ranging from $50,000 to $58,000. Postdocs in geosciences, atmospheric and ocean sciences; mathematics and statistics; and computer and information sciences were the exception, with median salaries between $61,000 and $70,000. Doctorate recipients in computer and information sciences reported the highest expected median salaries in academe ($97,500) and in industry ($160,000).
Median annual salary of doctorate recipients with definite commitments in the United States, by position type and broad field: 2022
| Field | Employed position in industry or business | Employed position in academe | Postdoc position |
|---|---|---|---|
| Computer and information sciences | 160,000 | 97,500 | 70,000 |
| Multidisciplinary/ interdisciplinary sciences | 150,000 | 82,250 | 58,000 |
| Mathematics and statistics | 140,000 | 61,750 | 65,000 |
| Social sciences | 137,000 | 70,000 | 57,300 |
| Engineering | 120,000 | 88,000 | 55,000 |
| Physical sciences | 115,000 | 60,000 | 56,550 |
| Geosciences, atmospheric, and ocean sciences | 113,750 | 65,000 | 61,000 |
| Biological and biomedical sciences | 110,000 | 65,000 | 54,000 |
| Health sciences | 110,000 | 78,000 | 55,000 |
| Agricultural sciences and natural resources | 95,000 | 65,000 | 53,000 |
| Psychology | 95,000 | 63,000 | 53,000 |
| All non-S&E fields | 89,000 | 66,925 | 55,000 |
S&E = science and engineering.
Note(s):
Definite commitment refers to a doctorate recipient who is either returning to predoctoral employment or has signed a contract (or otherwise made a definite commitment) for employment or postdoctoral study in the coming year and plans to stay in the United States. Industry includes all nonacademic sectors, including self-employment, private for-profit and private nonprofit, and government. The survey data collection for field of study changed in 2021, which may affect the data comparability across years. For more information, see the “Data source” section.
Temporary visa holders and postgraduation
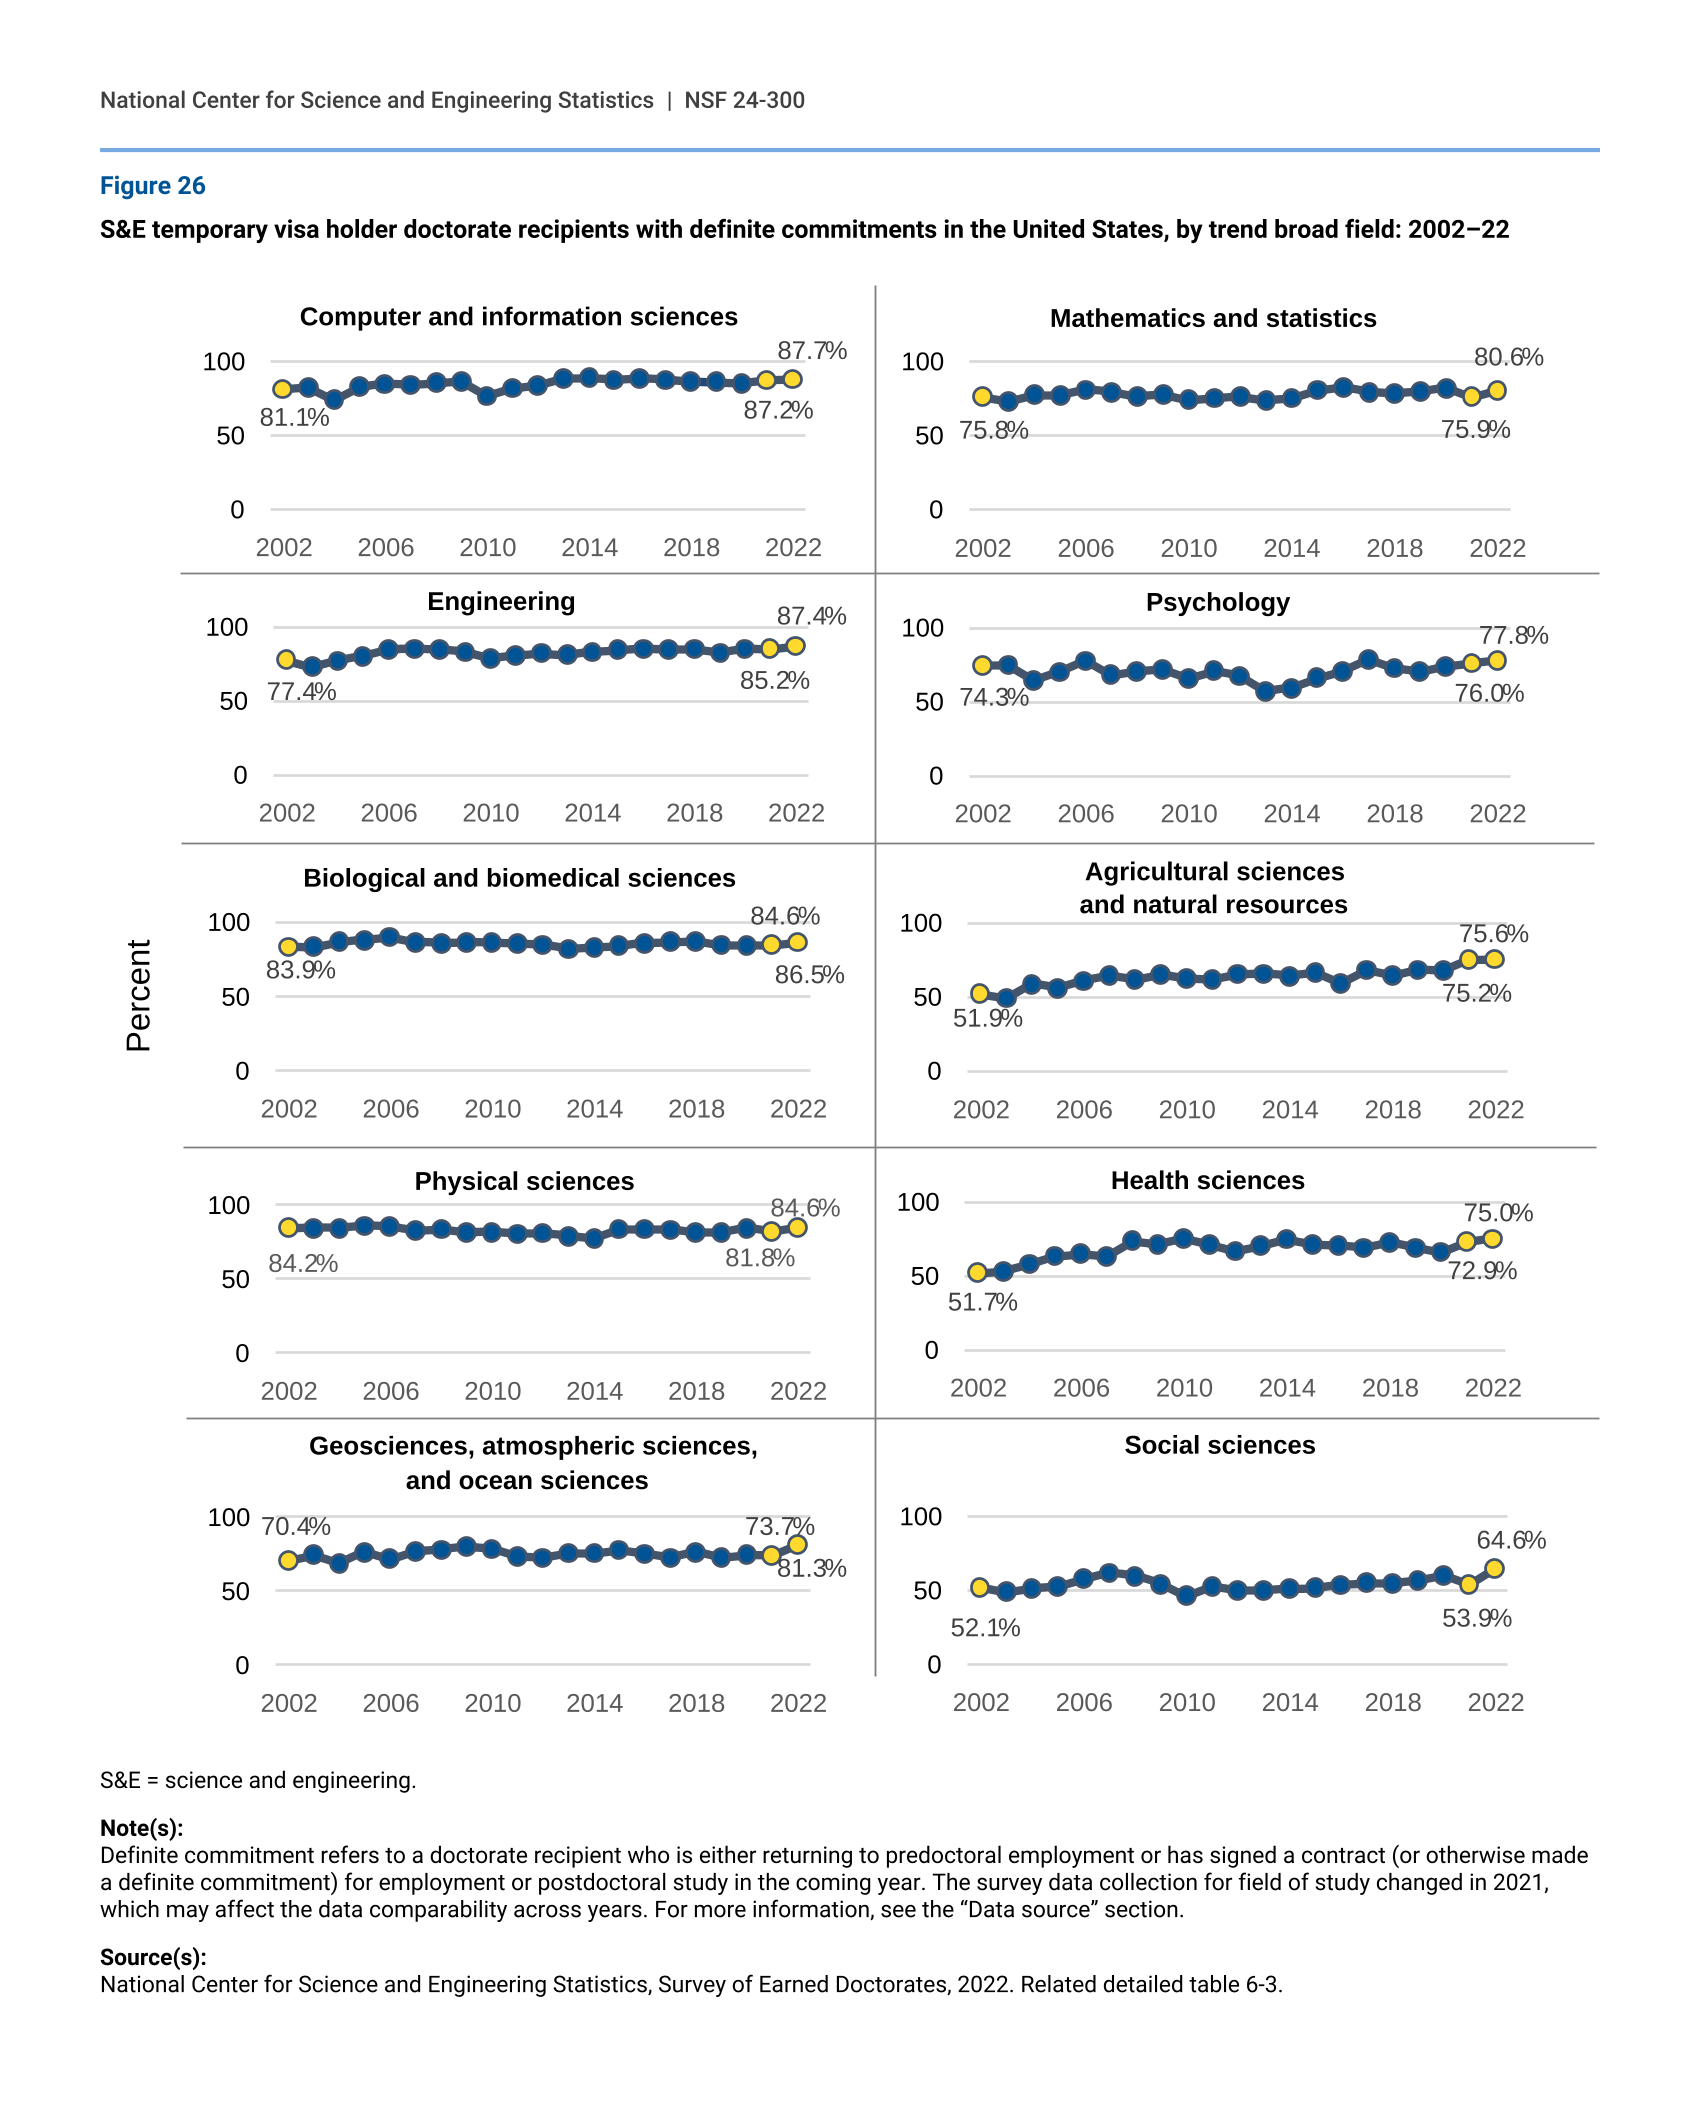
Among S&E doctorate recipients who are temporary visa holders, working in the United States after earning their doctoral degree has been a growing trend. In 2022, 83% of S&E temporary visa holder doctorate recipients with definite commitments reported that the location of their postdoc or employment position was in the United States, up from 74% in 2002. In the past 20 years, expected stay rates increased the most in agricultural sciences and natural resources and in health sciences; stay rates increased the least in physical sciences (figure 26).
In 2022, expected stay rates were highest (above 80%) in many S&E fields but lowest in social sciences (65%). Between 2021 and 2022, the proportion of temporary visa holder doctorate recipients with definite commitments in the United States grew in all fields. The largest increases were in social sciences (from 54% to 65%); geosciences, atmospheric, and ocean sciences (from 74% to 81%); and mathematics and statistics (from 76% to 81%).
S&E temporary visa holder doctorate recipients with definite commitments in the United States, by trend broad field: 2002–22
S&E = science and engineering.
Note(s):
Definite commitment refers to a doctorate recipient who is either returning to predoctoral employment or has signed a contract (or otherwise made a definite commitment) for employment or postdoctoral study in the coming year. The survey data collection for field of study changed in 2021, which may affect the data comparability across years. For more information, see the “Data source” section.
Source(s):
National Center for Science and Engineering Statistics, Survey of Earned Doctorates, 2022. Related detailed table 6-3.