 An official website of the United States government
Report
U.S. doctorate awards
Each new cohort of doctorate recipients augments the supply of prospective scientists, engineers, researchers, and scholars. Data on the composition of these cohorts reveal changes in the presence of different demographic groups.
Overall trends
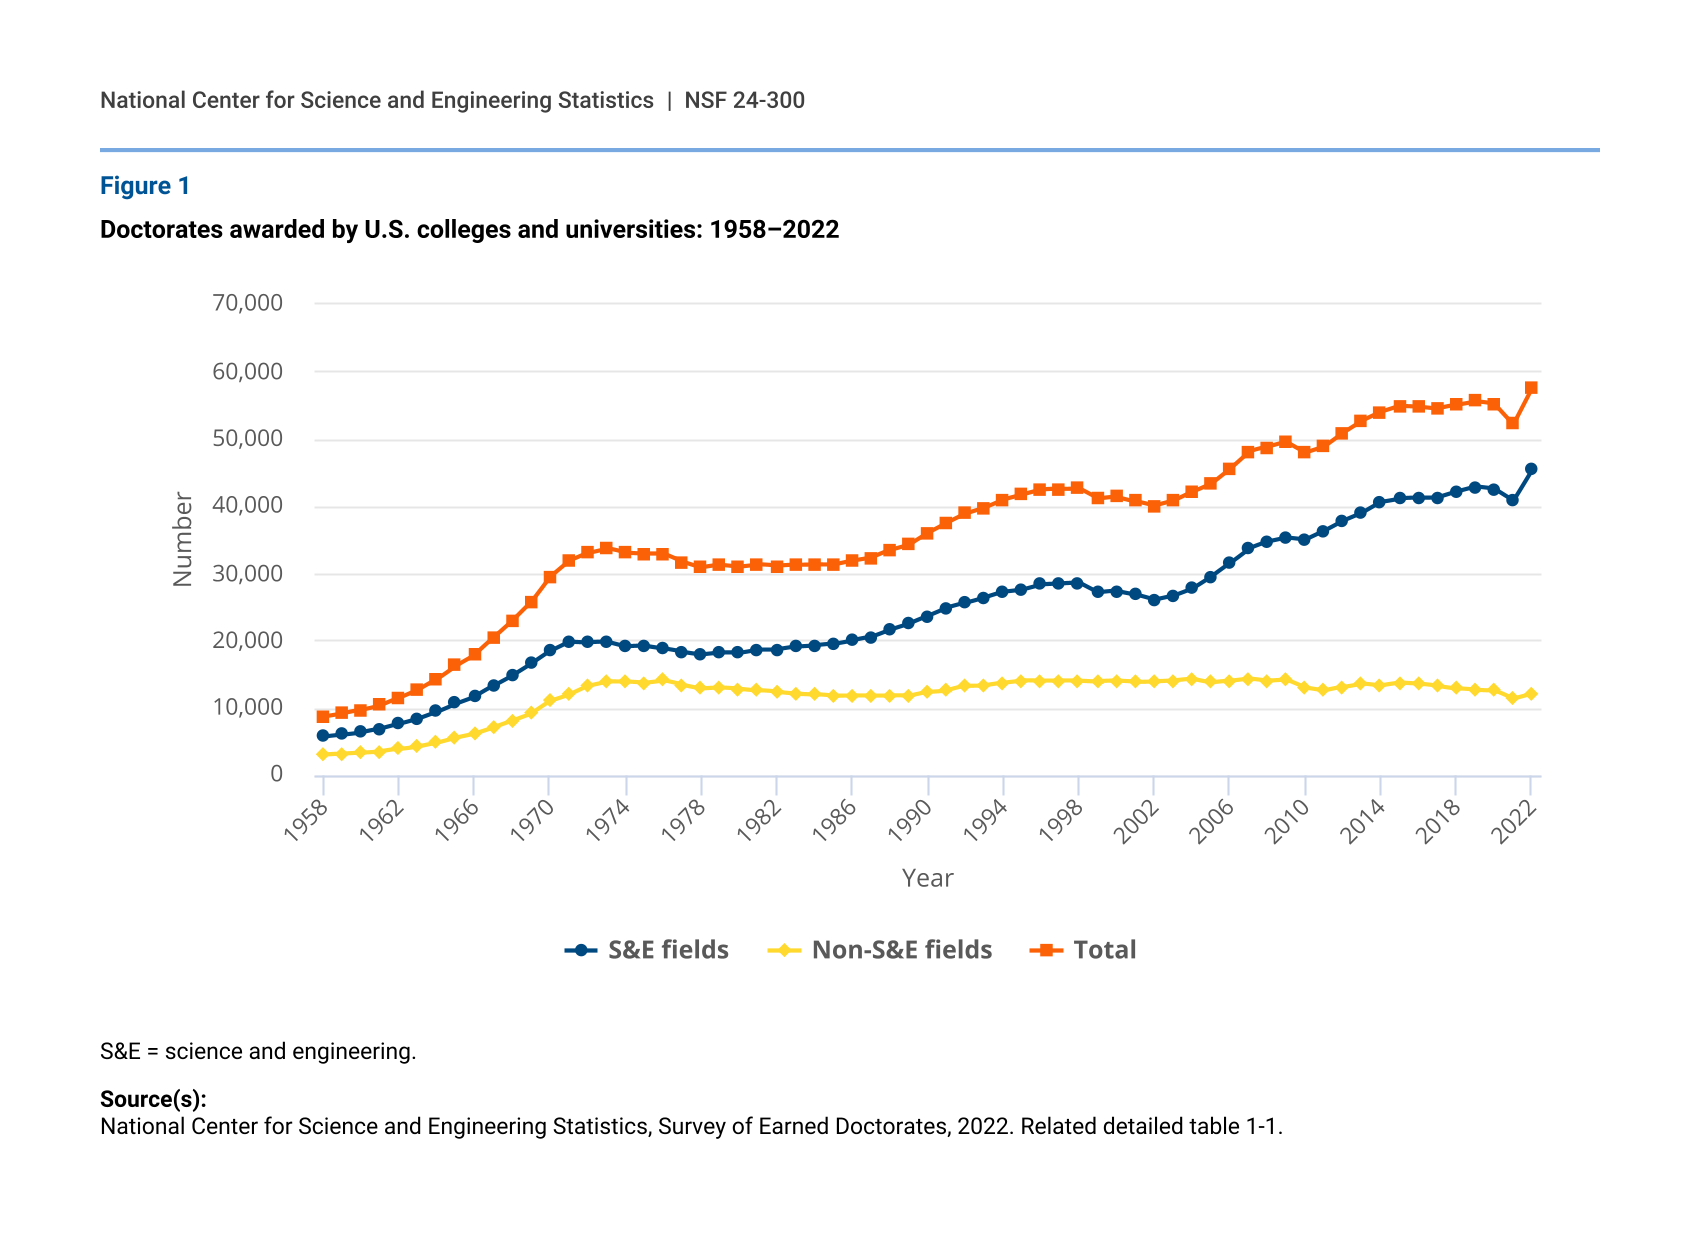
The number of research doctoral degrees awarded by U.S. institutions increased from 52,194 in 2021 to 57,596 in 2022, according to the Survey of Earned Doctorates (SED) (figure 1). Since the survey’s inception in 1957, there has been an upward trend in the number of doctorates awarded—with an average annual growth of 3.1% punctuated by periods of slow growth and some declines. However, the increase in 2022 was the steepest 1-year increase in the history of the SED (10.3%), surpassing the sharp decline seen in the previous year.
Since the SED began collecting data, the number of research doctorates awarded in science and engineering (S&E) fields has exceeded the number of non-S&E doctorates, and this gap has widened over time. From 2002 to 2022, the number of S&E doctorate recipients has increased by 74%, while the number of non-S&E doctorate recipients in 2022 was 13% lower than in 2002. As a result, the proportion of S&E doctorates to all doctorates climbed from 65% in 2002 to 79% in 2022.
Doctorates awarded by U.S. colleges and universities: 1958–2022
| Year | S&E fields | Non-S&E fields | Total |
|---|---|---|---|
| 1958 | 5,751 | 3,022 | 8,773 |
| 1959 | 6,043 | 3,170 | 9,213 |
| 1960 | 6,388 | 3,345 | 9,733 |
| 1961 | 6,872 | 3,541 | 10,413 |
| 1962 | 7,612 | 3,888 | 11,500 |
| 1963 | 8,422 | 4,306 | 12,728 |
| 1964 | 9,462 | 4,863 | 14,325 |
| 1965 | 10,706 | 5,634 | 16,340 |
| 1966 | 11,732 | 6,217 | 17,949 |
| 1967 | 13,274 | 7,129 | 20,403 |
| 1968 | 14,824 | 8,113 | 22,937 |
| 1969 | 16,574 | 9,169 | 25,743 |
| 1970 | 18,458 | 11,040 | 29,498 |
| 1971 | 19,869 | 11,998 | 31,867 |
| 1972 | 19,752 | 13,289 | 33,041 |
| 1973 | 19,808 | 13,947 | 33,755 |
| 1974 | 19,137 | 13,910 | 33,047 |
| 1975 | 19,210 | 13,742 | 32,952 |
| 1976 | 18,821 | 14,125 | 32,946 |
| 1977 | 18,298 | 13,418 | 31,716 |
| 1978 | 17,952 | 12,923 | 30,875 |
| 1979 | 18,213 | 13,025 | 31,238 |
| 1980 | 18,169 | 12,850 | 31,019 |
| 1981 | 18,713 | 12,642 | 31,355 |
| 1982 | 18,736 | 12,372 | 31,108 |
| 1983 | 19,117 | 12,163 | 31,280 |
| 1984 | 19,285 | 12,049 | 31,334 |
| 1985 | 19,504 | 11,791 | 31,295 |
| 1986 | 20,064 | 11,833 | 31,897 |
| 1987 | 20,558 | 11,807 | 32,365 |
| 1988 | 21,675 | 11,822 | 33,497 |
| 1989 | 22,565 | 11,760 | 34,325 |
| 1990 | 23,689 | 12,376 | 36,065 |
| 1991 | 24,894 | 12,636 | 37,530 |
| 1992 | 25,616 | 13,270 | 38,886 |
| 1993 | 26,449 | 13,351 | 39,800 |
| 1994 | 27,304 | 13,730 | 41,034 |
| 1995 | 27,663 | 14,084 | 41,747 |
| 1996 | 28,405 | 14,032 | 42,437 |
| 1997 | 28,486 | 14,053 | 42,539 |
| 1998 | 28,592 | 14,044 | 42,636 |
| 1999 | 27,148 | 13,953 | 41,101 |
| 2000 | 27,378 | 13,991 | 41,369 |
| 2001 | 26,896 | 13,848 | 40,744 |
| 2002 | 26,088 | 13,943 | 40,031 |
| 2003 | 26,713 | 14,049 | 40,762 |
| 2004 | 27,794 | 14,328 | 42,122 |
| 2005 | 29,578 | 13,807 | 43,385 |
| 2006 | 31,584 | 14,036 | 45,620 |
| 2007 | 33,758 | 14,374 | 48,132 |
| 2008 | 34,717 | 14,059 | 48,776 |
| 2009 | 35,313 | 14,239 | 49,552 |
| 2010 | 34,997 | 13,031 | 48,028 |
| 2011 | 36,331 | 12,578 | 48,909 |
| 2012 | 37,846 | 13,097 | 50,943 |
| 2013 | 39,031 | 13,672 | 52,703 |
| 2014 | 40,630 | 13,356 | 53,986 |
| 2015 | 41,175 | 13,711 | 54,886 |
| 2016 | 41,240 | 13,569 | 54,809 |
| 2017 | 41,288 | 13,264 | 54,552 |
| 2018 | 42,144 | 12,934 | 55,078 |
| 2019 | 42,898 | 12,711 | 55,609 |
| 2020 | 42,565 | 12,643 | 55,208 |
| 2021 | 40,834 | 11,360 | 52,194 |
| 2022 | 45,479 | 12,117 | 57,596 |
S&E = science and engineering.
Source(s):
National Center for Science and Engineering Statistics, Survey of Earned Doctorates, 2022. Related detailed table 1-1.
Citizenship
Trends in citizenship
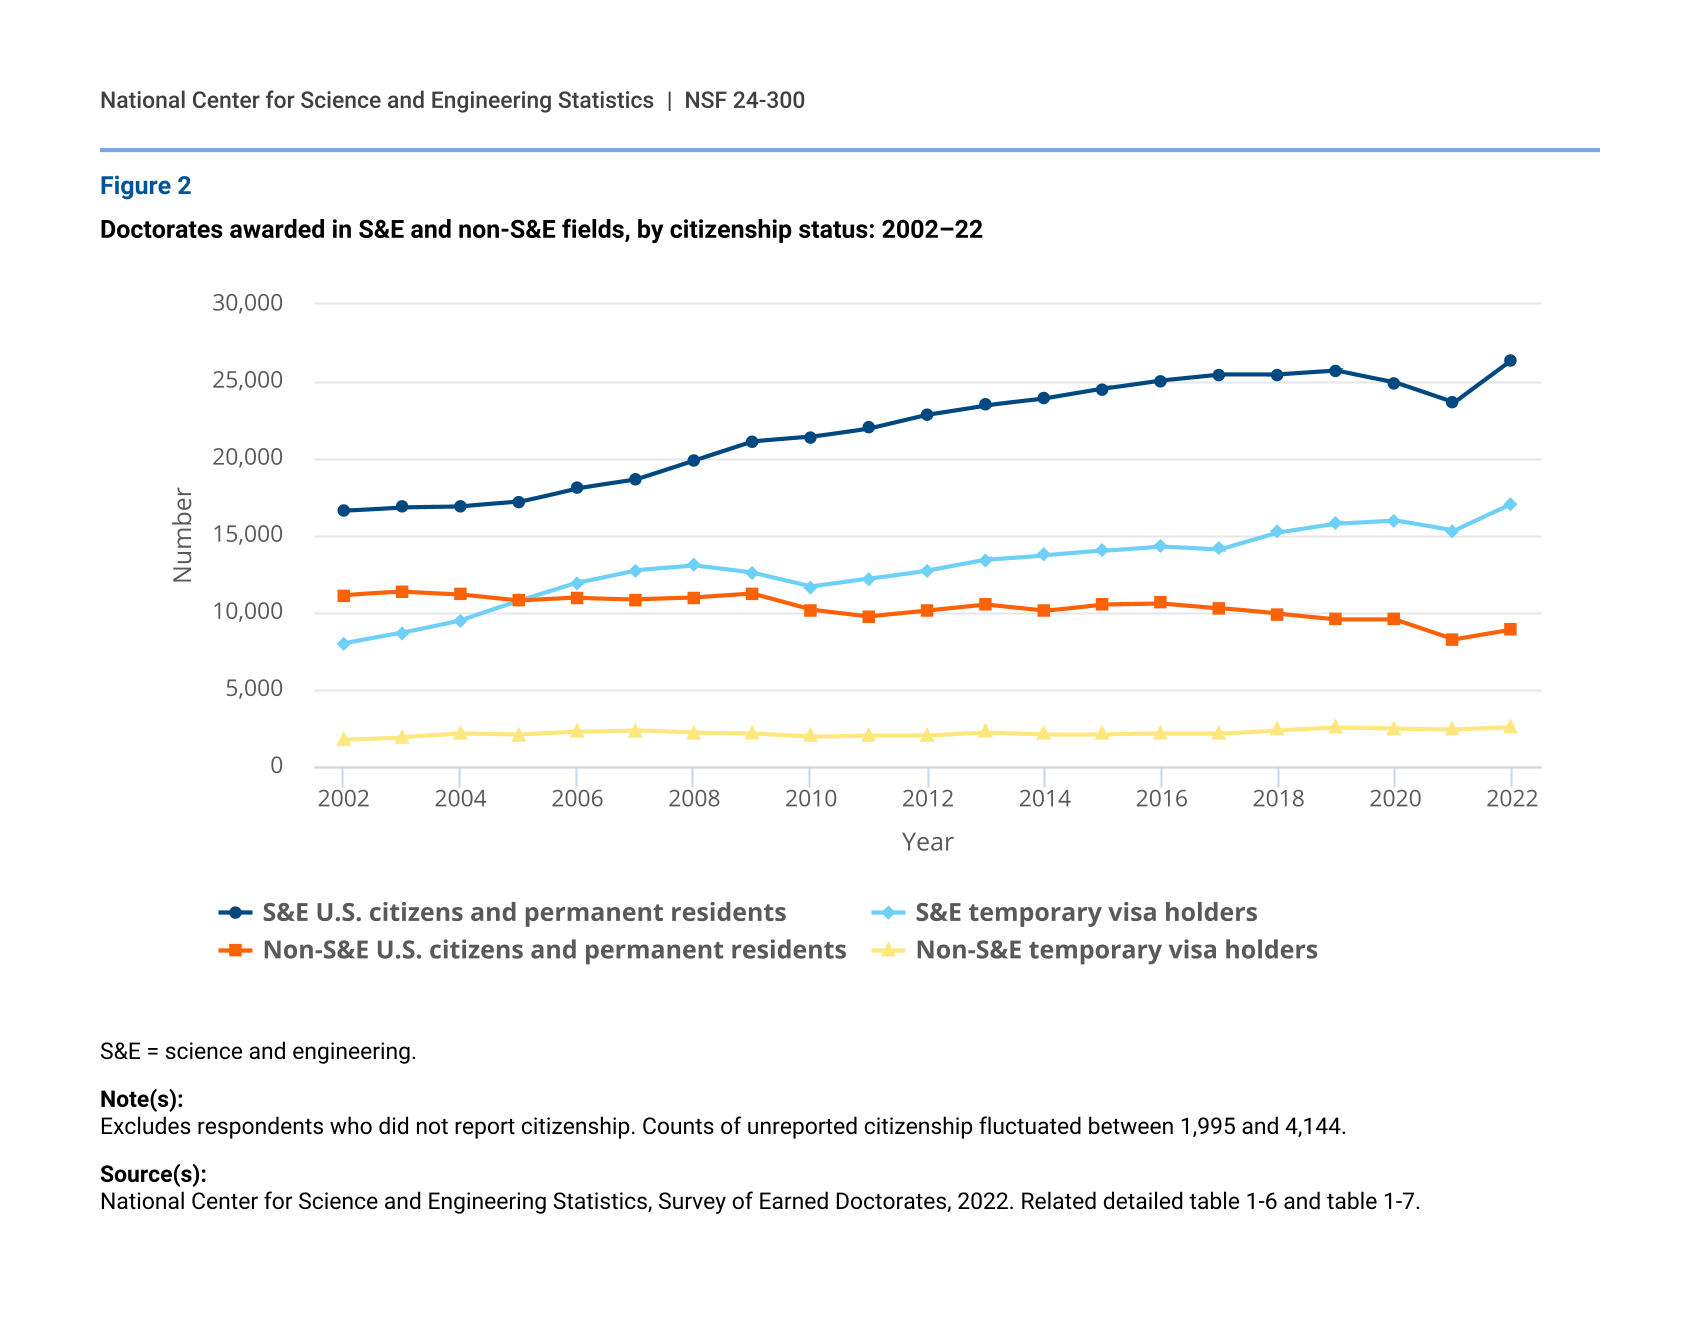
In 2022, the number of doctorates in S&E fields awarded to temporary visa holders was 17,091, an increase of 1,756 from 2021 (figure 2). Overall, S&E doctorates awarded to temporary visa holders increased 114% since 2002 and 34% since 2012. Over the past 20 years, the proportion of S&E doctorates awarded to temporary visa holders peaked at 41% in 2007, held steady at about 36% between 2011 and 2017, and gradually increased to 39% in 2022.
Although starting from a larger base, the number of S&E doctorates awarded to U.S. citizens and permanent residents experienced a slower relative increase over the past 20 years (59% since 2002 and 16% since 2012) compared with S&E doctorates awarded to temporary visa holders. In 2022, the number of S&E U.S. citizen and permanent resident doctorate recipients was 26,408, an increase of 2,787 from 2021.
Doctorates awarded in S&E and non-S&E fields, by citizenship status: 2002–22
| Year | S&E U.S. citizens and permanent residents | S&E temporary visa holders | Non-S&E U.S. citizens and permanent residents | Non-S&E temporary visa holders |
|---|---|---|---|---|
| 2002 | 16,608 | 8,000 | 11,129 | 1,747 |
| 2003 | 16,831 | 8,685 | 11,339 | 1,912 |
| 2004 | 16,879 | 9,494 | 11,161 | 2,134 |
| 2005 | 17,177 | 10,761 | 10,768 | 2,071 |
| 2006 | 18,073 | 11,941 | 10,955 | 2,257 |
| 2007 | 18,635 | 12,762 | 10,866 | 2,361 |
| 2008 | 19,869 | 13,045 | 10,975 | 2,216 |
| 2009 | 21,103 | 12,570 | 11,224 | 2,166 |
| 2010 | 21,406 | 11,675 | 10,196 | 1,961 |
| 2011 | 21,963 | 12,185 | 9,762 | 2,050 |
| 2012 | 22,857 | 12,729 | 10,124 | 2,055 |
| 2013 | 23,461 | 13,435 | 10,503 | 2,239 |
| 2014 | 23,883 | 13,725 | 10,120 | 2,114 |
| 2015 | 24,518 | 14,010 | 10,553 | 2,119 |
| 2016 | 25,060 | 14,313 | 10,618 | 2,164 |
| 2017 | 25,444 | 14,122 | 10,292 | 2,166 |
| 2018 | 25,436 | 15,204 | 9,913 | 2,378 |
| 2019 | 25,673 | 15,777 | 9,554 | 2,547 |
| 2020 | 24,919 | 15,997 | 9,543 | 2,476 |
| 2021 | 23,621 | 15,335 | 8,270 | 2,436 |
| 2022 | 26,408 | 17,091 | 8,903 | 2,542 |
S&E = science and engineering.
Note(s):
Excludes respondents who did not report citizenship. Counts of unreported citizenship fluctuated between 1,995 and 4,144.
Countries or economies of foreign citizenship
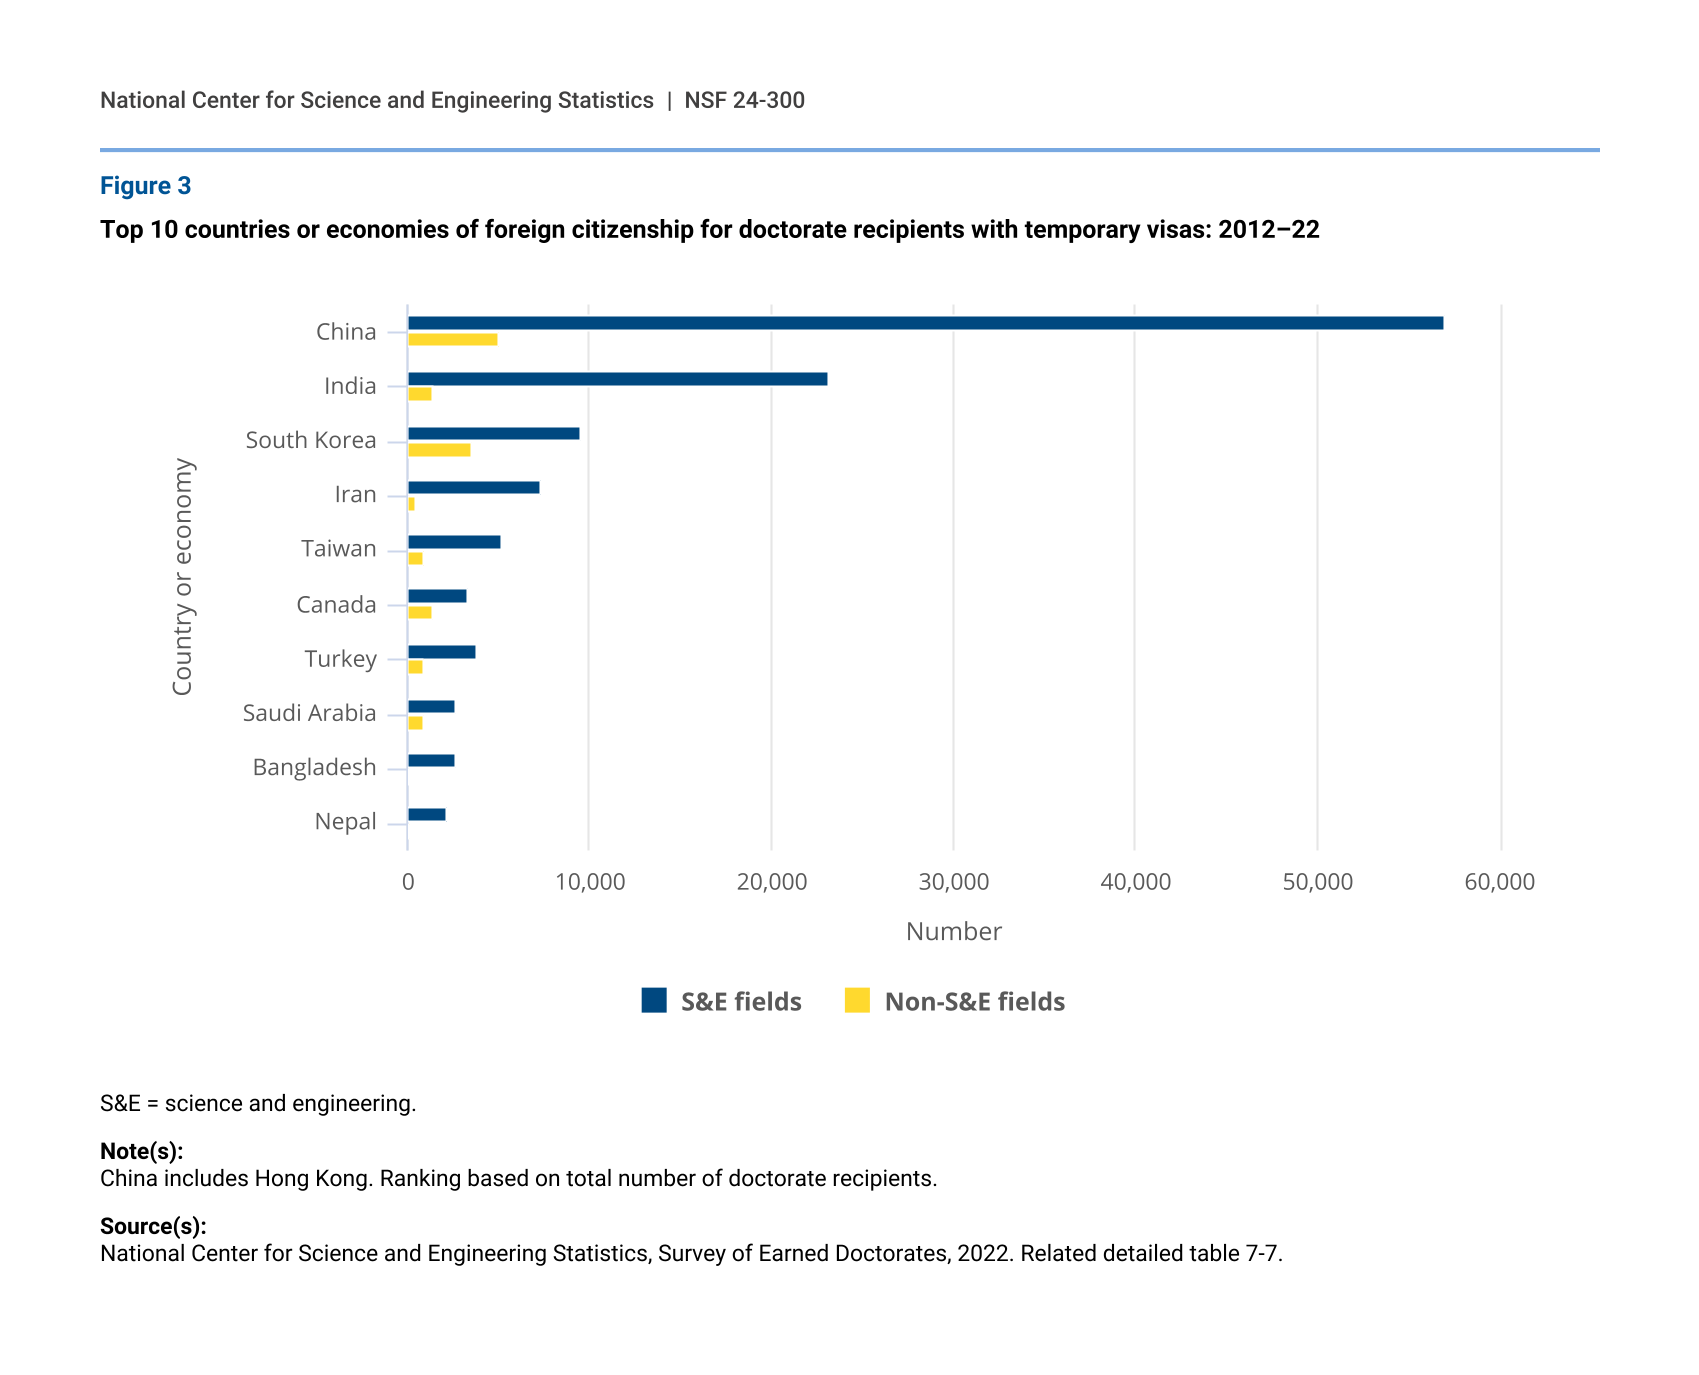
The number of doctorate recipients on temporary visas is highly concentrated in a few countries or economies of origin. Between 2012 and 2022, 10 countries or economies accounted for 70% of the 186,974 doctorates awarded to temporary visa holders during that time, and the top three countries—China, India, and South Korea—accounted for 53% (figure 3). Between 70% and 96% of doctorate recipients from each of the top 10 countries or economies earned a doctorate in an S&E field.
Top 10 countries or economies of foreign citizenship for doctorate recipients with temporary visas: 2012–22
| Country or economy | S&E fields | Non-S&E fields |
|---|---|---|
| China | 57,072 | 5,085 |
| India | 23,103 | 1,381 |
| South Korea | 9,501 | 3,603 |
| Iran | 7,300 | 506 |
| Taiwan | 5,195 | 917 |
| Canada | 3,354 | 1,412 |
| Turkey | 3,815 | 880 |
| Saudi Arabia | 2,625 | 870 |
| Bangladesh | 2,663 | 156 |
| Nepal | 2,196 | 97 |
S&E = science and engineering.
Note(s):
China includes Hong Kong. Ranking based on total number of doctorate recipients.
Source(s):
National Center for Science and Engineering Statistics, Survey of Earned Doctorates, 2022. Related detailed table 7-7.
Citizenship and sex
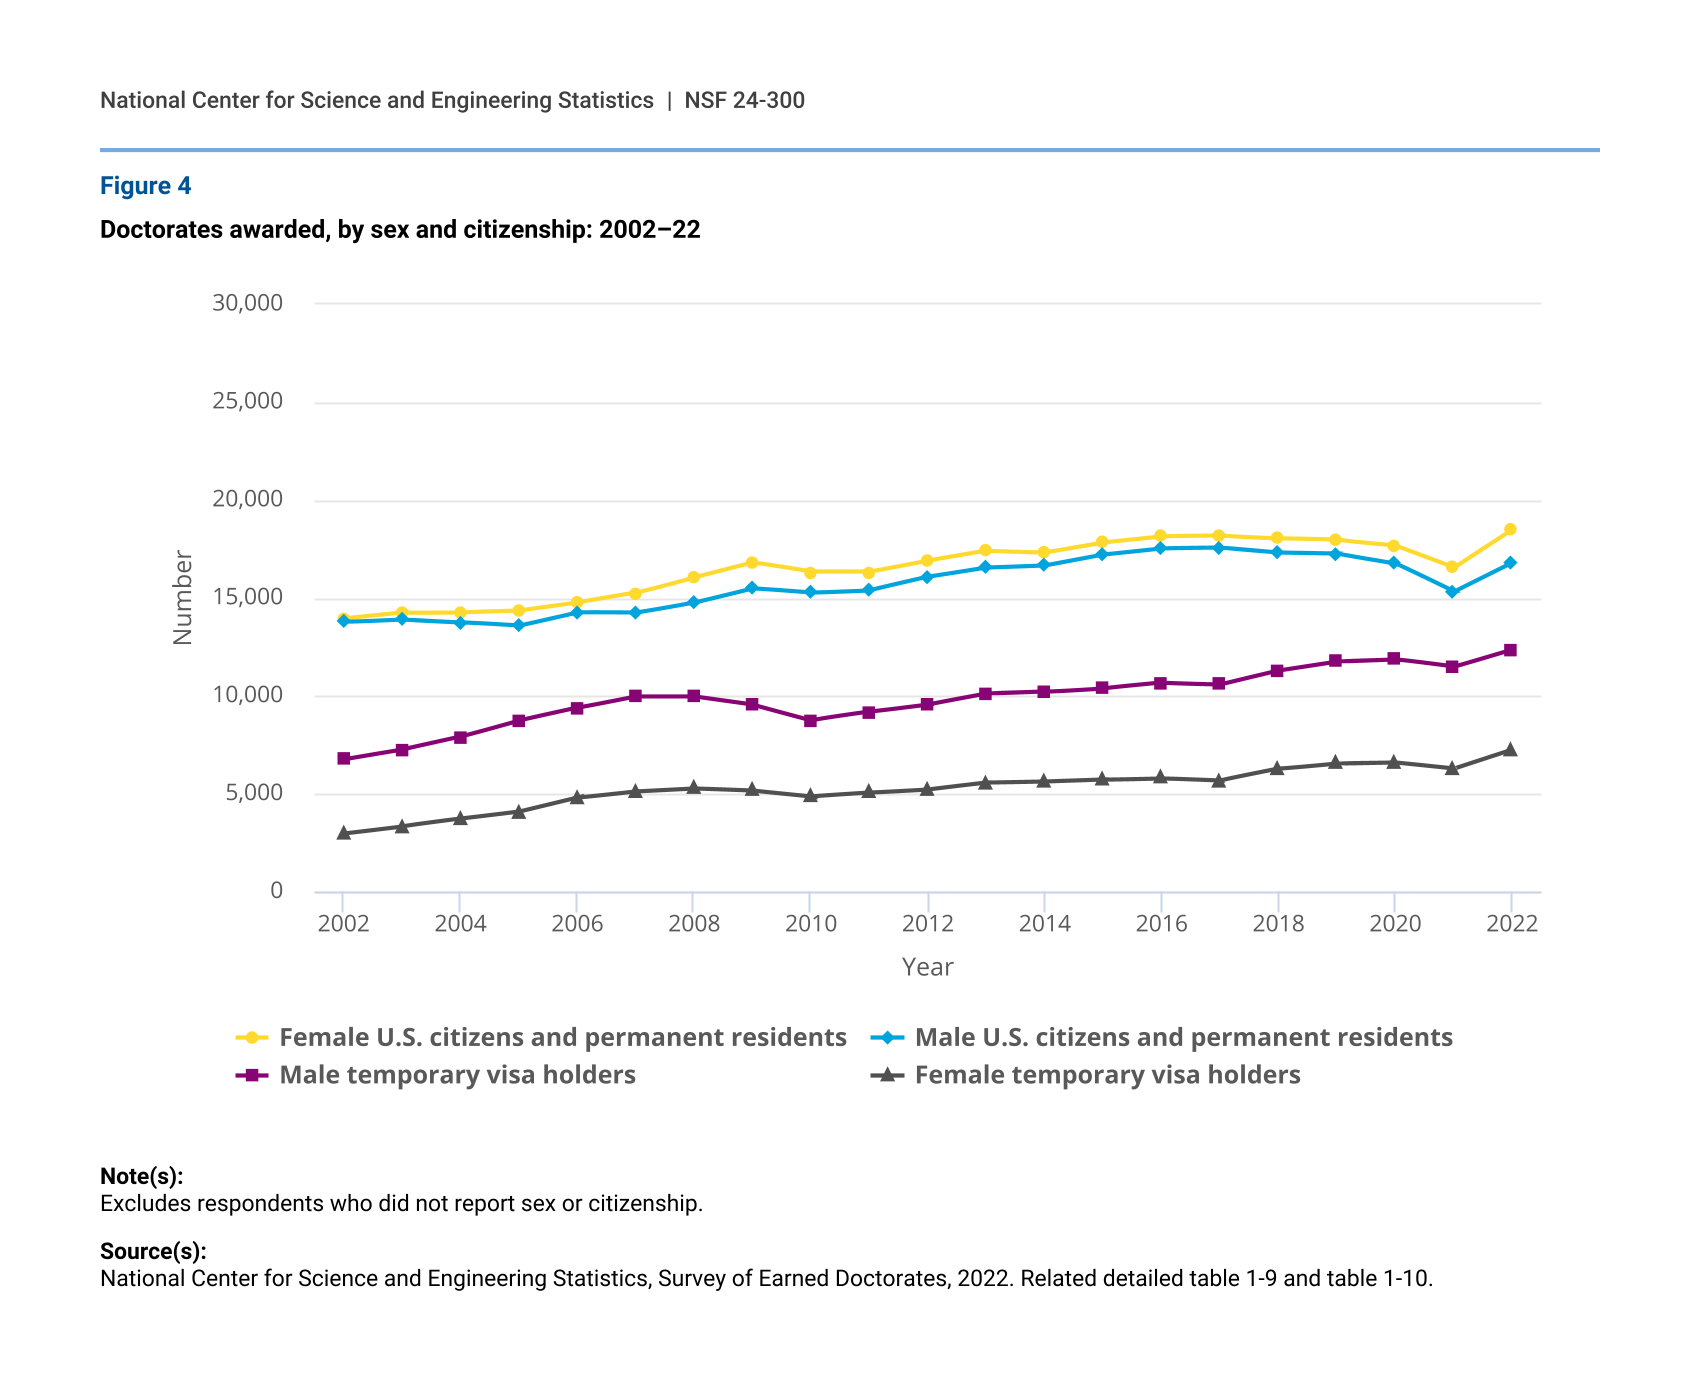
In 2022, women earned 47% of all doctorate awards (figure 4). Between 2002 and 2022, the rate of growth of female temporary visa holders was faster than the rate of growth of their U.S. citizen and permanent resident counterparts, although from a lower base. During this period, the proportion of women among U.S. citizens and permanent residents hovered around 51%–52%. Meanwhile, the proportion of women among temporary visa holders increased gradually from 31% in 2002 to 35% in 2009, held steady until 2021, and increased to 37% in 2022.
From 2021 to 2022, the increase in the number of female doctorate recipients was larger than the increase in male doctorate recipients, regardless of citizenship status. Among U.S. citizens and permanent residents, the number of women increased by 1,932 compared with 1,485 for men. Among temporary visa holders, the number of women increased by 972, compared with 890 for men.
Doctorates awarded, by sex and citizenship: 2002–22
| Year | Female U.S. citizens and permanent residents | Male U.S. citizens and permanent residents | Male temporary visa holders | Female temporary visa holders |
|---|---|---|---|---|
| 2002 | 13,957 | 13,779 | 6,765 | 2,977 |
| 2003 | 14,250 | 13,920 | 7,257 | 3,340 |
| 2004 | 14,270 | 13,770 | 7,913 | 3,715 |
| 2005 | 14,357 | 13,586 | 8,749 | 4,079 |
| 2006 | 14,762 | 14,266 | 9,398 | 4,800 |
| 2007 | 15,260 | 14,240 | 9,994 | 5,128 |
| 2008 | 16,069 | 14,774 | 9,984 | 5,277 |
| 2009 | 16,818 | 15,508 | 9,564 | 5,167 |
| 2010 | 16,327 | 15,275 | 8,768 | 4,868 |
| 2011 | 16,329 | 15,396 | 9,179 | 5,056 |
| 2012 | 16,909 | 16,072 | 9,556 | 5,224 |
| 2013 | 17,414 | 16,550 | 10,103 | 5,571 |
| 2014 | 17,343 | 16,660 | 10,204 | 5,633 |
| 2015 | 17,853 | 17,218 | 10,395 | 5,734 |
| 2016 | 18,147 | 17,530 | 10,671 | 5,805 |
| 2017 | 18,170 | 17,565 | 10,601 | 5,686 |
| 2018 | 18,036 | 17,312 | 11,308 | 6,274 |
| 2019 | 17,963 | 17,263 | 11,767 | 6,556 |
| 2020 | 17,692 | 16,770 | 11,868 | 6,605 |
| 2021 | 16,576 | 15,313 | 11,476 | 6,295 |
| 2022 | 18,508 | 16,798 | 12,366 | 7,267 |
Note(s):
Excludes respondents who did not report sex or citizenship.
Source(s):
National Center for Science and Engineering Statistics, Survey of Earned Doctorates, 2022. Related detailed table 1-9 and table 1-10.
Sex
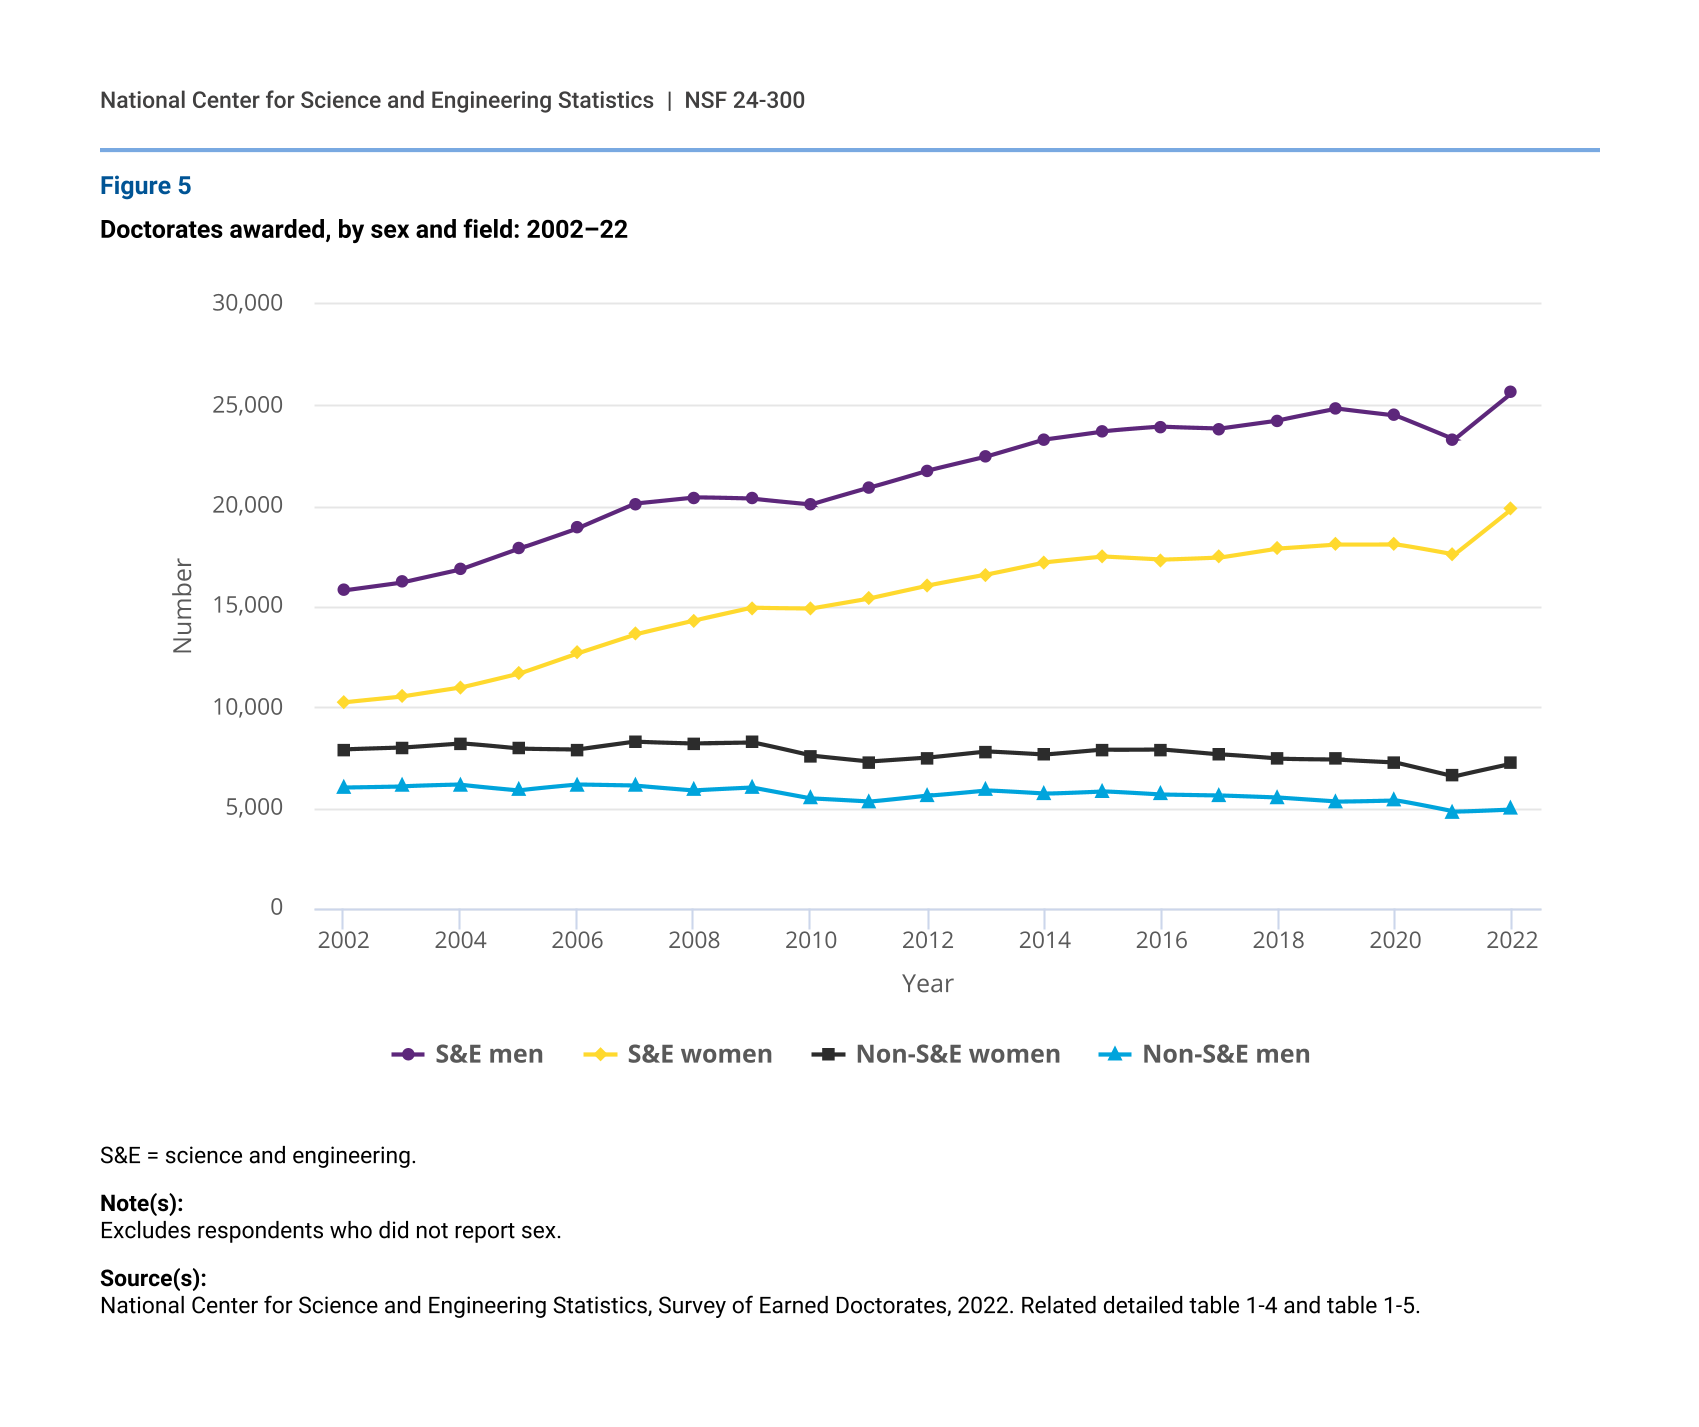
In the past 20 years, most of the growth in the number of doctorates earned by both men and women has been in S&E fields (figure 5). During this period, the number of female doctorate recipients in S&E fields increased by 94%, compared with a 62% increase in the number of male S&E doctorate recipients. The proportion of female doctorate recipients in S&E increased from 39% in 2002 to 42% in 2009, remained fairly stable through 2019, and increased to 44% by 2022. In non-S&E fields, women earned 59% of doctorates in 2022, a proportion that has hovered around 57%–59% since the early 2000s. Between 2002 and 2022, the number of female doctorate recipients in non-S&E fields declined by 9%, while the number of male doctorate recipients in those fields declined by 18%. Between 2021 and 2022, the increase in the number of women (2,313) among S&E doctorate recipients was close to that of men (2,339). In contrast, the increase in the number of women in non-S&E fields (628) was nearly five times that of men (127).
Doctorates awarded, by sex and field: 2002–22
| Year | S&E men | S&E women | Non-S&E women | Non-S&E men |
|---|---|---|---|---|
| 2002 | 15,802 | 10,236 | 7,904 | 6,004 |
| 2003 | 16,196 | 10,517 | 7,989 | 6,060 |
| 2004 | 16,836 | 10,957 | 8,198 | 6,129 |
| 2005 | 17,869 | 11,665 | 7,917 | 5,868 |
| 2006 | 18,886 | 12,676 | 7,883 | 6,134 |
| 2007 | 20,120 | 13,622 | 8,282 | 6,082 |
| 2008 | 20,419 | 14,289 | 8,205 | 5,852 |
| 2009 | 20,346 | 14,937 | 8,250 | 5,985 |
| 2010 | 20,075 | 14,912 | 7,576 | 5,449 |
| 2011 | 20,902 | 15,411 | 7,288 | 5,286 |
| 2012 | 21,761 | 16,041 | 7,485 | 5,601 |
| 2013 | 22,448 | 16,573 | 7,792 | 5,878 |
| 2014 | 23,302 | 17,189 | 7,624 | 5,706 |
| 2015 | 23,703 | 17,467 | 7,880 | 5,829 |
| 2016 | 23,915 | 17,314 | 7,908 | 5,657 |
| 2017 | 23,838 | 17,433 | 7,651 | 5,608 |
| 2018 | 24,239 | 17,886 | 7,422 | 5,503 |
| 2019 | 24,802 | 18,088 | 7,400 | 5,309 |
| 2020 | 24,468 | 18,092 | 7,264 | 5,378 |
| 2021 | 23,267 | 17,559 | 6,569 | 4,789 |
| 2022 | 25,606 | 19,872 | 7,197 | 4,916 |
S&E = science and engineering.
Note(s):
Excludes respondents who did not report sex.
Race and ethnicity
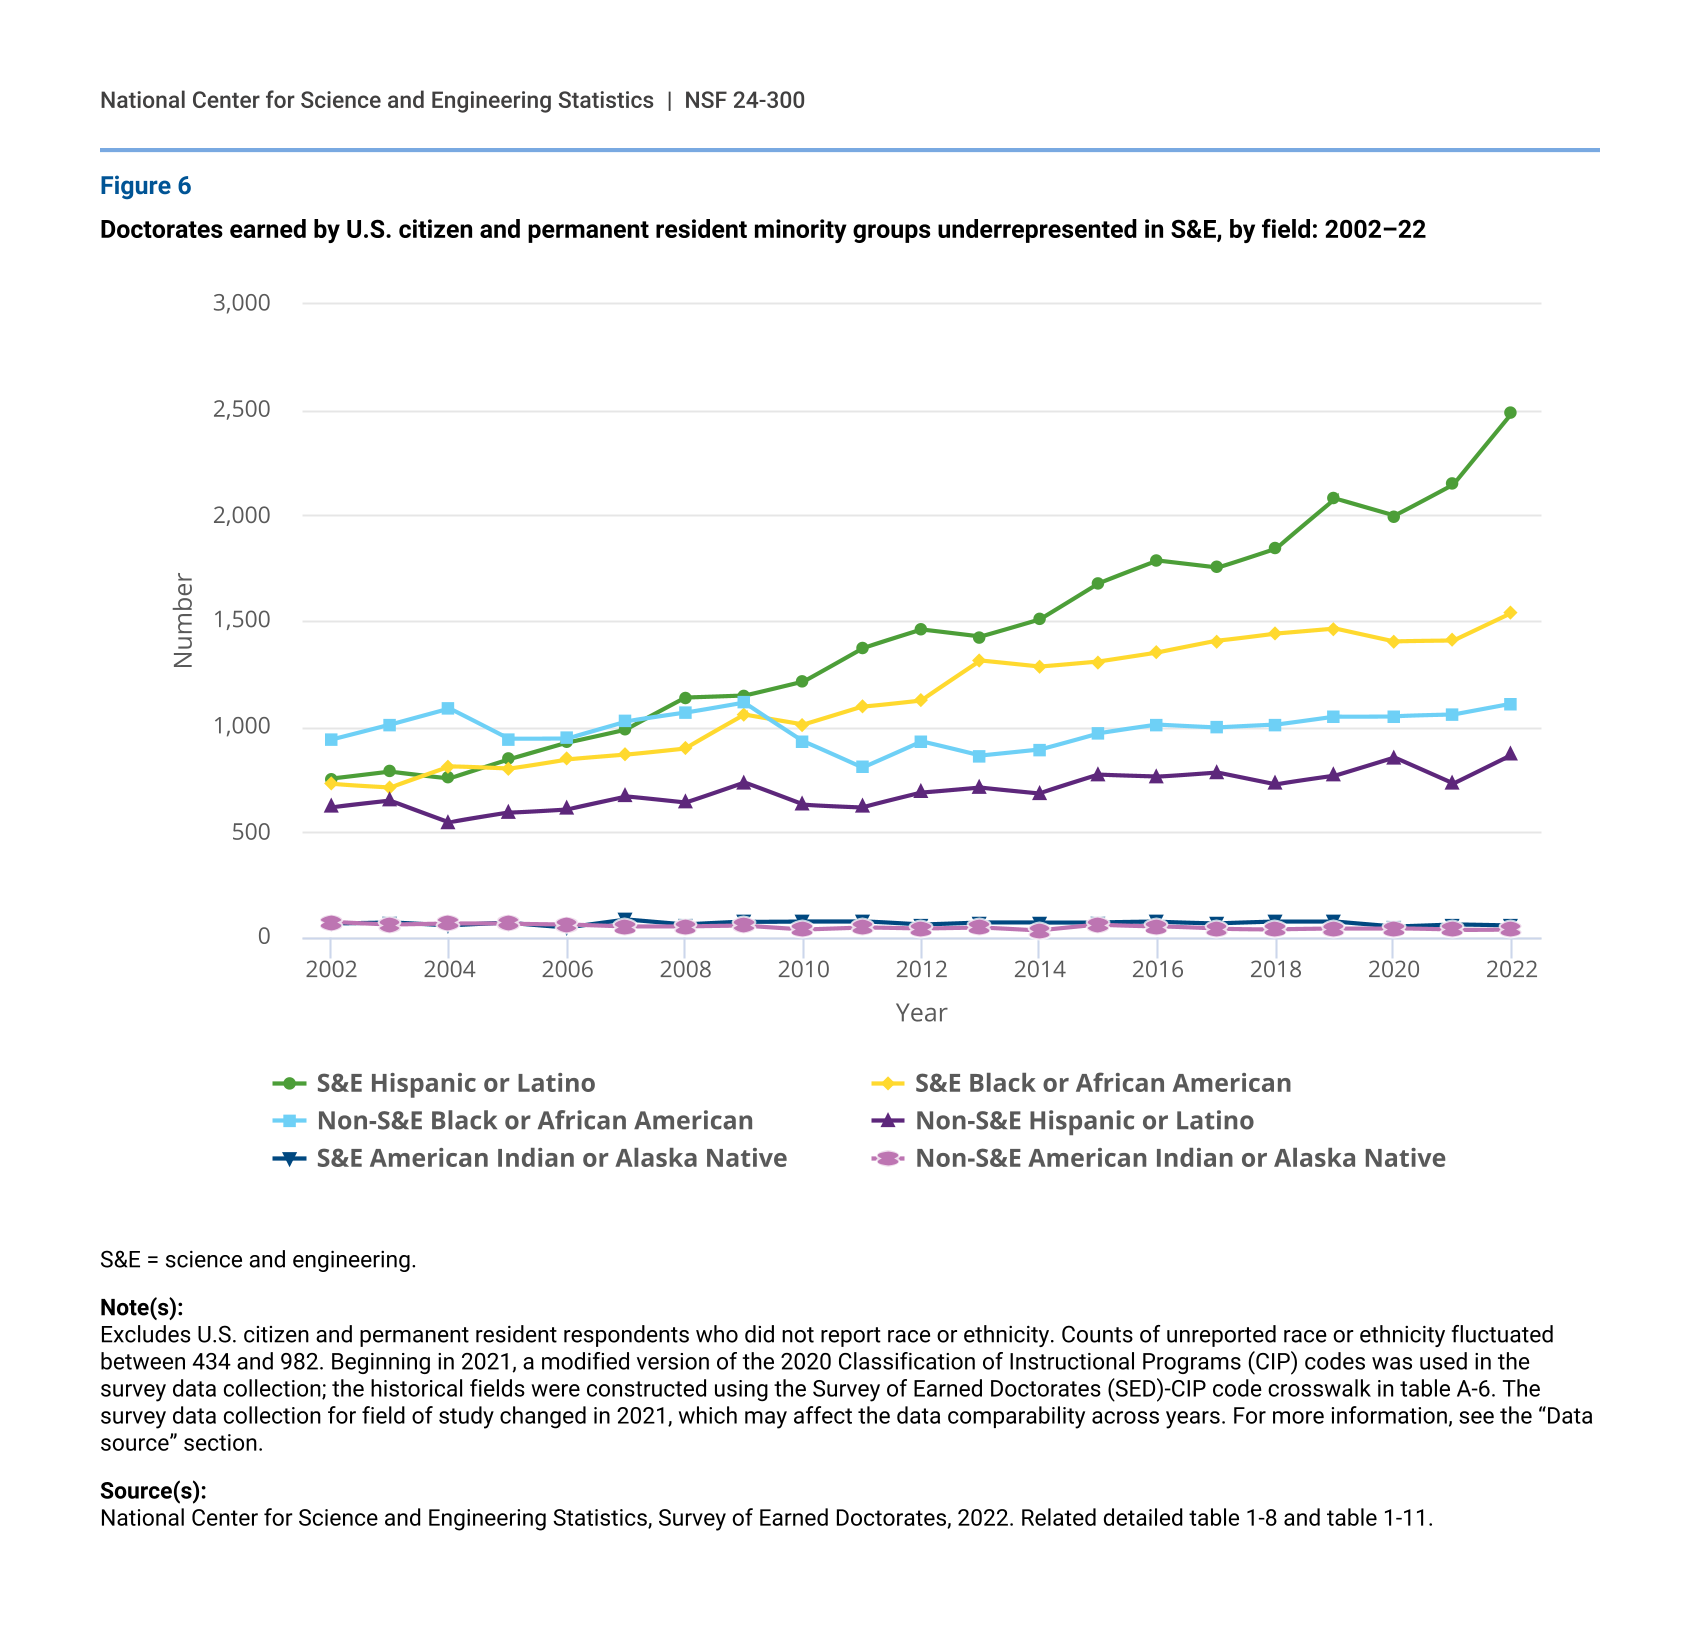
Racial and ethnic minority representation in doctorate awards has increased over time. From 2002 to 2022, the proportion of doctorates earned by White doctorate recipients among U.S. citizens and permanent residents declined from 76% to 66%, and the proportion earned by Asian U.S. citizens and permanent residents increased from 8% to 10%. The proportion of Hispanic or Latino and Black or African American U.S. citizens and permanent residents also increased, although starting from a small base (figure 6). In the past 20 years, the number of Hispanic or Latino doctorate recipients in S&E increased from 752 (5%) to 2,488 (9%). The number of Black or African American doctorate recipients in S&E increased from 728 (4%) in 2002 to 1,540 (6%) in 2022. In the same time period, the number of American Indian or Alaska Native doctorate recipients in S&E fluctuated between 49 and 86. Between 2021 and 2022, S&E doctorates awarded to American Indians or Alaska Natives declined from 64 to 58, remaining under 0.5% of S&E doctorates awarded to U.S. citizens and permanent residents. In the same time period, the number of Black or African American doctorate recipients in S&E increased by 133 to 1,540 and the number of Hispanic or Latino doctorate recipients in S&E increased by 340 to 2,488—the highest numbers of doctorates awarded to each of these groups in the past 20 years.
Doctorates earned by U.S. citizen and permanent resident minority groups underrepresented in S&E, by field: 2002–22
| Year | S&E Hispanic or Latino | S&E Black or African American | Non-S&E Black or African American | Non-S&E Hispanic or Latino | S&E American Indian or Alaska Native | Non-S&E American Indian or Alaska Native |
|---|---|---|---|---|---|---|
| 2002 | 752 | 728 | 938 | 618 | 68 | 74 |
| 2003 | 786 | 713 | 1,010 | 649 | 73 | 63 |
| 2004 | 755 | 811 | 1,086 | 547 | 57 | 68 |
| 2005 | 844 | 799 | 942 | 591 | 70 | 67 |
| 2006 | 924 | 845 | 944 | 608 | 49 | 64 |
| 2007 | 987 | 867 | 1,024 | 668 | 86 | 54 |
| 2008 | 1,135 | 897 | 1,064 | 638 | 62 | 53 |
| 2009 | 1,145 | 1,055 | 1,113 | 735 | 75 | 57 |
| 2010 | 1,213 | 1,008 | 931 | 629 | 78 | 39 |
| 2011 | 1,371 | 1,094 | 805 | 618 | 78 | 49 |
| 2012 | 1,458 | 1,125 | 930 | 686 | 61 | 43 |
| 2013 | 1,424 | 1,311 | 861 | 711 | 71 | 48 |
| 2014 | 1,506 | 1,282 | 890 | 684 | 70 | 33 |
| 2015 | 1,678 | 1,307 | 968 | 771 | 71 | 60 |
| 2016 | 1,785 | 1,350 | 1,008 | 763 | 75 | 53 |
| 2017 | 1,752 | 1,405 | 995 | 784 | 68 | 41 |
| 2018 | 1,845 | 1,441 | 1,008 | 727 | 76 | 39 |
| 2019 | 2,078 | 1,465 | 1,047 | 766 | 77 | 42 |
| 2020 | 1,998 | 1,404 | 1,049 | 852 | 54 | 43 |
| 2021 | 2,148 | 1,407 | 1,055 | 728 | 64 | 36 |
| 2022 | 2,488 | 1,540 | 1,107 | 866 | 58 | 40 |
S&E = science and engineering.
Note(s):
Excludes U.S. citizen and permanent resident respondents who did not report race or ethnicity. Counts of unreported race or ethnicity fluctuated between 434 and 982. Beginning in 2021, a modified version of the 2020 Classification of Instructional Programs (CIP) codes was used in the survey data collection; the historical fields were constructed using the Survey of Earned Doctorates (SED)-CIP code crosswalk in table A-6. The survey data collection for field of study changed in 2021, which may affect the data comparability across years. For more information, see the “Data source” section.
Source(s):
National Center for Science and Engineering Statistics, Survey of Earned Doctorates, 2022. Related detailed table 1-8 and table 1-11.