 An official website of the United States government
Report
Path to the doctorate
Some paths to the doctoral degree are less traveled and some are more difficult to navigate, owing to a variety of influences, and these paths may lead to different postgraduate outcomes.
Parental education
Overview
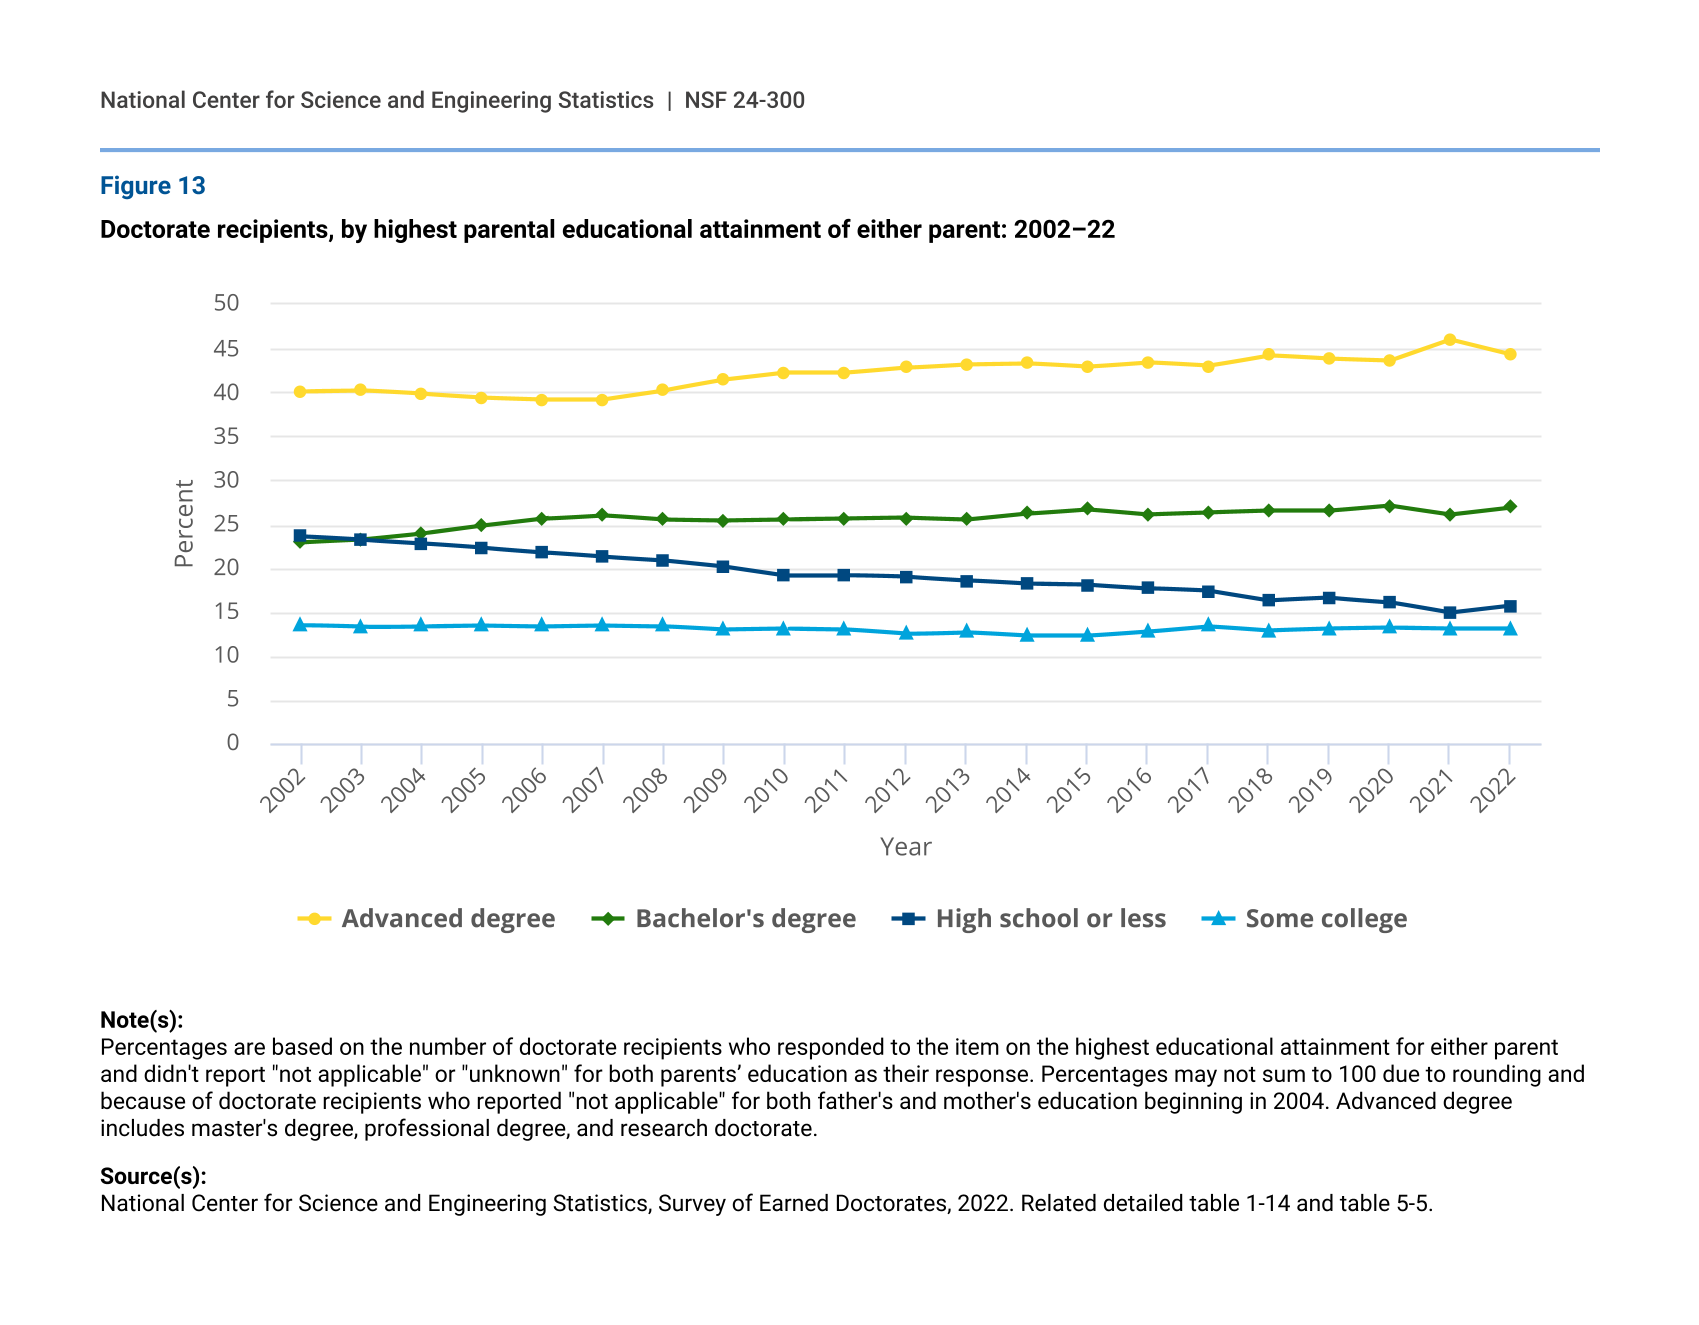
The parents of recent doctorate recipients are better educated than the parents of earlier doctorate cohorts. The proportion of doctorate recipients from families in which neither parent earned more than a high school diploma declined in the past 20 years, and the proportion of those with at least one parent with some college stayed flat. In contrast, the proportions of doctorate recipients with at least one parent holding a bachelor’s degree or an advanced degree increased in the past 20 years (figure 13). Between 2020 and 2021, there was an uptick in the proportion of doctorate recipients with a parent holding an advanced degree and a decrease among those whose parents either earned no more than a high school degree or earned a bachelor’s degree. However, by 2022, the proportions reverted to proportions closer to 2020.
Doctorate recipients, by highest parental educational attainment of either parent: 2002–22
| Year | Advanced degree | Bachelor's degree | High school or less | Some college |
|---|---|---|---|---|
| 2002 | 40.1 | 22.9 | 23.6 | 13.5 |
| 2003 | 40.2 | 23.2 | 23.2 | 13.3 |
| 2004 | 39.8 | 23.9 | 22.8 | 13.4 |
| 2005 | 39.4 | 24.8 | 22.3 | 13.5 |
| 2006 | 39.2 | 25.6 | 21.8 | 13.4 |
| 2007 | 39.2 | 26.0 | 21.3 | 13.5 |
| 2008 | 40.2 | 25.5 | 20.9 | 13.4 |
| 2009 | 41.4 | 25.4 | 20.2 | 13.0 |
| 2010 | 42.2 | 25.5 | 19.2 | 13.1 |
| 2011 | 42.2 | 25.6 | 19.2 | 13.0 |
| 2012 | 42.8 | 25.7 | 19.0 | 12.5 |
| 2013 | 43.2 | 25.5 | 18.6 | 12.7 |
| 2014 | 43.3 | 26.2 | 18.2 | 12.3 |
| 2015 | 42.9 | 26.7 | 18.1 | 12.3 |
| 2016 | 43.4 | 26.1 | 17.7 | 12.8 |
| 2017 | 43.0 | 26.3 | 17.4 | 13.4 |
| 2018 | 44.2 | 26.5 | 16.3 | 12.9 |
| 2019 | 43.8 | 26.5 | 16.6 | 13.1 |
| 2020 | 43.6 | 27.1 | 16.1 | 13.2 |
| 2021 | 46.0 | 26.1 | 14.9 | 13.1 |
| 2022 | 44.3 | 26.9 | 15.7 | 13.1 |
Note(s):
Percentages are based on the number of doctorate recipients who responded to the item on the highest educational attainment for either parent and didn't report "not applicable" or "unknown" for both parents’ education as their response. Percentages may not sum to 100 due to rounding and because of doctorate recipients who reported "not applicable" for both father's and mother's education beginning in 2004. Advanced degree includes master's degree, professional degree, and research doctorate.
Source(s):
National Center for Science and Engineering Statistics, Survey of Earned Doctorates, 2022. Related detailed table 1-14 and table 5-5.
Race and ethnicity
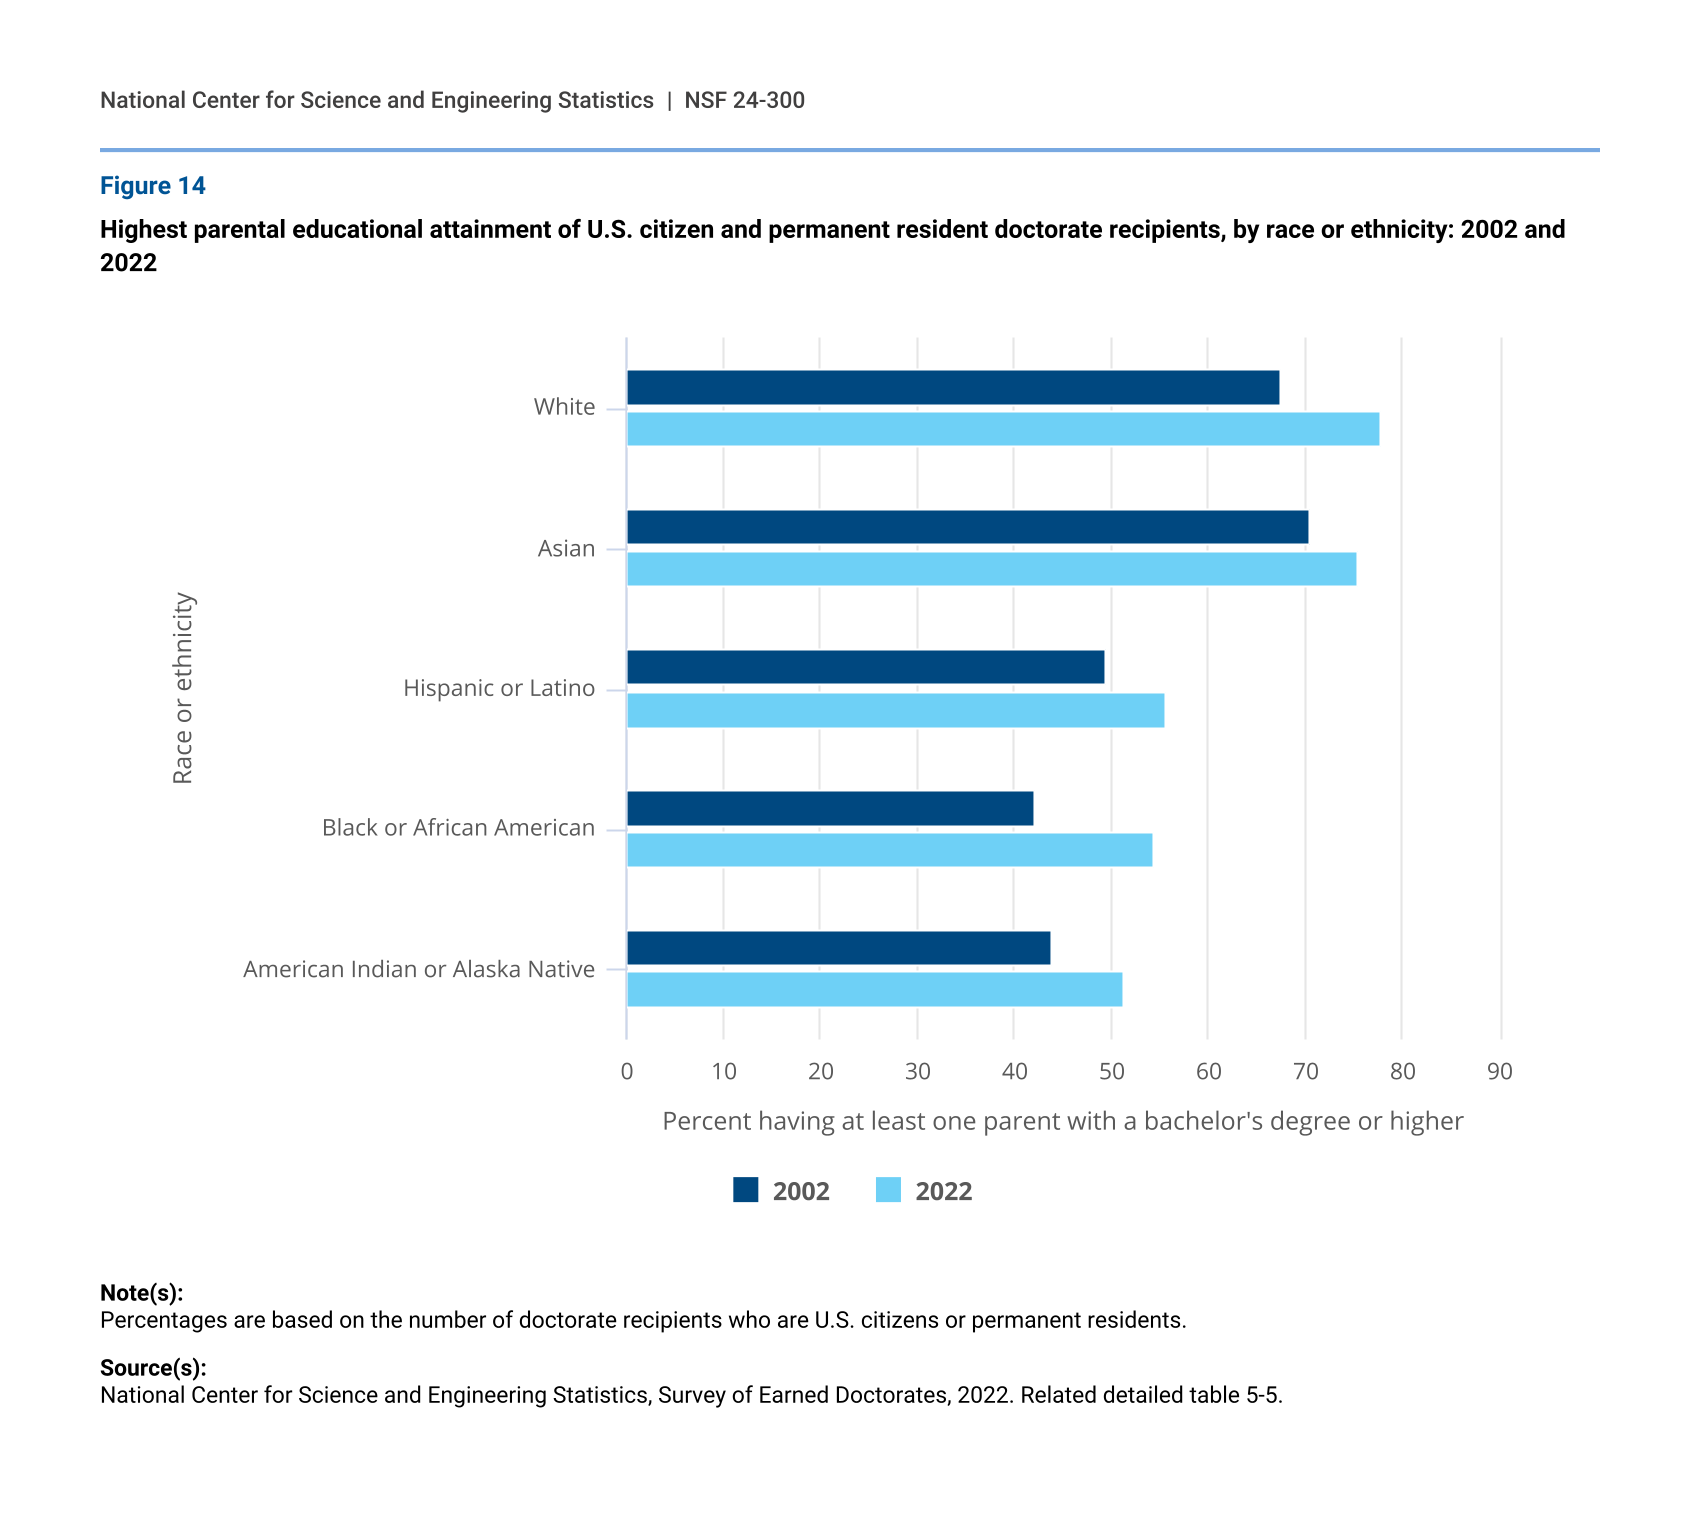
Between 2002 and 2022, the pattern of rising parental educational attainment was visible among all races and ethnicities for doctorate recipients who were U.S. citizens or permanent residents, with the largest increases among Black or African American (12 percentage points) and White (10 percentage points) doctorate recipients (figure 14). While parental educational attainment increased over the past 20 years, as of 2022 it was still uneven across groups. In 2022, 78% of White and 76% of Asian doctorate recipients had at least one parent who held a bachelor’s degree or higher, compared with between 51% and 56% of doctorate recipients who were Black or African American, Hispanic or Latino, or American Indian or Alaska Native.
Highest parental educational attainment of U.S. citizen and permanent resident doctorate recipients, by race or ethnicity: 2002 and 2022
| Race or ethnicity | 2002 | 2022 |
|---|---|---|
| White | 67.4 | 77.7 |
| Asian | 70.5 | 75.5 |
| Hispanic or Latino | 49.4 | 55.6 |
| Black or African American | 42.1 | 54.3 |
| American Indian or Alaska Native | 43.9 | 51.3 |
Note(s):
Percentages are based on the number of doctorate recipients who are U.S. citizens or permanent residents.
Source(s):
National Center for Science and Engineering Statistics, Survey of Earned Doctorates, 2022. Related detailed table 5-5.
Sources of financial support
Overview
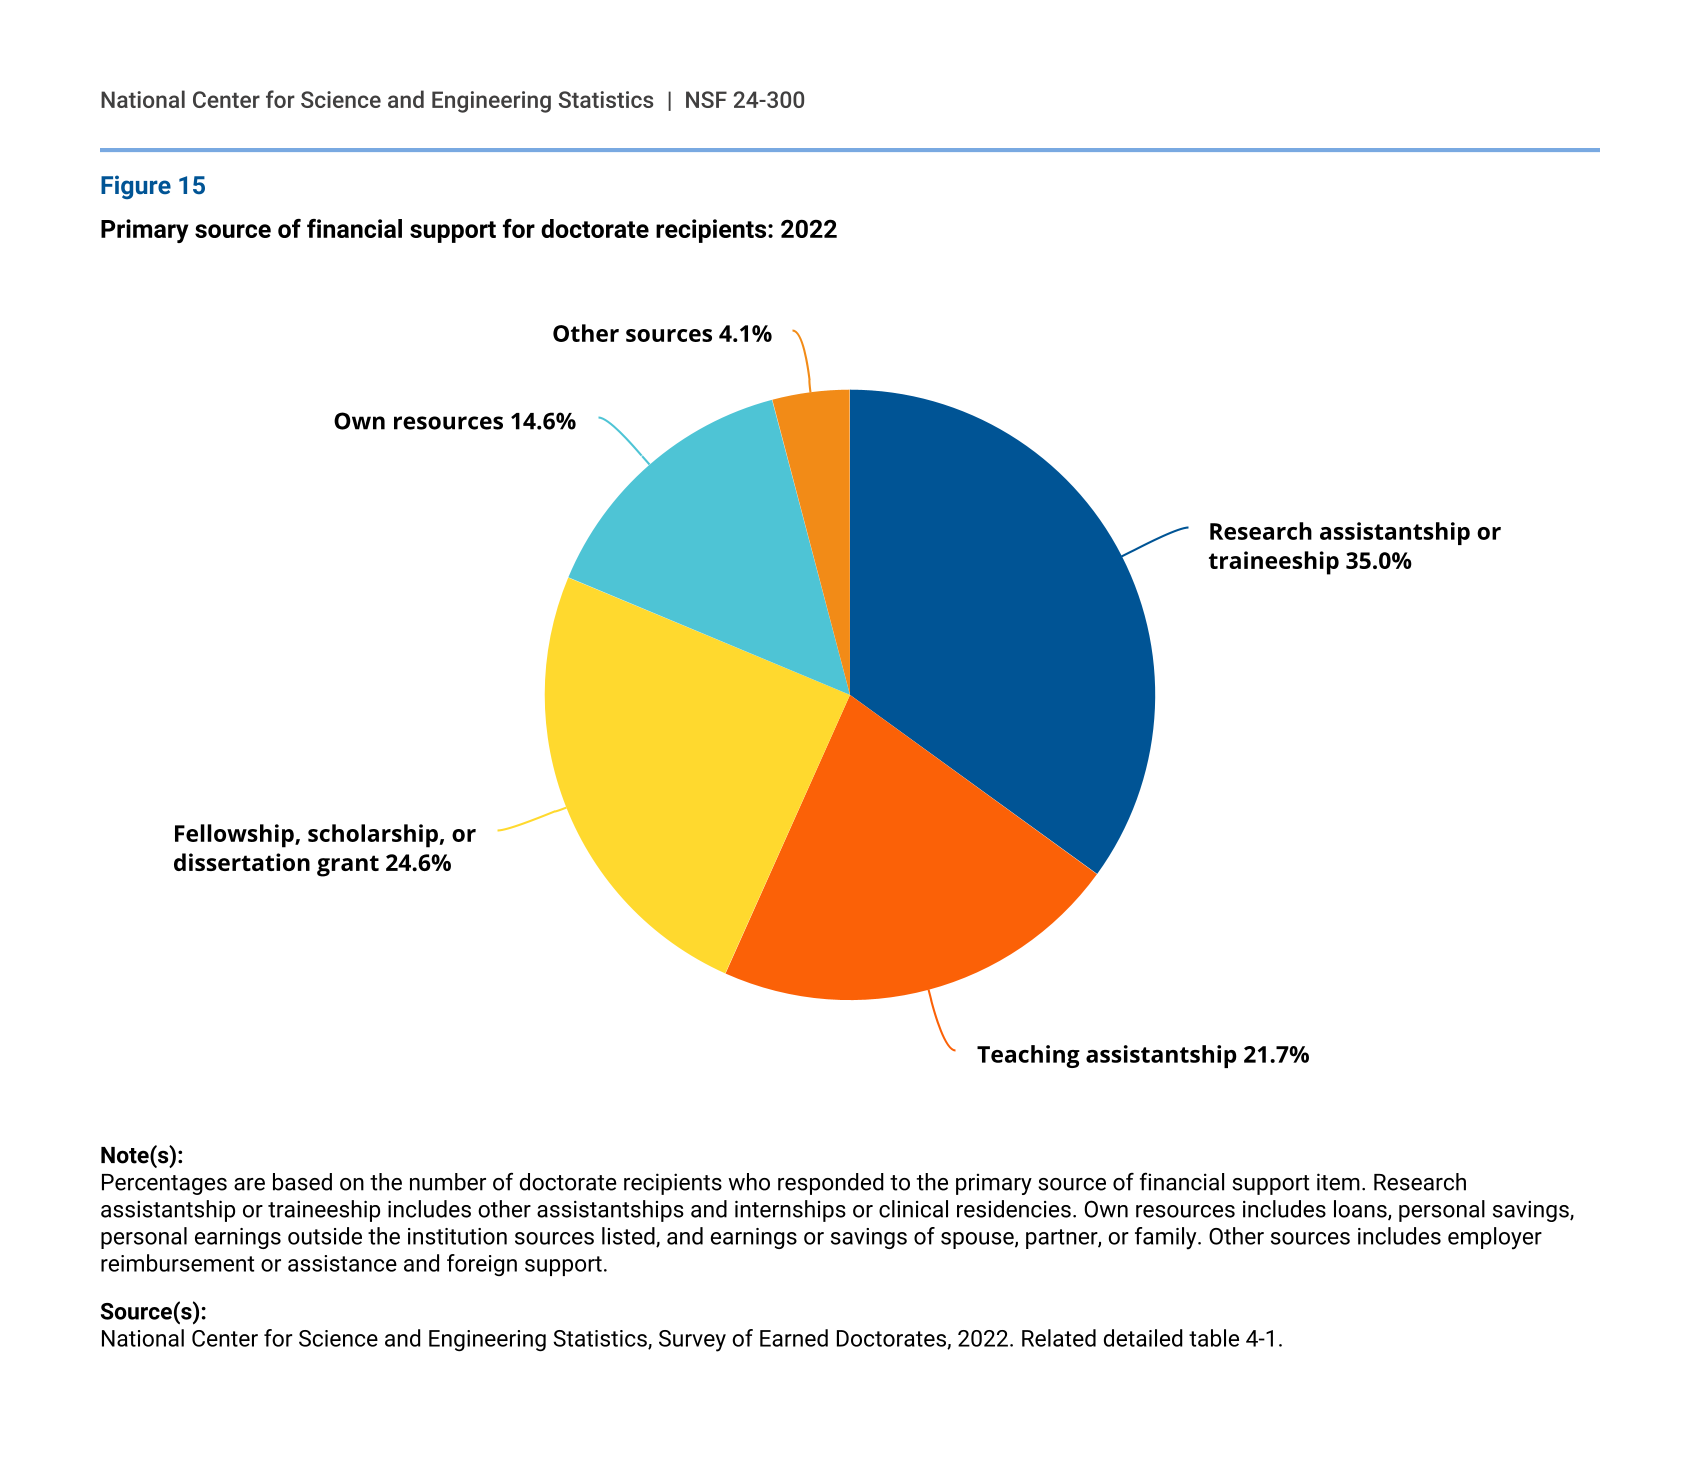
Most doctorate recipients received some type of funding in the pursuit of their degree. In 2022, 35% of doctorate recipients were primarily supported by research assistantships or traineeships; 25% by fellowships, scholarships, or dissertation grants; and 22% by teaching assistantships. About 15% of doctorate recipients relied primarily on their own resources—such as loans, personal savings, personal earnings, and the earnings or savings of their spouse, partner, or family—to finance their doctoral studies; 4% relied on other sources, such as employer reimbursement and foreign support (figure 15).
Primary source of financial support for doctorate recipients: 2022
| Source | Percent |
|---|---|
| Research assistantship or traineeship | 35.0 |
| Teaching assistantship | 21.7 |
| Fellowship, scholarship, or dissertation grant | 24.6 |
| Own resources | 14.6 |
| Other sources | 4.1 |
Note(s):
Percentages are based on the number of doctorate recipients who responded to the primary source of financial support item. Research assistantship or traineeship includes other assistantships and internships or clinical residencies. Own resources includes loans, personal savings, personal earnings outside the institution sources listed, and earnings or savings of spouse, partner, or family. Other sources includes employer reimbursement or assistance and foreign support.
Source(s):
National Center for Science and Engineering Statistics, Survey of Earned Doctorates, 2022. Related detailed table 4-1.
Doctorate field
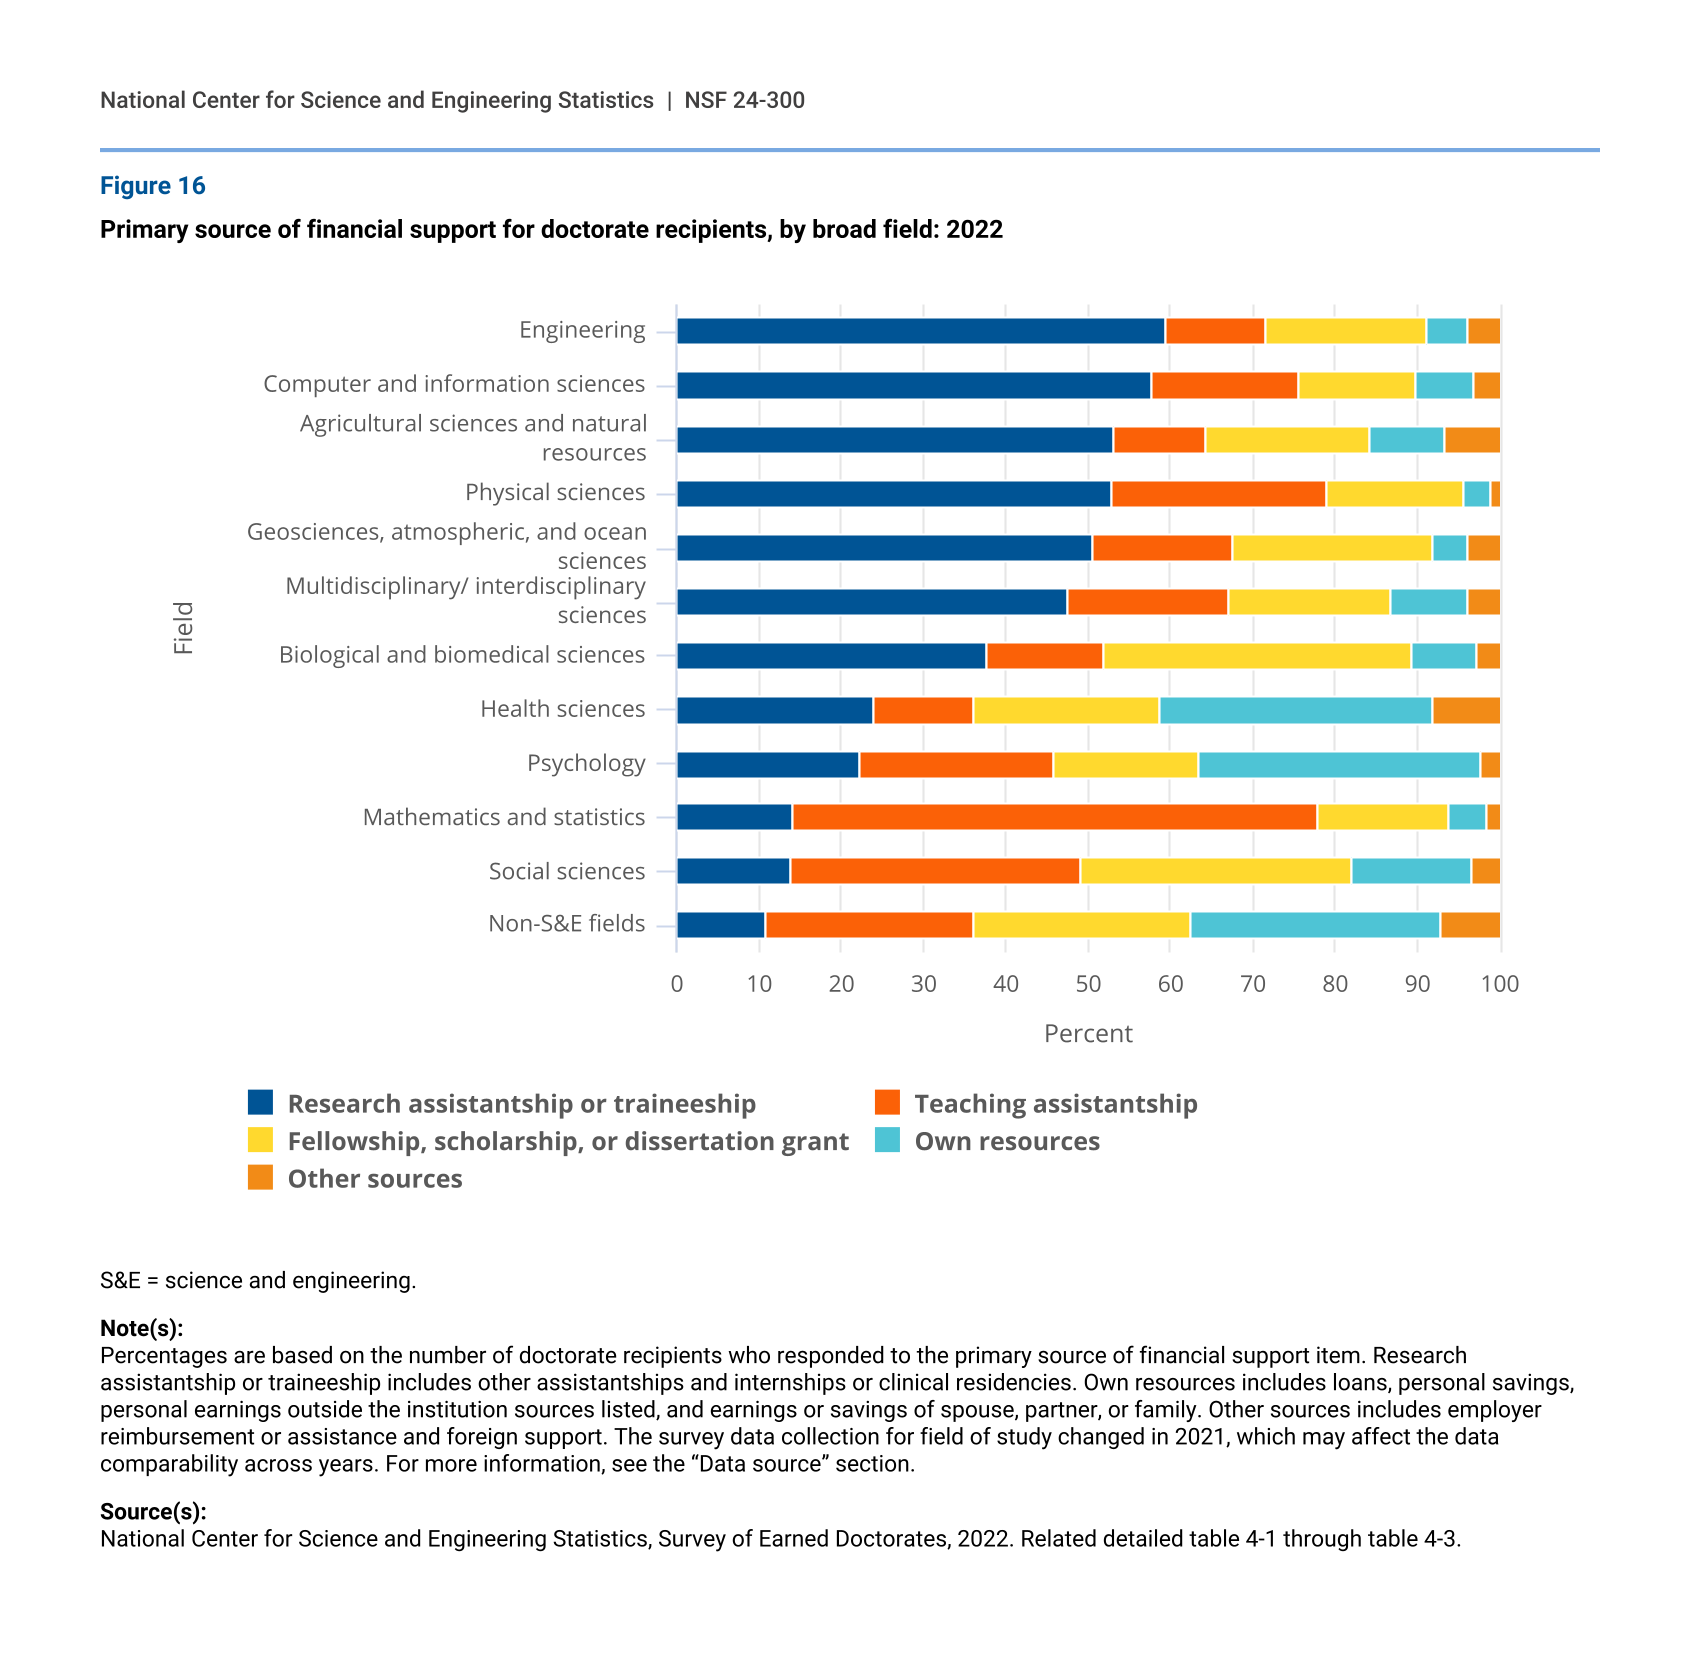
Doctorate recipients’ primary sources of financial support vary by broad S&E field. In 2022, research assistantships were the most common primary source of financial support for doctorate recipients in engineering; computer and information sciences; agricultural sciences and natural resources; multidisciplinary/interdisciplinary sciences; physical sciences; and geosciences, atmospheric, and ocean sciences (figure 16). In mathematics and statistics, teaching assistantships were the most frequent source of financial support. Fellowships, scholarships, or dissertation grants and research assistantships or traineeships were about as common for doctoral students in biological and biomedical sciences. About a third of doctorate recipients in health sciences and in psychology relied on their own resources as their primary source of financial support. For social sciences doctorate recipients, the most reported primary sources of financial support were teaching assistantships or fellowships, scholarships, or dissertation grants.
Primary source of financial support for doctorate recipients, by broad field: 2022
| Field | Research assistantship or traineeship | Teaching assistantship | Fellowship, scholarship, or dissertation grant | Own resources | Other sources |
|---|---|---|---|---|---|
| Engineering | 59.6 | 12.0 | 19.5 | 5.0 | 3.9 |
| Computer and information sciences | 57.6 | 18.1 | 14.3 | 6.9 | 3.2 |
| Agricultural sciences and natural resources | 53.2 | 11.1 | 19.9 | 9.2 | 6.6 |
| Physical sciences | 52.9 | 26.0 | 16.9 | 3.2 | 1.0 |
| Geosciences, atmospheric, and ocean sciences | 50.6 | 17.0 | 24.4 | 4.2 | 3.7 |
| Multidisciplinary/ interdisciplinary sciences | 47.6 | 19.6 | 19.7 | 9.2 | 4.0 |
| Biological and biomedical sciences | 37.7 | 14.1 | 37.6 | 7.7 | 3.0 |
| Health sciences | 24.1 | 12.1 | 22.5 | 33.1 | 8.2 |
| Psychology | 22.3 | 23.6 | 17.6 | 34.2 | 2.3 |
| Mathematics and statistics | 14.2 | 63.7 | 15.9 | 4.7 | 1.6 |
| Social sciences | 13.8 | 35.4 | 32.9 | 14.6 | 3.4 |
| Non-S&E fields | 10.9 | 25.4 | 26.2 | 30.4 | 7.1 |
S&E = science and engineering.
Note(s):
Percentages are based on the number of doctorate recipients who responded to the primary source of financial support item. Research assistantship or traineeship includes other assistantships and internships or clinical residencies. Own resources includes loans, personal savings, personal earnings outside the institution sources listed, and earnings or savings of spouse, partner, or family. Other sources includes employer reimbursement or assistance and foreign support. The survey data collection for field of study changed in 2021, which may affect the data comparability across years. For more information, see the “Data source” section.
Graduate debt
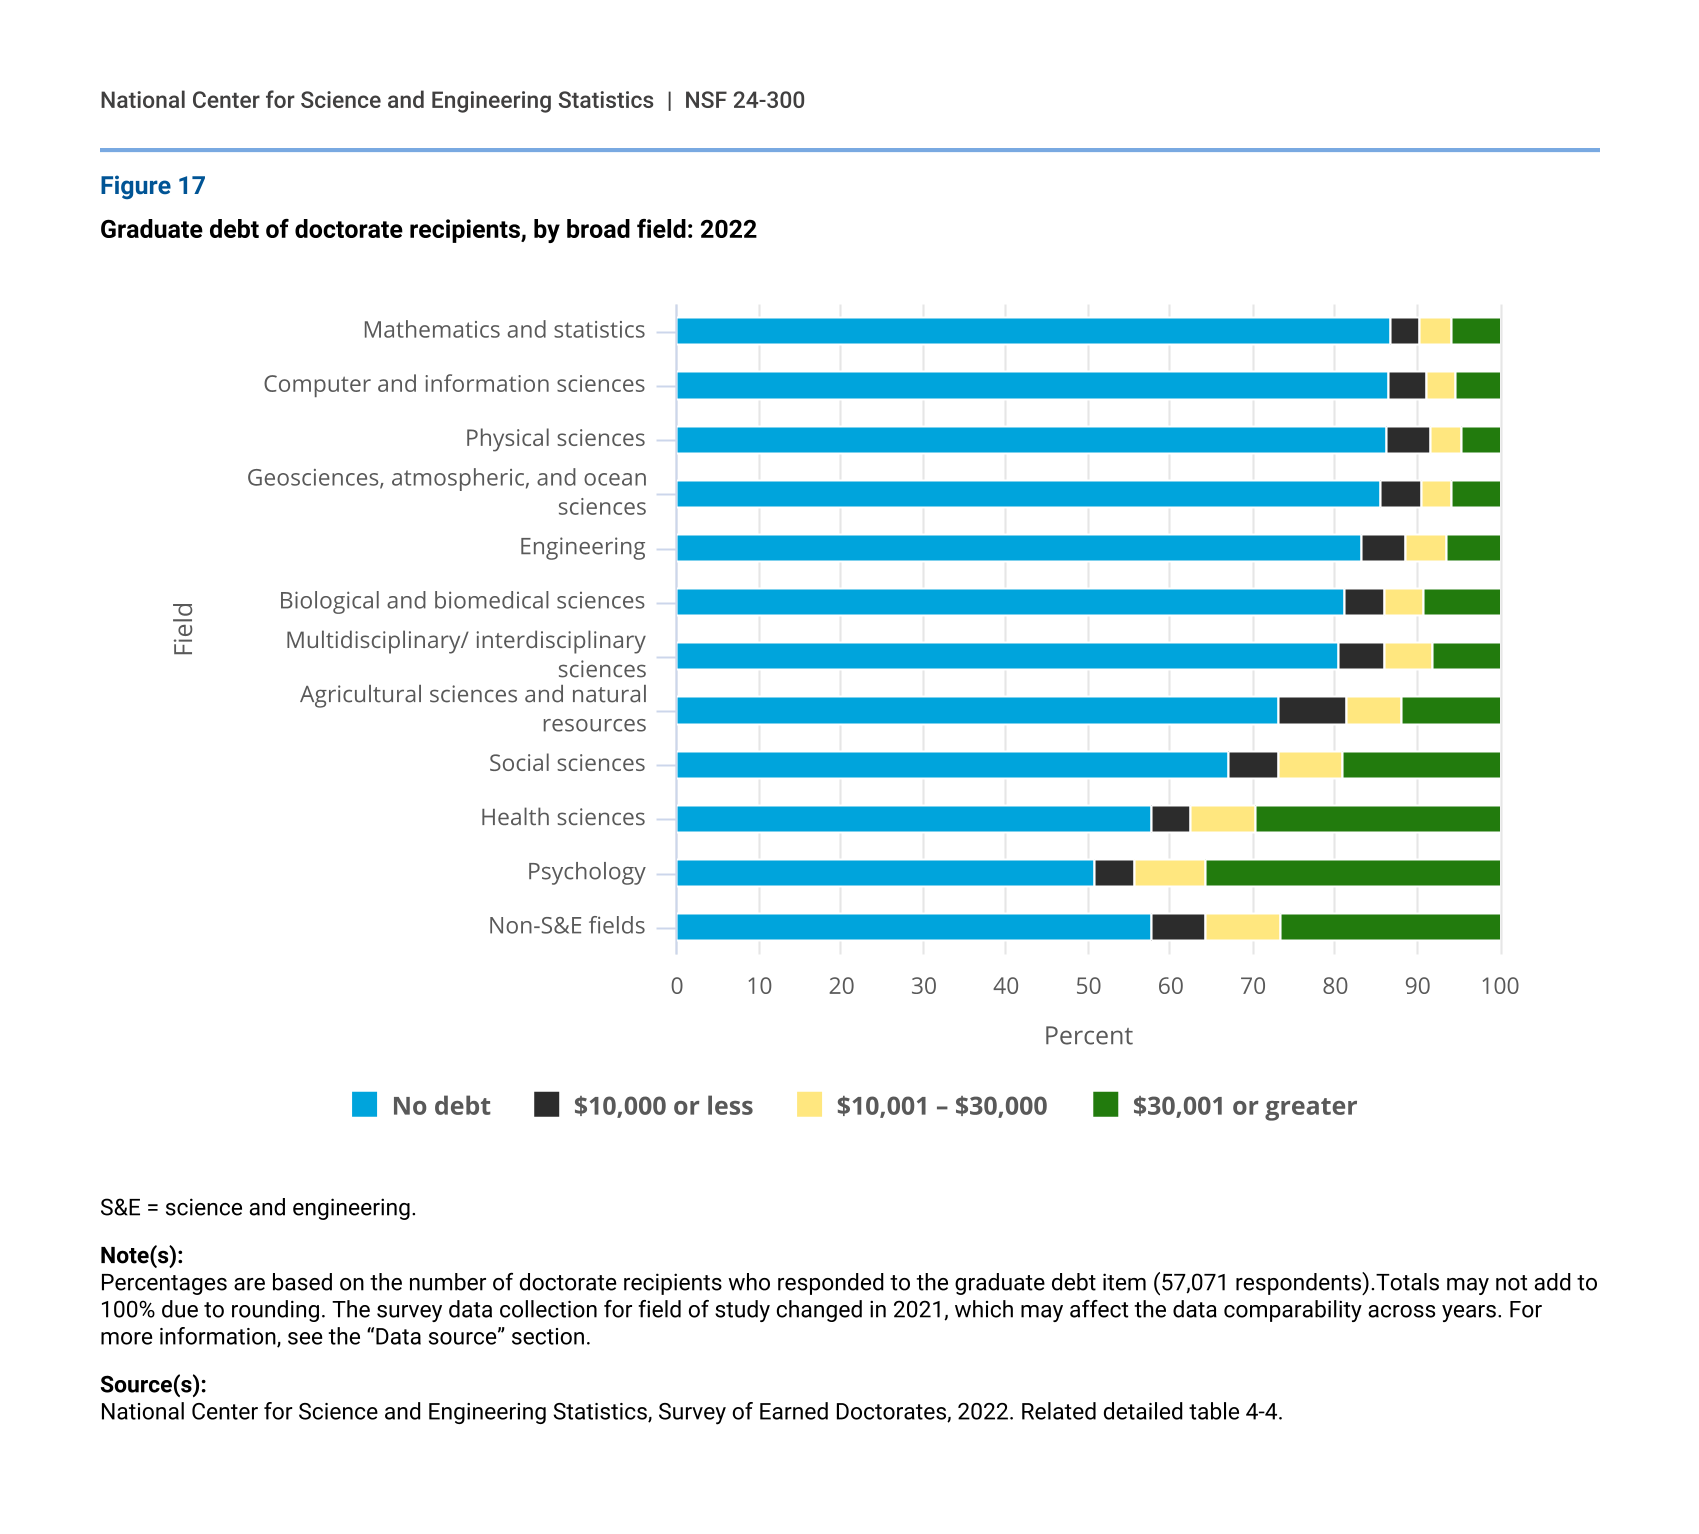
The amount of education-related debt incurred by doctorate recipients during graduate school is an indicator of the availability of financial support and the affordability of graduate education. In 2022, large majorities (80% and above) of doctorate recipients in mathematics and statistics; computer and information sciences; physical sciences; geosciences, atmospheric, and ocean sciences; engineering; biological and biomedical sciences; and multidisciplinary/interdisciplinary sciences reported holding no debt related to their graduate education (figure 17). Over 85% of the doctorate recipients in these fields received support in the form of research assistantships or traineeships; fellowships, scholarships, or dissertation grants; or teaching assistantships. In agricultural sciences, natural resources, and conservation; social sciences; health sciences; psychology; and in non-S&E fields, the proportion of doctorate recipients with no debt ranged between 51% and 73%. Within each of these broad fields, between 4% and 8% of doctorate recipients had incurred low levels of graduate debt ($10,000 or less). The shares of doctoral recipients with graduate debt burdens over $30,000 were greatest in psychology (36%), health sciences (29%), and non-S&E fields (27%).
Graduate debt of doctorate recipients, by broad field: 2022
| Field | No debt | $10,000 or less | $10,001 – $30,000 | $30,001 or greater |
|---|---|---|---|---|
| Mathematics and statistics | 86.9 | 3.5 | 3.9 | 5.7 |
| Computer and information sciences | 86.5 | 4.6 | 3.6 | 5.2 |
| Physical sciences | 86.4 | 5.3 | 3.8 | 4.6 |
| Geosciences, atmospheric, and ocean sciences | 85.6 | 5.0 | 3.7 | 5.7 |
| Engineering | 83.2 | 5.4 | 5.0 | 6.4 |
| Biological and biomedical sciences | 81.2 | 5.0 | 4.8 | 9.0 |
| Multidisciplinary/ interdisciplinary sciences | 80.6 | 5.6 | 5.6 | 8.3 |
| Agricultural sciences and natural resources | 73.1 | 8.3 | 6.6 | 12.0 |
| Social sciences | 67.2 | 5.9 | 7.8 | 19.1 |
| Health sciences | 57.6 | 5.0 | 7.9 | 29.4 |
| Psychology | 50.9 | 4.9 | 8.6 | 35.5 |
| Non-S&E fields | 57.8 | 6.5 | 9.1 | 26.6 |
S&E = science and engineering.
Note(s):
Percentages are based on the number of doctorate recipients who responded to the graduate debt item (57,071 respondents).Totals may not add to 100% due to rounding. The survey data collection for field of study changed in 2021, which may affect the data comparability across years. For more information, see the “Data source” section.
Source(s):
National Center for Science and Engineering Statistics, Survey of Earned Doctorates, 2022. Related detailed table 4-4.
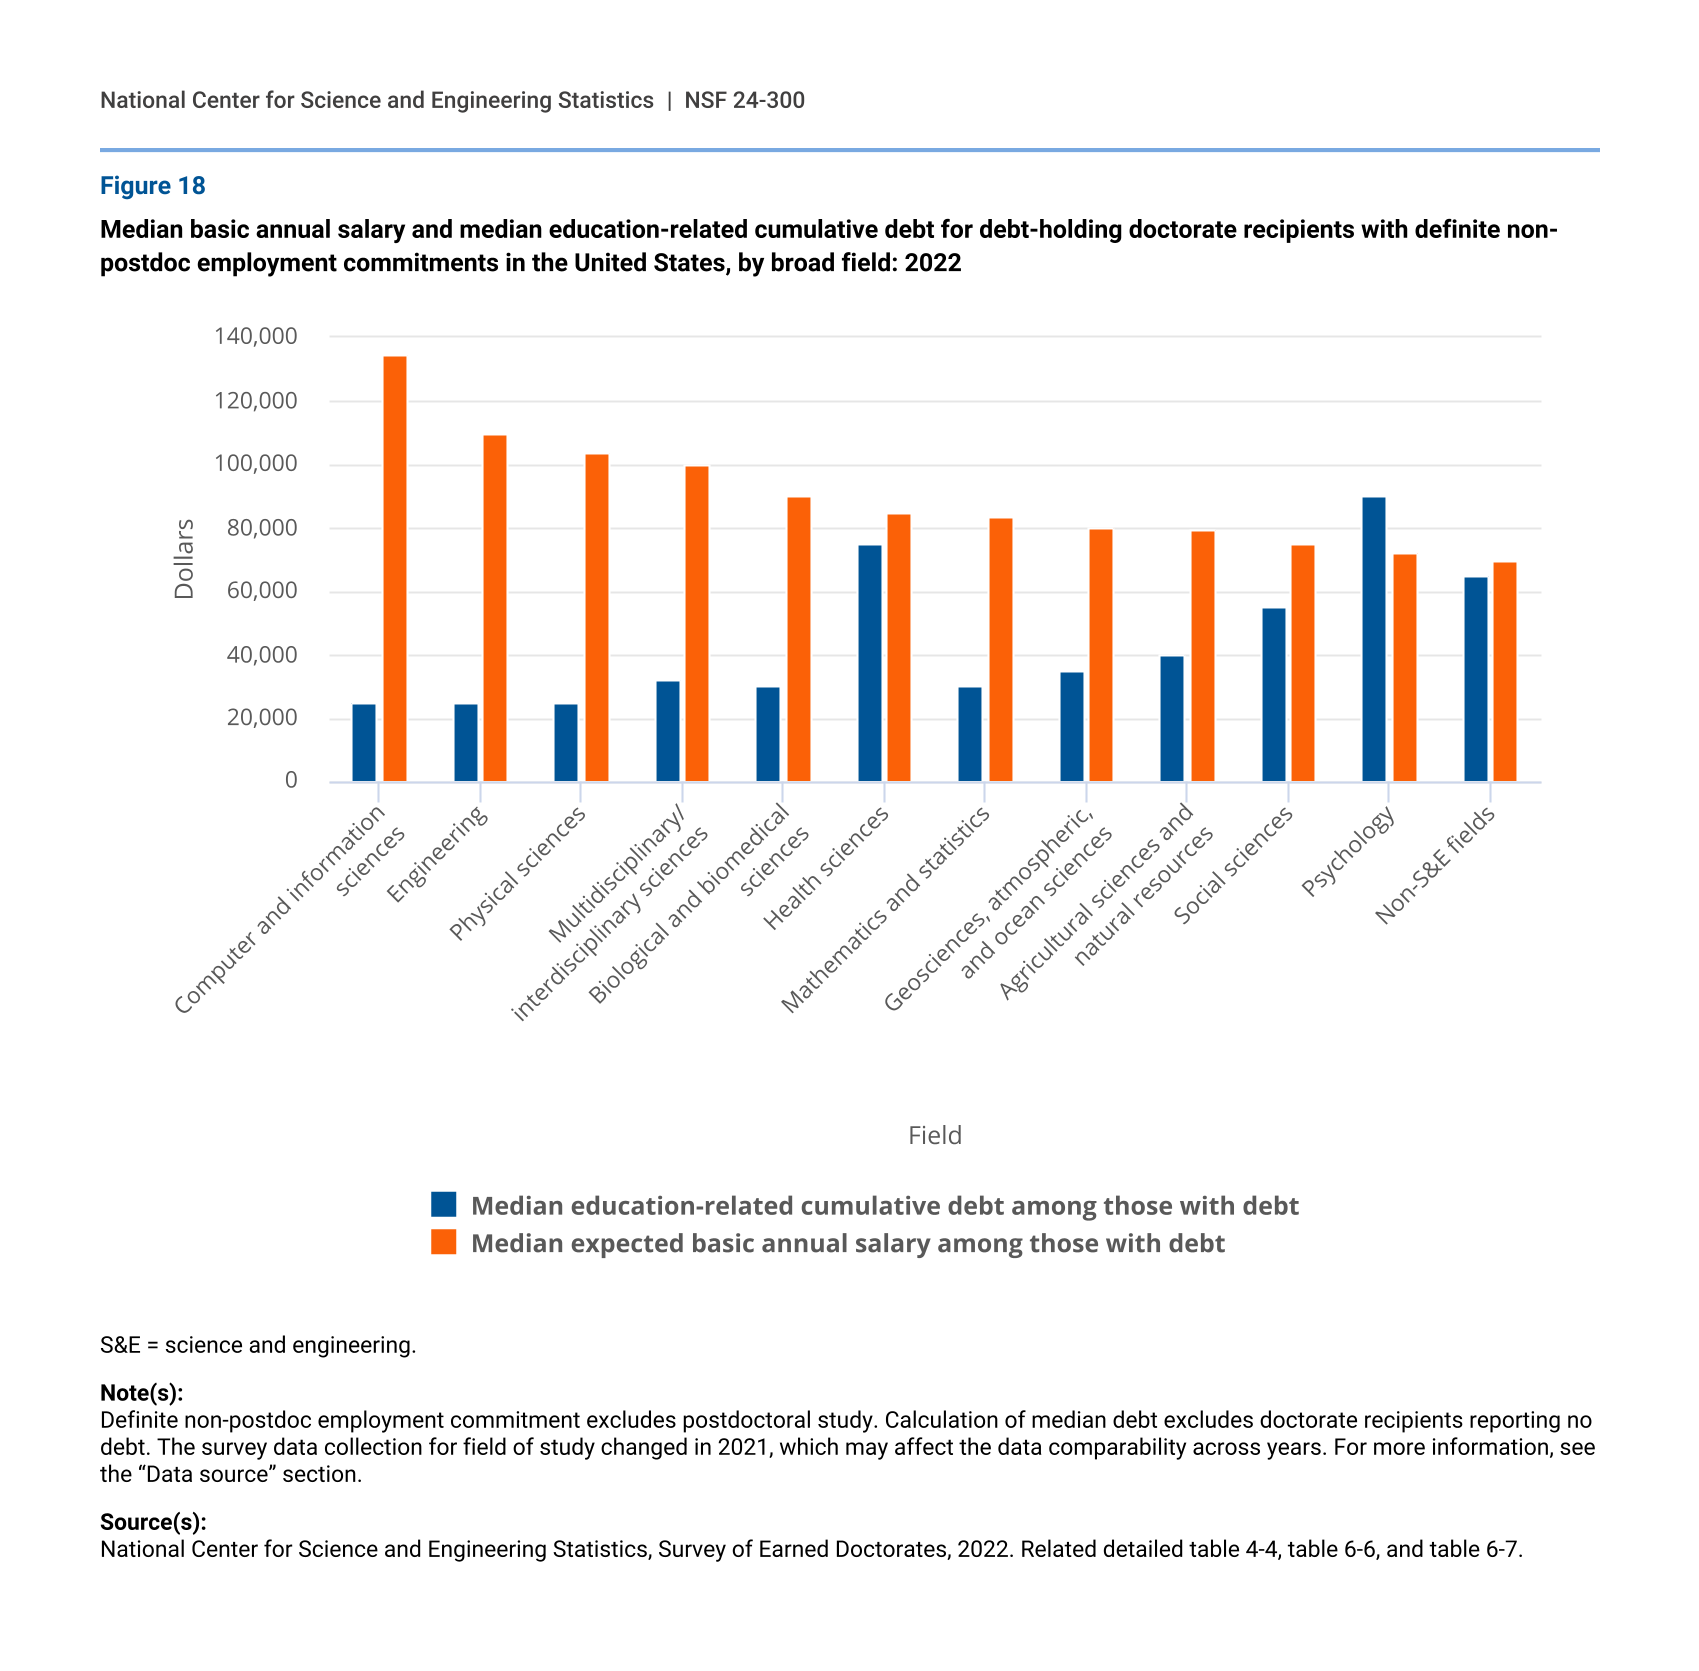
In 2022, doctorate recipients in three of the S&E fields with the lowest median education-related cumulative debt—computer and information sciences, engineering, and physical sciences—had the highest median expected annual salaries. In these fields, median expected salaries at graduation were more than four times the median cumulative debt (figure 18). In contrast, doctorate recipients in psychology and non-S&E fields reported among the lowest median expected annual salaries. In psychology, the median cumulative debt was $18,000 higher than the median expected salary at graduation. In non-S&E fields, the median cumulative debt was $5,000 lower than the median expected salary.
Median basic annual salary and median education-related cumulative debt for debt-holding doctorate recipients with definite non-postdoc employment commitments in the United States, by broad field: 2022
| Field | Median education-related cumulative debt among those with debt | Median expected basic annual salary among those with debt |
|---|---|---|
| Computer and information sciences | 25,000 | 135,000 |
| Engineering | 25,000 | 110,000 |
| Physical sciences | 25,000 | 104,000 |
| Multidisciplinary/ interdisciplinary sciences | 32,500 | 100,000 |
| Biological and biomedical sciences | 30,000 | 90,000 |
| Health sciences | 75,000 | 85,000 |
| Mathematics and statistics | 30,000 | 83,200 |
| Geosciences, atmospheric, and ocean sciences | 35,000 | 80,000 |
| Agricultural sciences and natural resources | 40,000 | 79,500 |
| Social sciences | 55,000 | 75,000 |
| Psychology | 90,000 | 72,000 |
| Non-S&E fields | 65,000 | 70,000 |
S&E = science and engineering.
Note(s):
Definite non-postdoc employment commitment excludes postdoctoral study. Calculation of median debt excludes doctorate recipients reporting no debt. The survey data collection for field of study changed in 2021, which may affect the data comparability across years. For more information, see the “Data source” section.
Time to degree
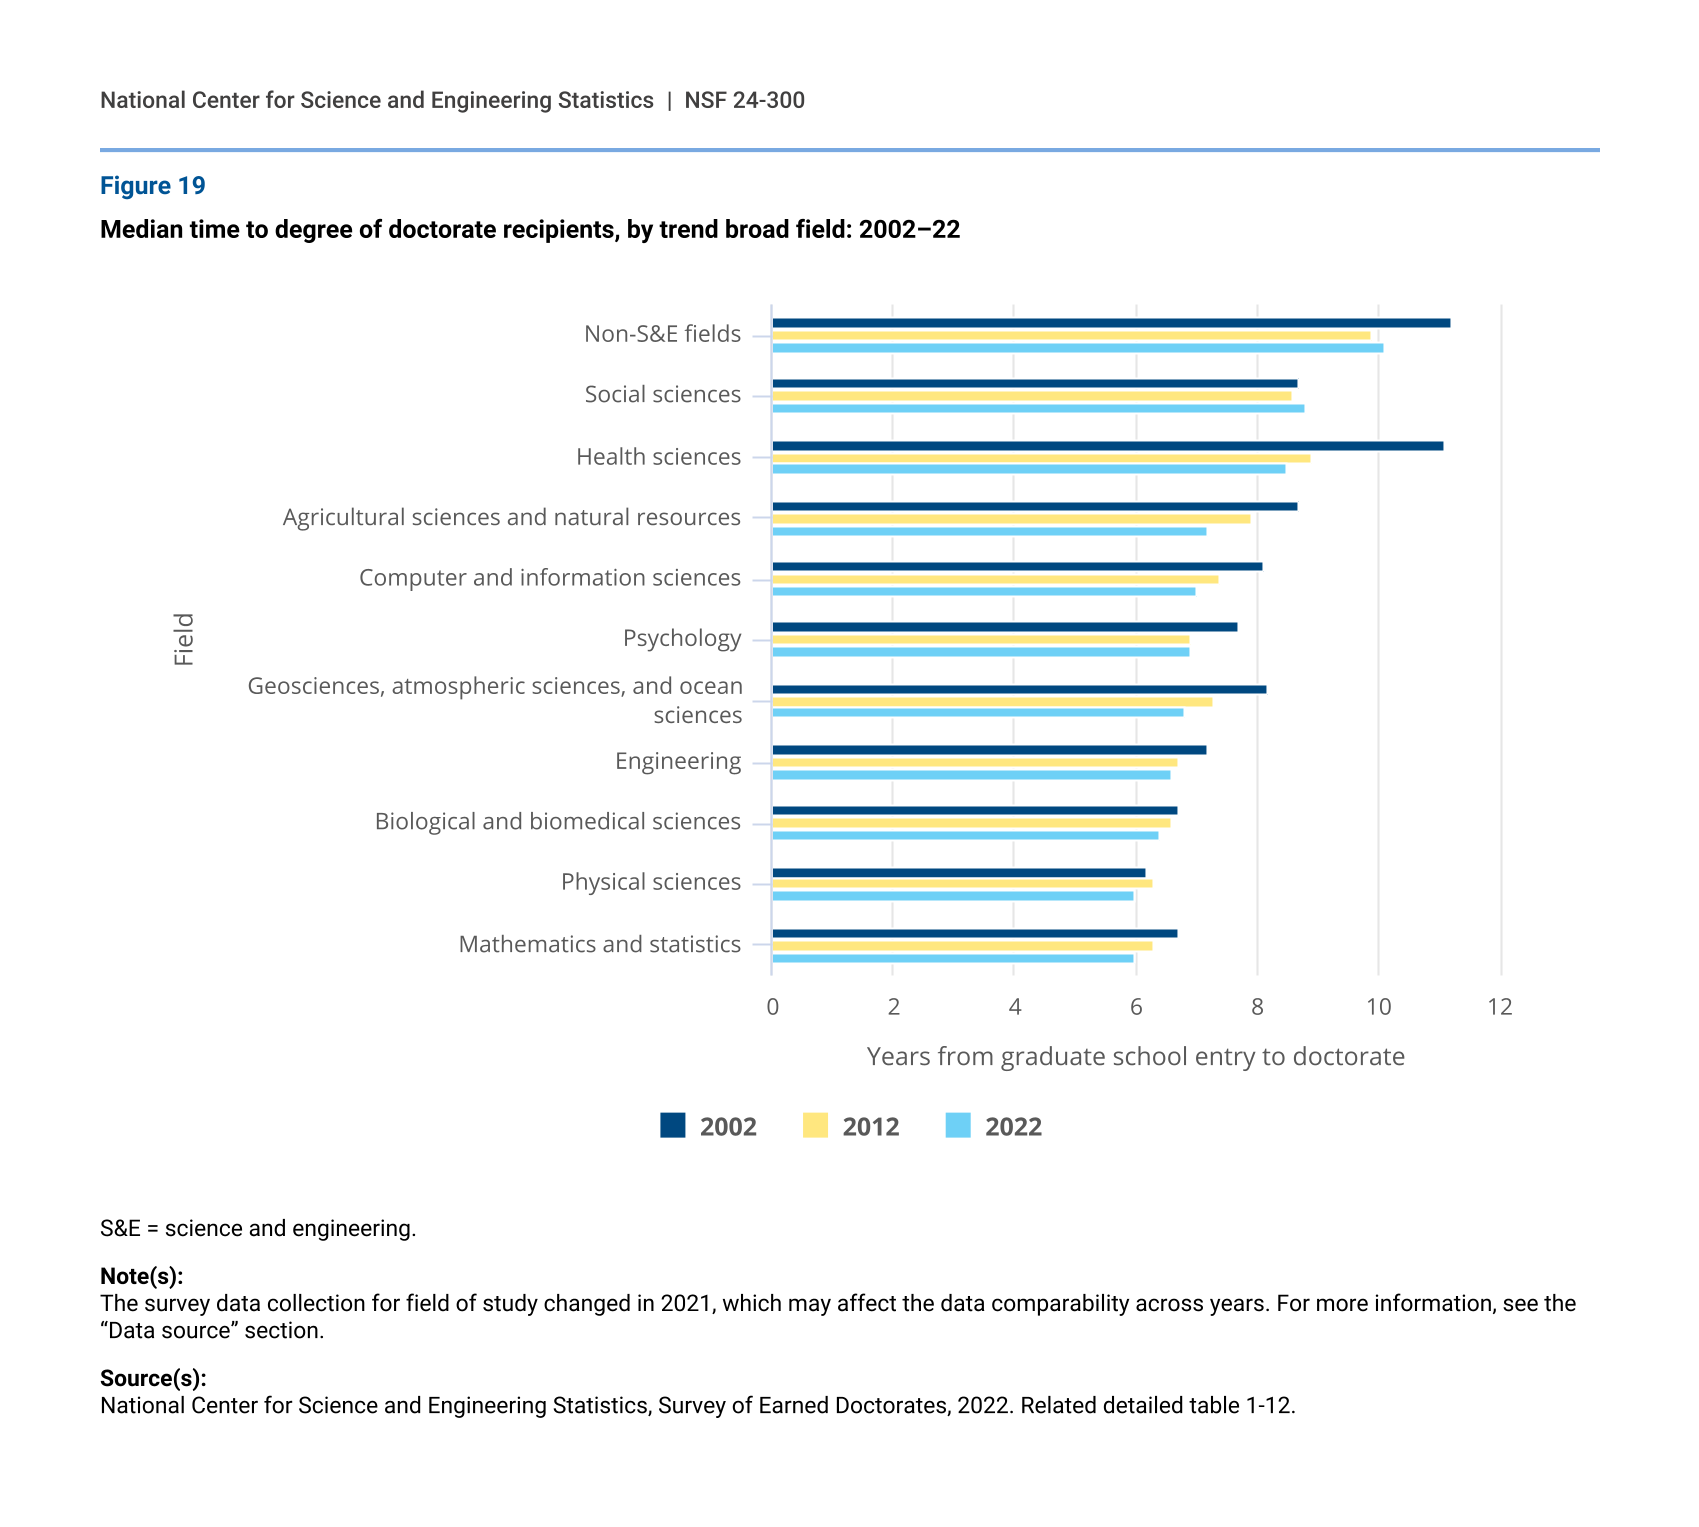
Overall, earning a doctorate in non-S&E fields takes longer than earning an S&E doctorate. In 2022, the longest median time from graduate school entry to doctoral degree in S&E fields was nearly 9 years in both health sciences and social sciences, which was lower than the 10-year median time to doctorate in non-S&E fields (figure 19). Over the past 20 years, median time to doctorate declined the most in health sciences, decreasing by about 2.5 years from 11.1 to 8.5 years, with a greater decline seen between 2002 and 2012 than in the following 10 years. Median time to doctorate in agricultural sciences and natural resources; computer and information sciences; and geosciences, atmospheric sciences, and ocean sciences declined between 1 to 1.5 years over the past 2 decades. Median time to doctorate in psychology; engineering, biological and biomedical sciences; mathematics and statistics; and physical sciences decreased by less than a year over the same time period. Non-S&E fields declined about a year from 11.2 to 10.1 years between 2002 and 2022.
Median time to degree of doctorate recipients, by trend broad field: 2002–22
| Field | 2002 | 2012 | 2022 |
|---|---|---|---|
| Non-S&E fields | 11.2 | 9.9 | 10.1 |
| Social sciences | 8.7 | 8.6 | 8.8 |
| Health sciences | 11.1 | 8.9 | 8.5 |
| Agricultural sciences and natural resources | 8.7 | 7.9 | 7.2 |
| Computer and information sciences | 8.1 | 7.4 | 7.0 |
| Psychology | 7.7 | 6.9 | 6.9 |
| Geosciences, atmospheric sciences, and ocean sciences | 8.2 | 7.3 | 6.8 |
| Engineering | 7.2 | 6.7 | 6.6 |
| Biological and biomedical sciences | 6.7 | 6.6 | 6.4 |
| Physical sciences | 6.2 | 6.3 | 6.0 |
| Mathematics and statistics | 6.7 | 6.3 | 6.0 |
S&E = science and engineering.
Note(s):
The survey data collection for field of study changed in 2021, which may affect the data comparability across years. For more information, see the “Data source” section.
Source(s):
National Center for Science and Engineering Statistics, Survey of Earned Doctorates, 2022. Related detailed table 1-12.