 An official website of the United States government
Report
Field of doctorate
As researchers expand their understanding of the world, new fields of study emerge, and existing fields change. Observing which fields are attracting students can provide early insight into where future research breakthroughs may occur.
Field of doctorate trends
S&E
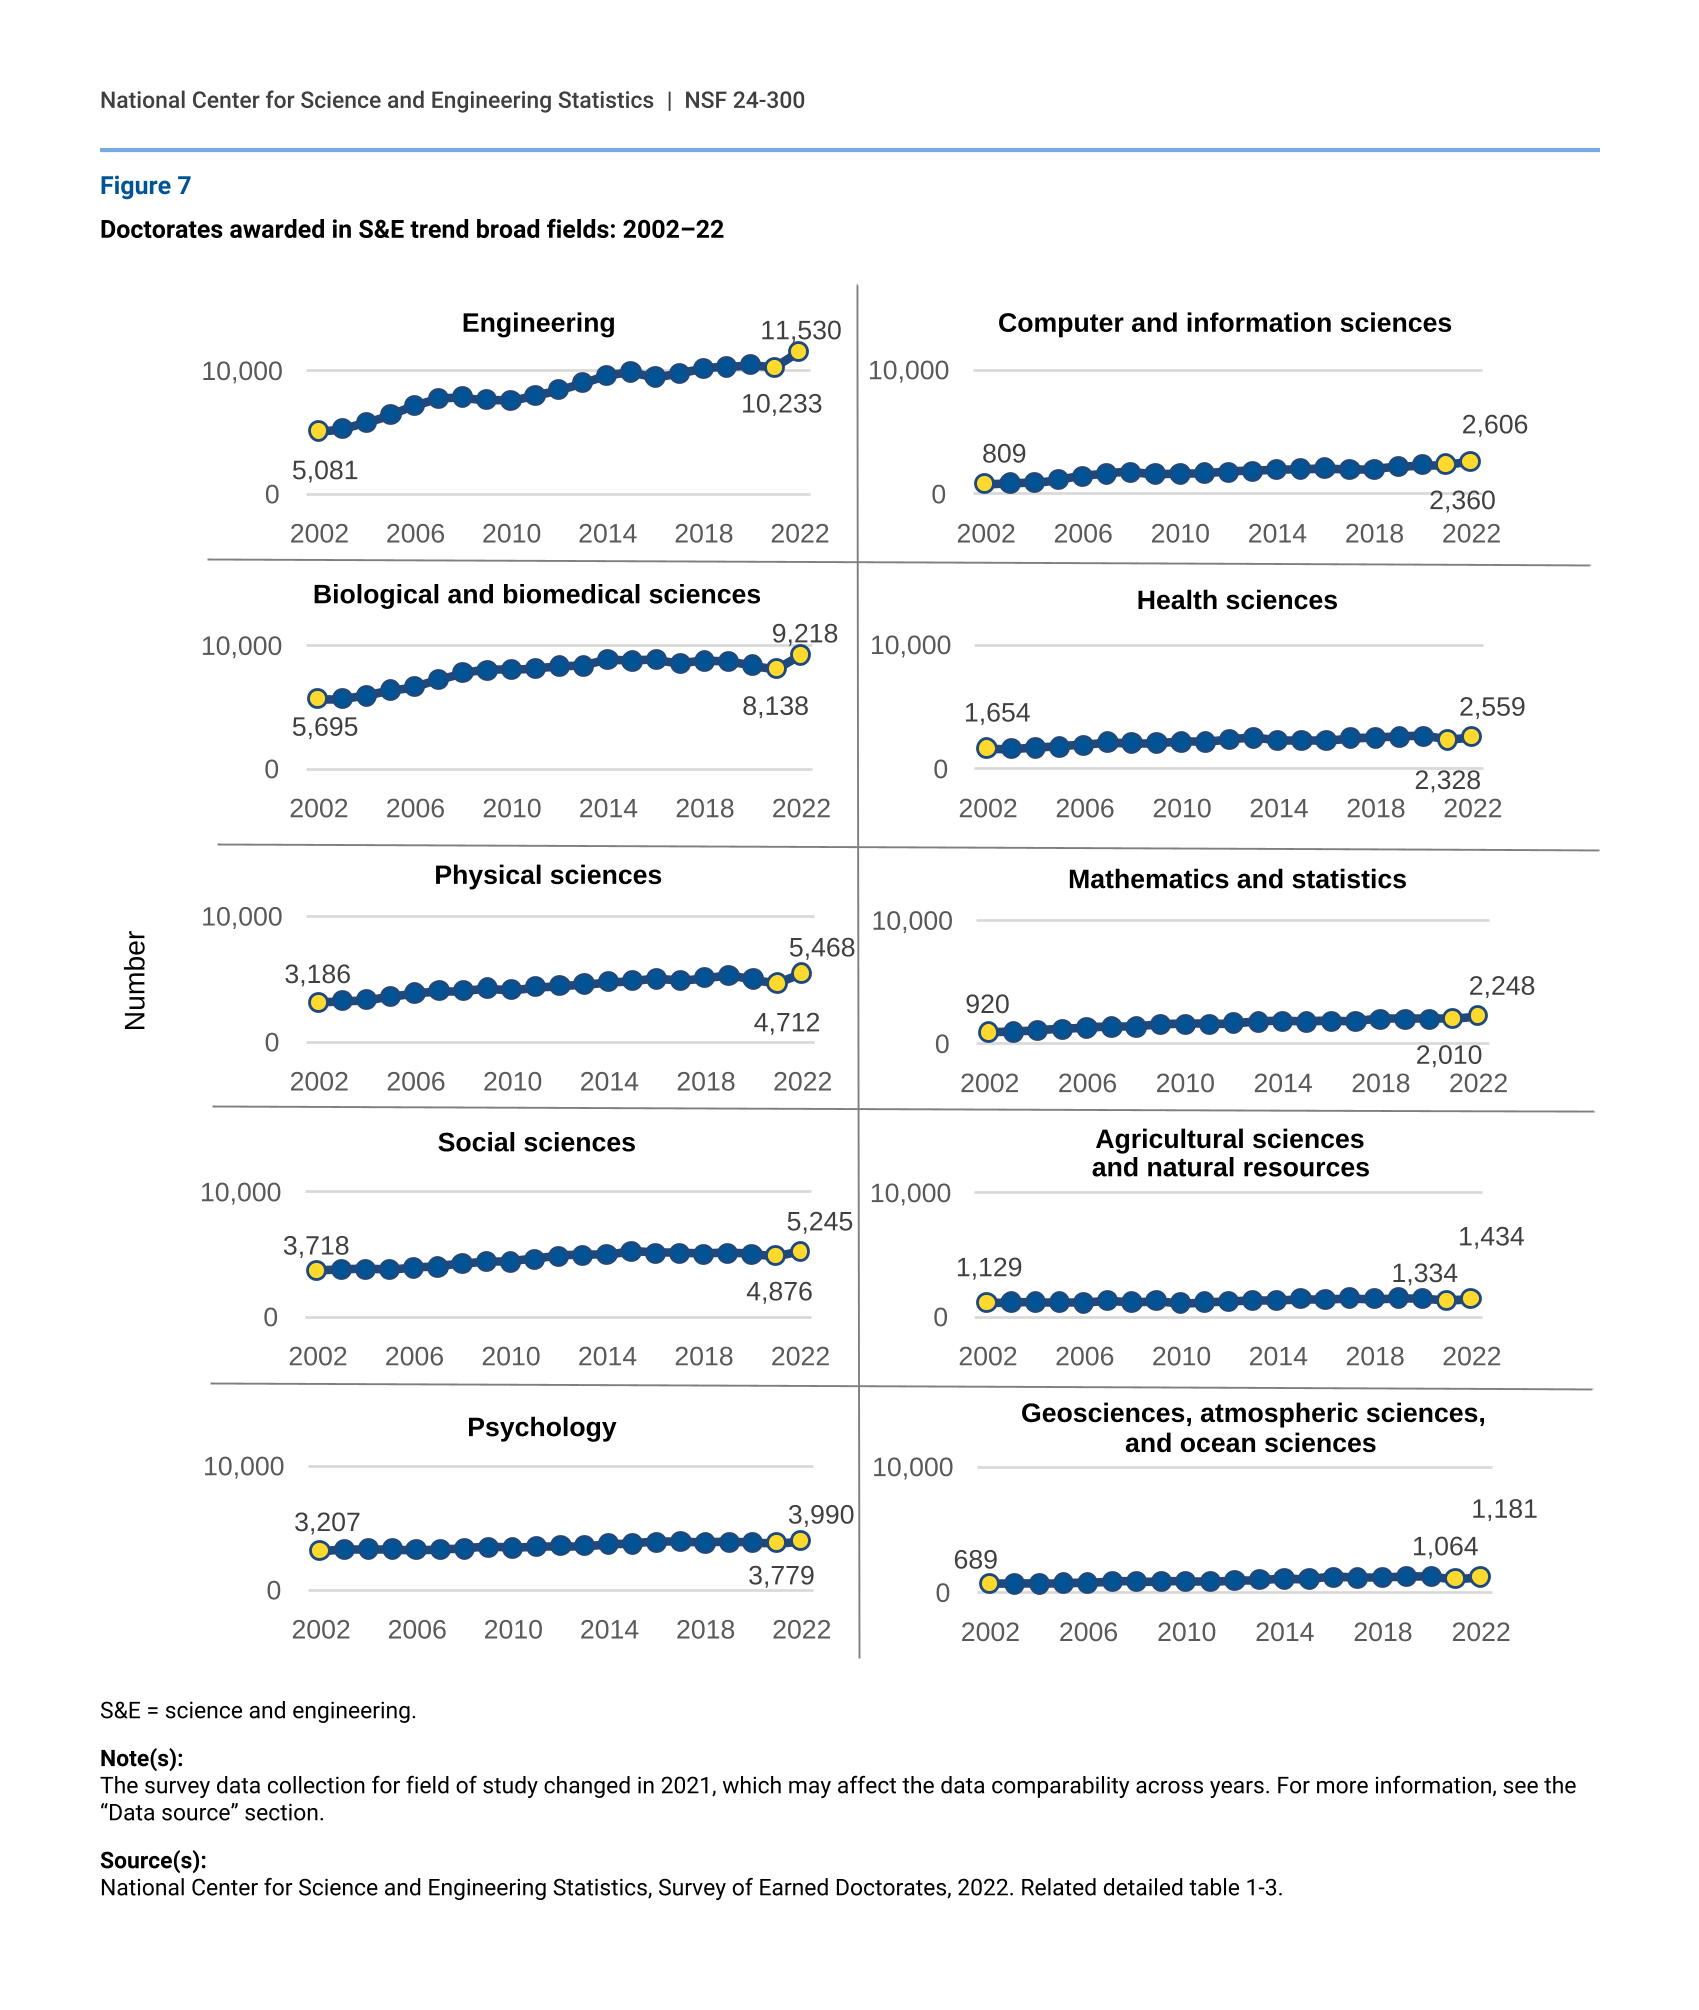
Doctorates in S&E fields are a growing share of all doctorates awarded. Over the past 2 decades, doctorates in every broad S&E field increased in number. However, the fields of psychology, social sciences, and agricultural sciences and natural resources declined slightly in proportion to all doctorates awarded, despite their increase in number. Among S&E fields, engineering grew the most, from 13% of all doctorates in 2002 to 20% in 2022 (figure 1 and figure 7). Between 2021 and 2022, all S&E broad fields grew in the number of doctorate recipients. The S&E fields with the largest increases in doctorate recipients in 2022 were engineering (1,297 or 13% increase from 2021), biological and biomedical sciences (1,080 or 13% increase from 2021), and physical sciences (756 or 16% from 2021).
Non-S&E
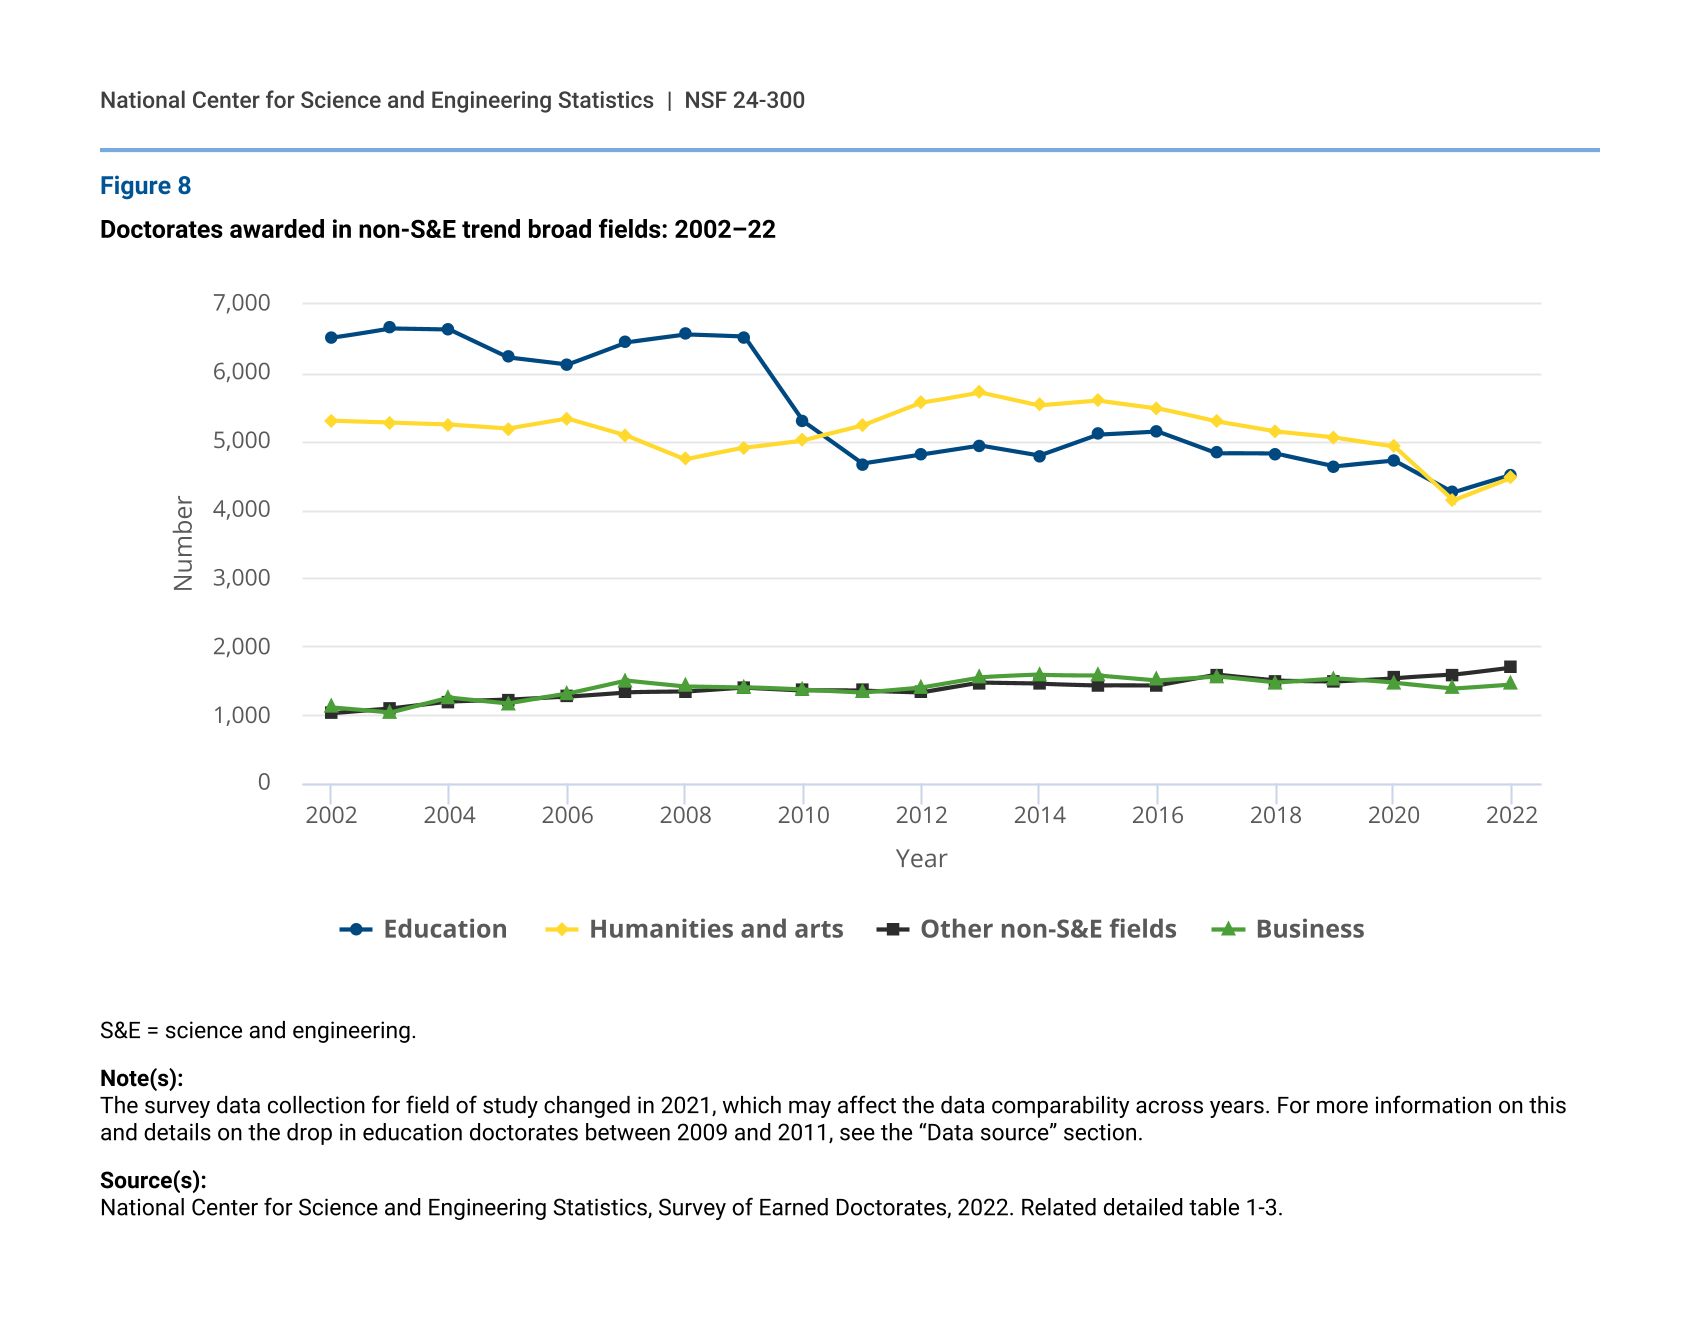
Among non-S&E broad fields in the past 20 years, the number of doctorates awarded in humanities and arts declined while the number in business increased (figure 8). From 2012 to 2022, the number of doctorates declined by 293 in education and 1,097 in humanities and arts. Between 2021 and 2022, the number of doctorates increased in these three fields (humanities and arts by 330, education by 257, and business by 61). However, the increases were not large enough to bring the number of doctorate recipients in these three fields to pre-pandemic levels.
Doctorates awarded in S&E trend broad fields: 2002–22
S&E = science and engineering.
Note(s):
The survey data collection for field of study changed in 2021, which may affect the data comparability across years. For more information, see the “Data source” section.
Source(s):
National Center for Science and Engineering Statistics, Survey of Earned Doctorates, 2022. Related detailed table 1-3.
Doctorates awarded in non-S&E trend broad fields: 2002–22
| Year | Education | Humanities and arts | Other non-S&E fields | Business |
|---|---|---|---|---|
| 2002 | 6,508 | 5,297 | 1,025 | 1,113 |
| 2003 | 6,651 | 5,272 | 1,090 | 1,036 |
| 2004 | 6,635 | 5,245 | 1,192 | 1,256 |
| 2005 | 6,227 | 5,187 | 1,222 | 1,171 |
| 2006 | 6,122 | 5,332 | 1,271 | 1,311 |
| 2007 | 6,448 | 5,085 | 1,335 | 1,506 |
| 2008 | 6,561 | 4,736 | 1,341 | 1,421 |
| 2009 | 6,528 | 4,904 | 1,402 | 1,405 |
| 2010 | 5,287 | 5,015 | 1,363 | 1,366 |
| 2011 | 4,670 | 5,225 | 1,356 | 1,327 |
| 2012 | 4,802 | 5,561 | 1,330 | 1,404 |
| 2013 | 4,934 | 5,715 | 1,472 | 1,551 |
| 2014 | 4,789 | 5,524 | 1,459 | 1,584 |
| 2015 | 5,098 | 5,594 | 1,437 | 1,582 |
| 2016 | 5,146 | 5,482 | 1,432 | 1,509 |
| 2017 | 4,826 | 5,286 | 1,587 | 1,565 |
| 2018 | 4,818 | 5,139 | 1,504 | 1,473 |
| 2019 | 4,633 | 5,051 | 1,494 | 1,533 |
| 2020 | 4,714 | 4,924 | 1,537 | 1,468 |
| 2021 | 4,252 | 4,134 | 1,585 | 1,389 |
| 2022 | 4,509 | 4,464 | 1,694 | 1,450 |
S&E = science and engineering.
Note(s):
The survey data collection for field of study changed in 2021, which may affect the data comparability across years. For more information on this and details on the drop in education doctorates between 2009 and 2011, see the “Data source” section.
Source(s):
National Center for Science and Engineering Statistics, Survey of Earned Doctorates, 2022. Related detailed table 1-3.
Temporary visa holders
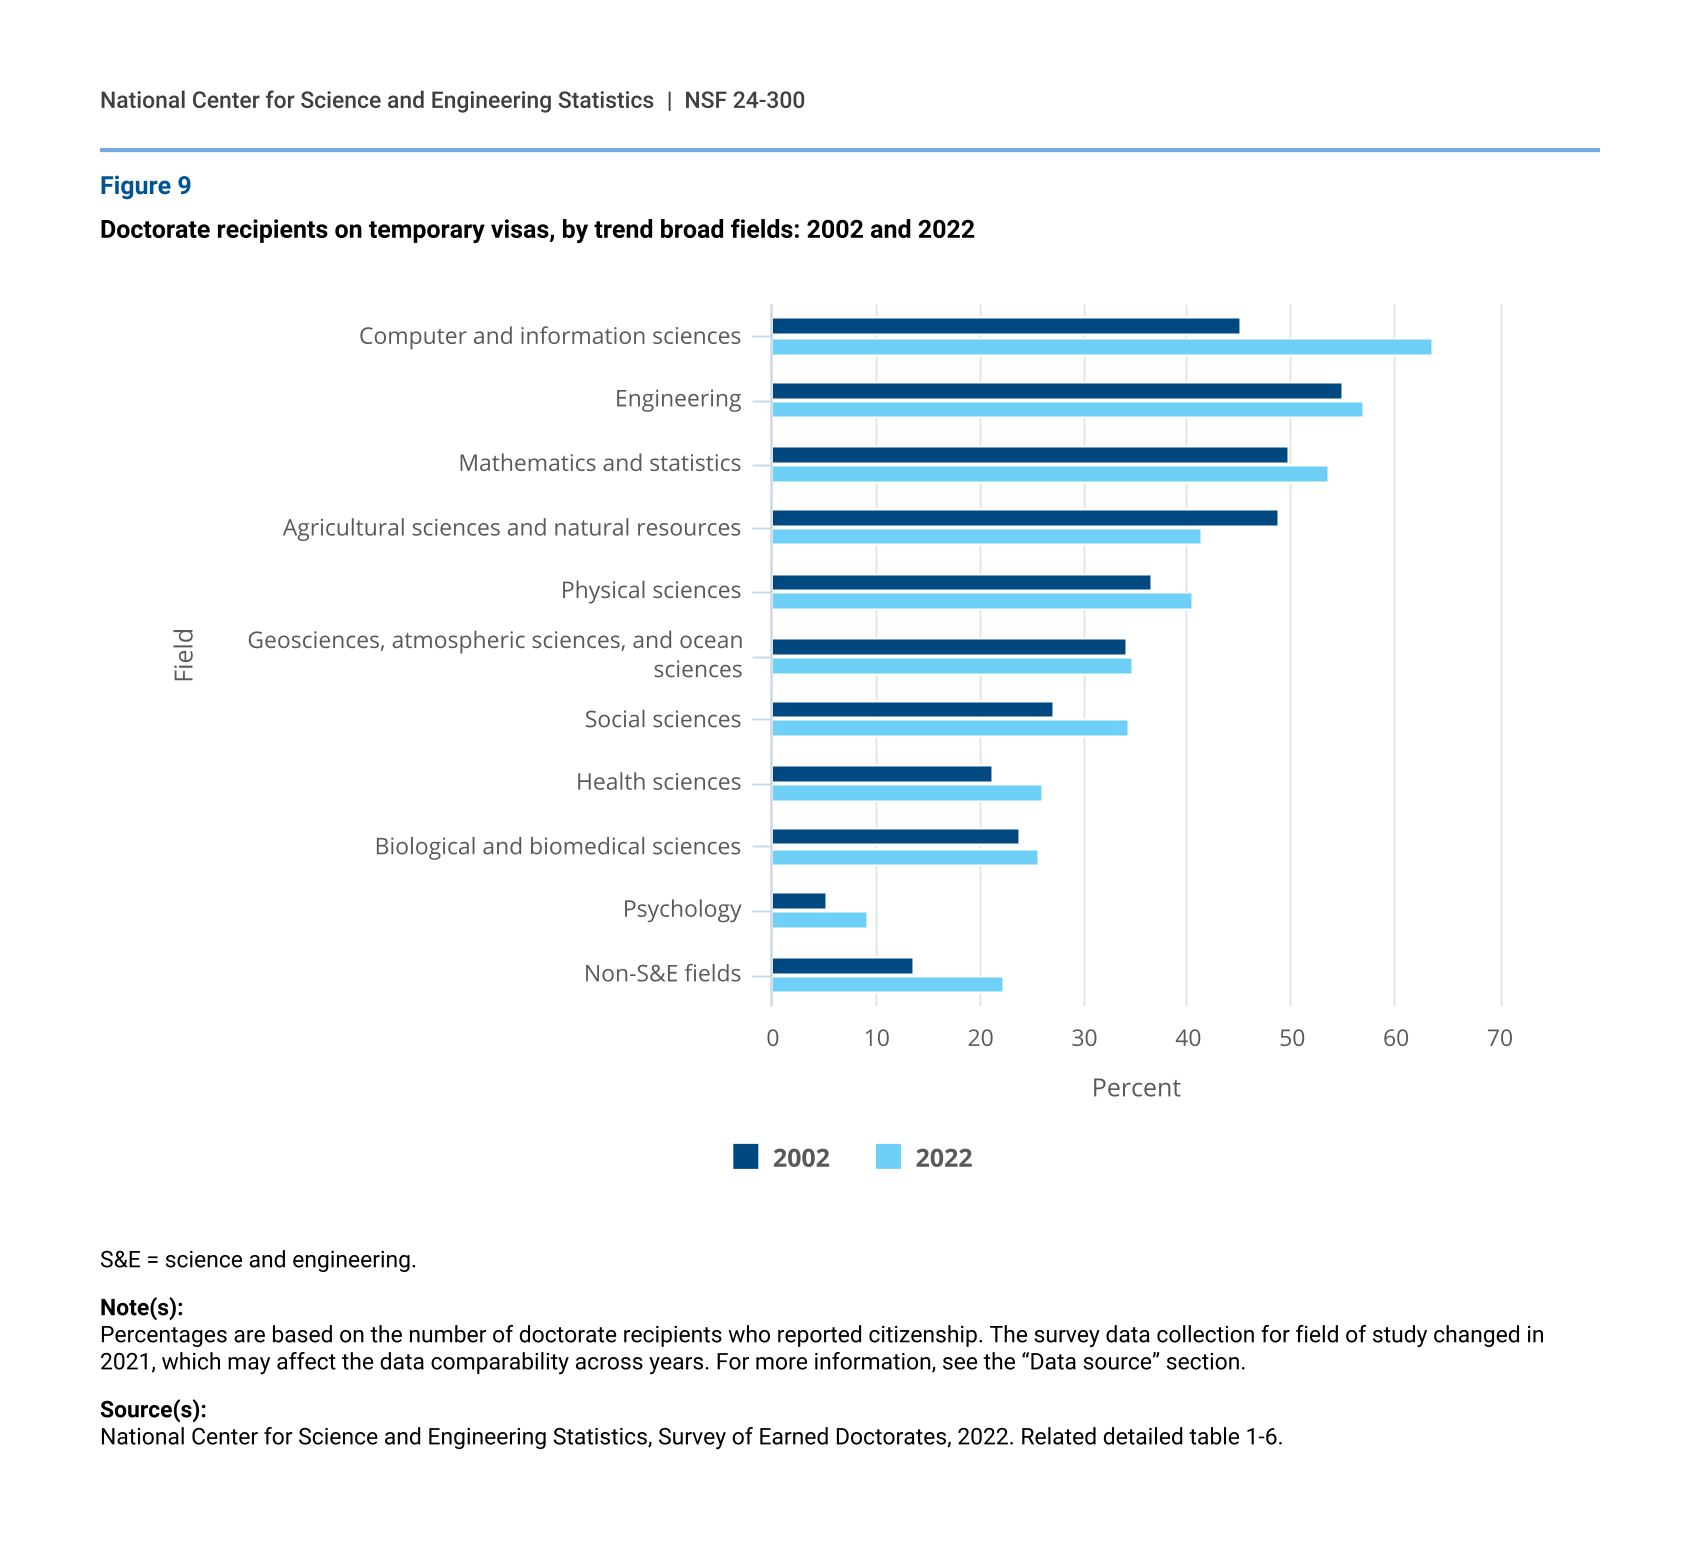
In the past 2 decades, the number of U.S. citizen and permanent resident doctorate recipients increased in every broad field of study except education and humanities and arts, while doctorates awarded to temporary visa holders increased in every broad field. In 2022, temporary visa holders earned the majority of doctorates in computer and information sciences (64%), engineering (57%), and mathematics and statistics (54%) (figure 9). The largest increases in the proportions of temporary visa holders since 2002 were in computer and information sciences, social sciences, and non-S&E broad fields. During this period, the proportion of temporary visa holder doctorate recipients declined in only one broad field—agricultural sciences and natural resources.
Doctorate recipients on temporary visas, by trend broad fields: 2002 and 2022
| Field | 2002 | 2022 |
|---|---|---|
| Computer and information sciences | 45.1 | 63.6 |
| Engineering | 55.0 | 56.9 |
| Mathematics and statistics | 49.8 | 53.5 |
| Agricultural sciences and natural resources | 48.7 | 41.3 |
| Physical sciences | 36.5 | 40.6 |
| Geosciences, atmospheric sciences, and ocean sciences | 34.0 | 34.6 |
| Social sciences | 27.1 | 34.3 |
| Health sciences | 21.3 | 26.1 |
| Biological and biomedical sciences | 23.9 | 25.7 |
| Psychology | 5.3 | 9.3 |
| Non-S&E fields | 13.6 | 22.2 |
S&E = science and engineering.
Note(s):
Percentages are based on the number of doctorate recipients who reported citizenship. The survey data collection for field of study changed in 2021, which may affect the data comparability across years. For more information, see the “Data source” section.
Source(s):
National Center for Science and Engineering Statistics, Survey of Earned Doctorates, 2022. Related detailed table 1-6.
U.S. citizens and permanent residents
While racial and ethnic minorities’ representation in doctoral degrees has increased over time, White recipients still hold the majority of doctoral degrees among U.S. citizens and permanent residents. In 2022, 66% of the 26,408 U.S. citizen and permanent resident doctorate recipients in S&E fields identified as White; 11% identified as Asian, 9% Hispanic or Latino, 6% Black or African American, and 4% as more than one race (table A). The remaining 3% identified as American Indian or Alaska Native, Native Hawaiian or Other Pacific Islander, or did not report their race or ethnicity.
S&E doctorates awarded to U.S. citizens and permanent residents, by race or ethnicity: 2022
S&E = science and engineering.
Note(s):
Percentages may not sum to 100 due to rounding.
Source(s):
National Center for Science and Engineering Statistics, Survey of Earned Doctorates, 2022. Related detailed table 1-11.
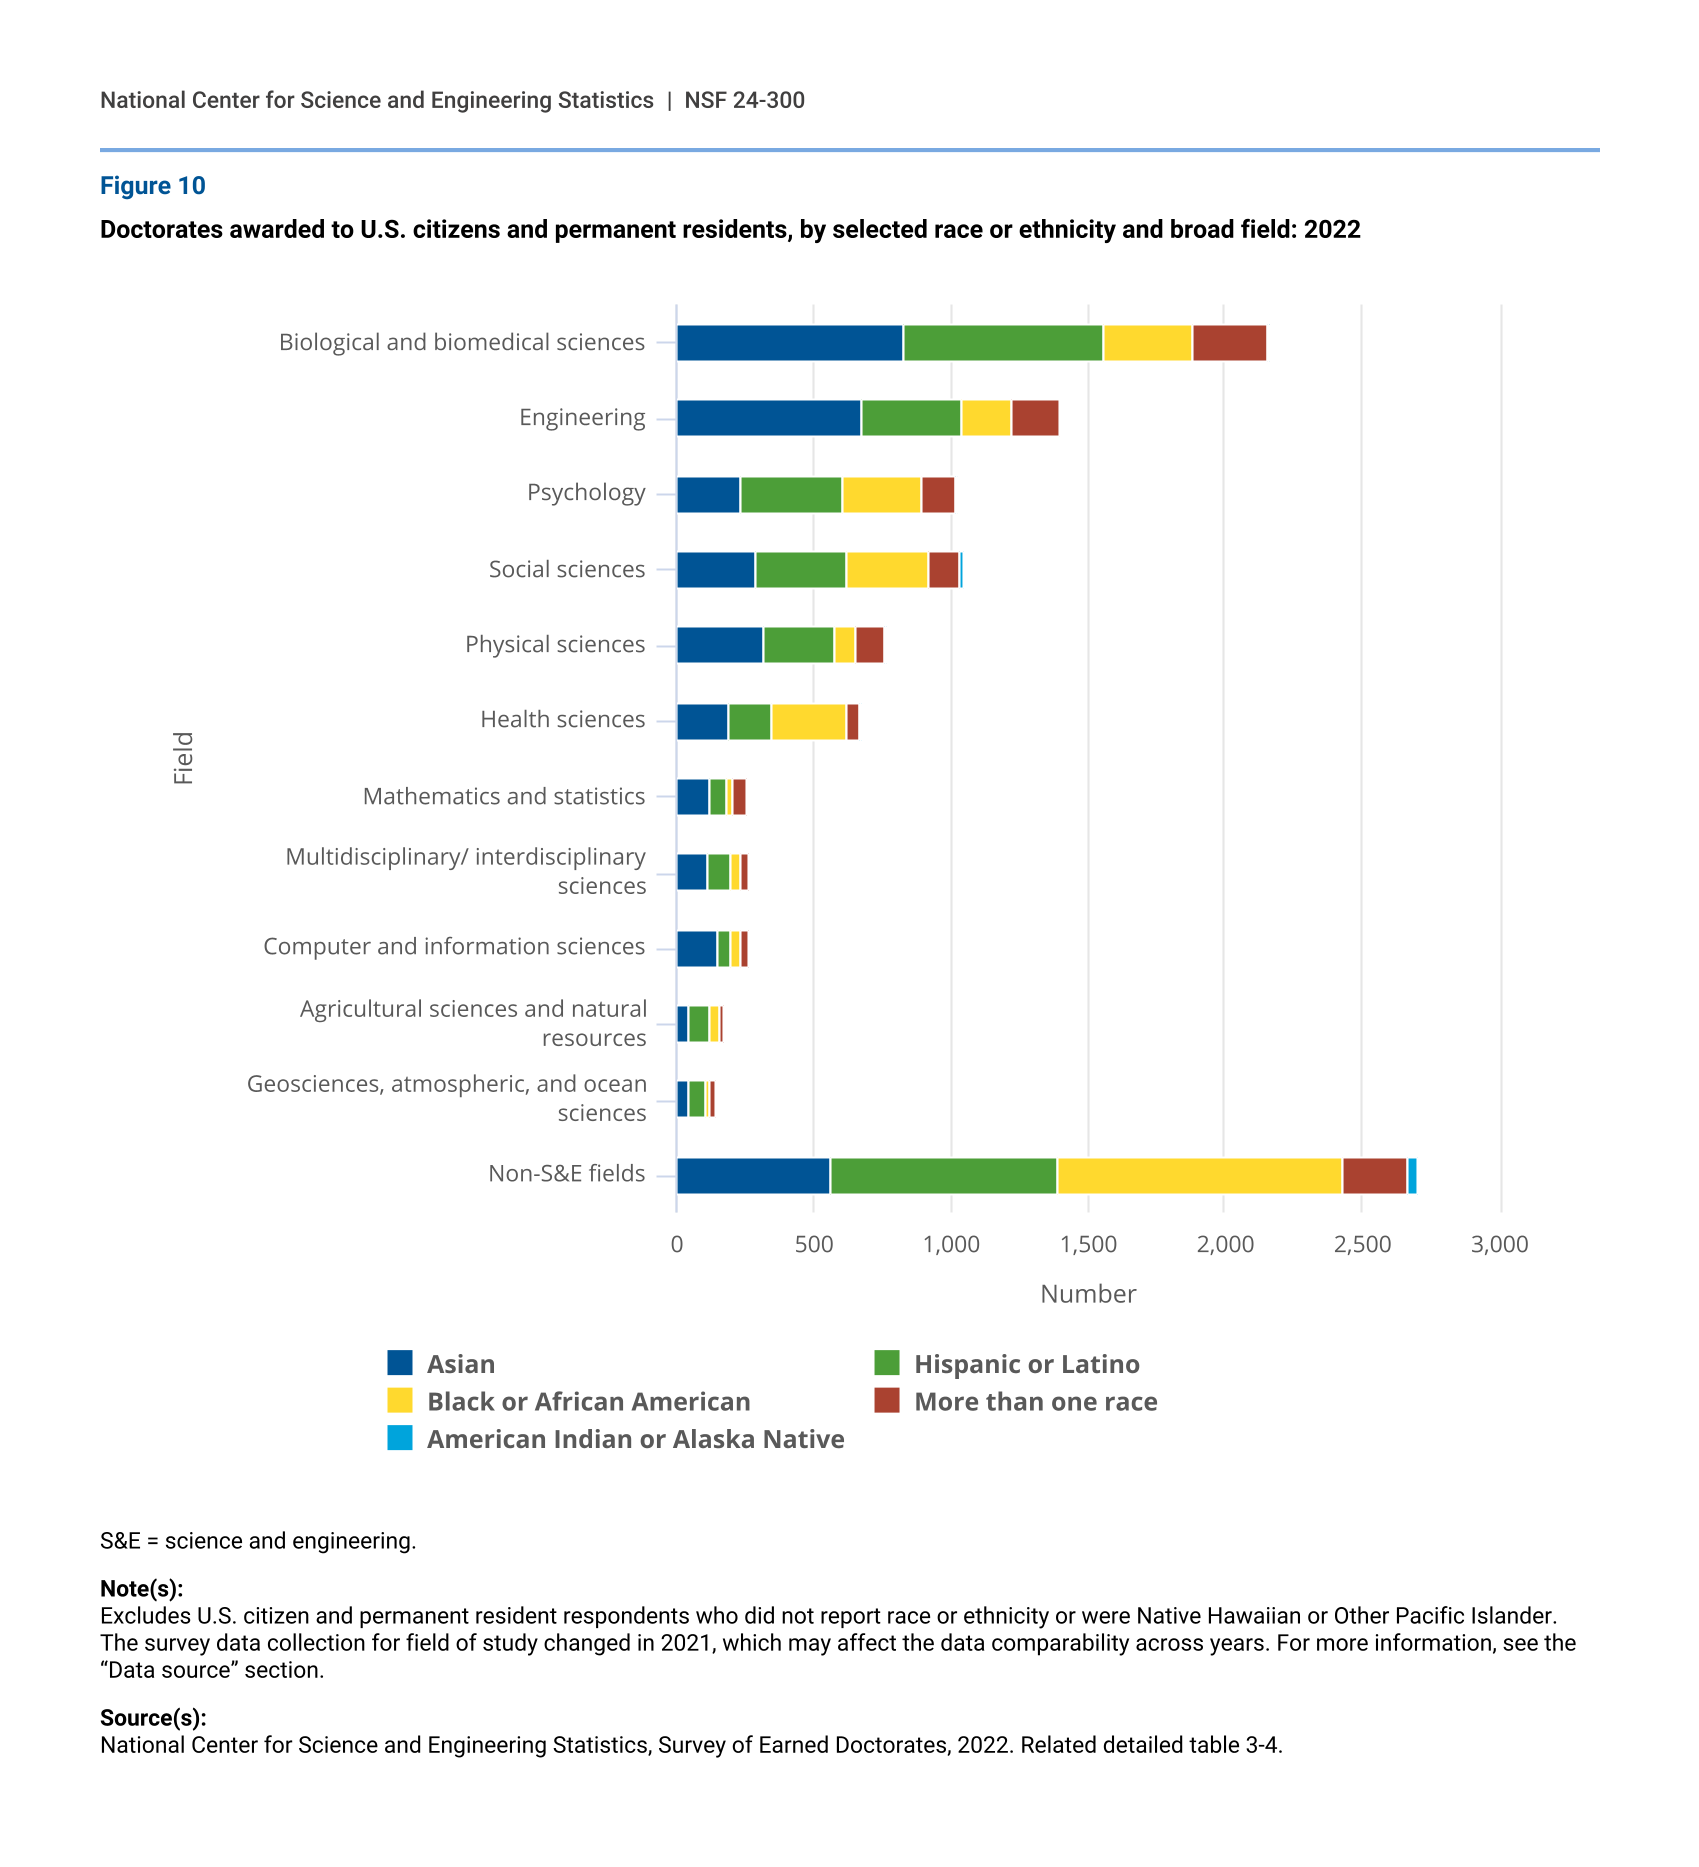
White doctorate recipients accounted for the majority of doctorate recipients in each field, ranging from 64% in computer and information sciences to 80% in geosciences, atmospheric, and ocean sciences. In 2022, Asian doctorate recipients earned a larger share of doctoral degrees than other minority racial and ethnic groups in computer and information sciences, engineering, mathematics and statistics, physical sciences, and biological and biomedical sciences (figure 10). Black or African American doctorate recipients were the largest racial or ethnic minority group in health sciences and non-S&E fields (particularly in education). Hispanic or Latino doctorate recipients were the largest minority group in geosciences, atmospheric, and ocean sciences and in agricultural sciences and natural resources.
Doctorates awarded to U.S. citizens and permanent residents, by selected race or ethnicity and broad field: 2022
| Field | Asian | Hispanic or Latino | Black or African American | More than one race | American Indian or Alaska Native |
|---|---|---|---|---|---|
| Biological and biomedical sciences | 831 | 728 | 321 | 274 | 9 |
| Engineering | 677 | 362 | 187 | 168 | 5 |
| Psychology | 233 | 375 | 288 | 119 | 10 |
| Social sciences | 290 | 335 | 295 | 113 | 17 |
| Physical sciences | 318 | 257 | 81 | 107 | 5 |
| Health sciences | 192 | 156 | 272 | 50 | 4 |
| Mathematics and statistics | 121 | 59 | 26 | 50 | 2 |
| Multidisciplinary/ interdisciplinary sciences | 112 | 82 | 42 | 28 | 1 |
| Computer and information sciences | 153 | 43 | 42 | 25 | 1 |
| Agricultural sciences and natural resources | 48 | 72 | 37 | 17 | 4 |
| Geosciences, atmospheric, and ocean sciences | 46 | 60 | 17 | 22 | 0 |
| Non-S&E fields | 565 | 825 | 1,039 | 237 | 40 |
S&E = science and engineering.
Note(s):
Excludes U.S. citizen and permanent resident respondents who did not report race or ethnicity or were Native Hawaiian or Other Pacific Islander. The survey data collection for field of study changed in 2021, which may affect the data comparability across years. For more information, see the “Data source” section.
Source(s):
National Center for Science and Engineering Statistics, Survey of Earned Doctorates, 2022. Related detailed table 3-4.
Women
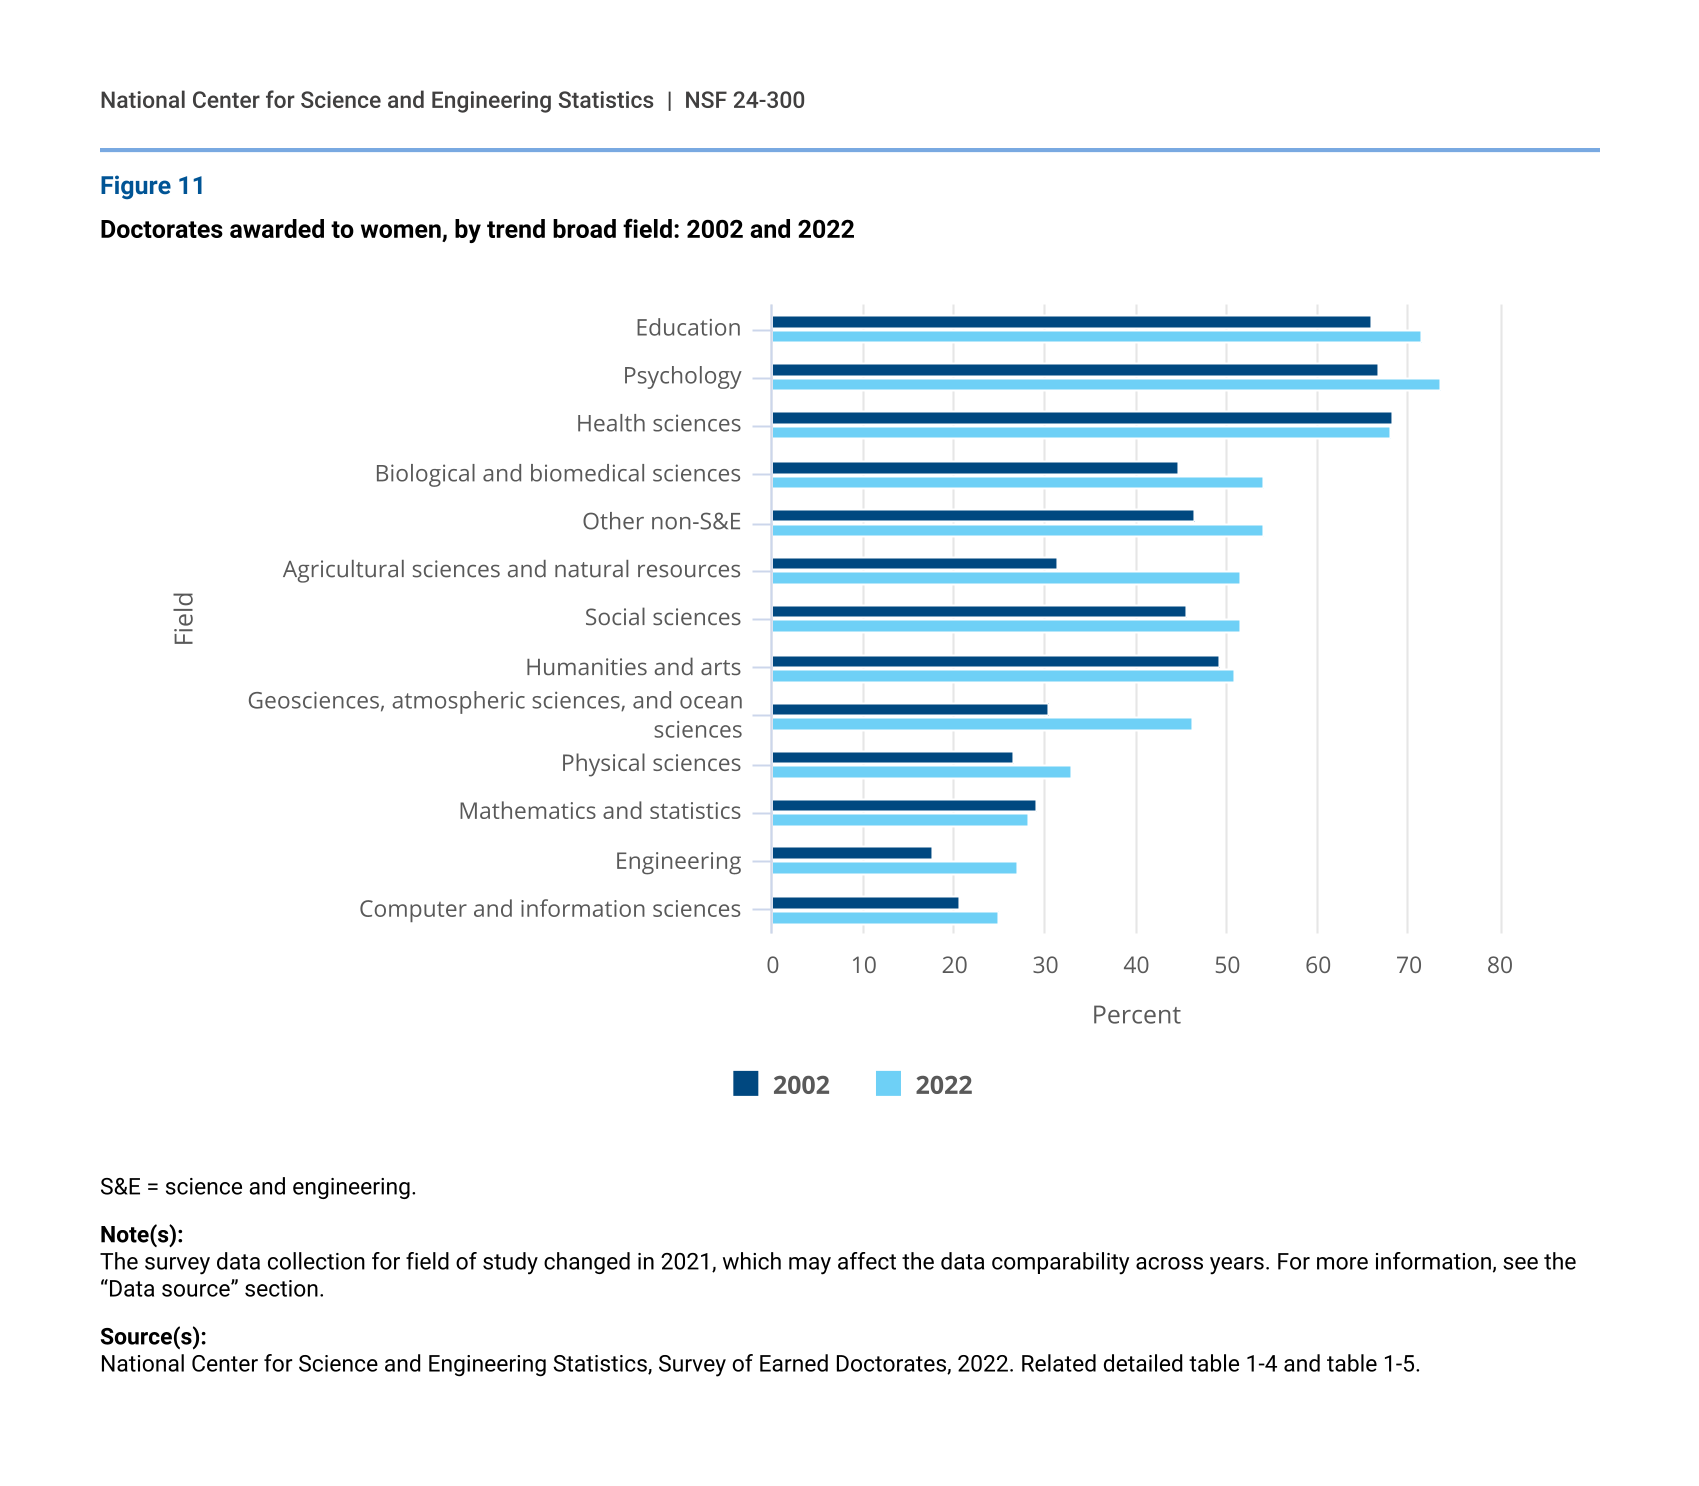
Overview
Women’s share of doctorates has grown over the past 2 decades in most S&E broad fields (figure 11). In 2022, women earned more than half of the doctorates in psychology, health sciences, biological and biomedical sciences, social sciences, agricultural sciences and natural resources, education, humanities and arts, and other non-S&E fields. Women earned between about 25% and 46% of the doctorates awarded in computer and information sciences; engineering; mathematics and statistics; physical sciences; and geosciences, atmospheric, and ocean sciences in 2022. However, women’s shares of doctorates in most of these broad fields have grown over the past 20 years. From 2002 to 2022, the proportion of female doctorates grew between 9 and 20 percentage points in agricultural sciences and natural resources; geosciences, atmospheric sciences, and ocean sciences; biological and biomedical sciences; and engineering. In computer and information sciences, social sciences, physical sciences, and psychology, women’s share in each field grew between 4 and 7 percentage points during this period.
Doctorates awarded to women, by trend broad field: 2002 and 2022
| Field | 2002 | 2022 |
|---|---|---|
| Education | 66.1 | 71.5 |
| Psychology | 66.7 | 73.6 |
| Health sciences | 68.2 | 68.1 |
| Biological and biomedical sciences | 44.7 | 54.2 |
| Other non-S&E | 46.5 | 54.1 |
| Agricultural sciences and natural resources | 31.3 | 51.6 |
| Social sciences | 45.6 | 51.6 |
| Humanities and arts | 49.3 | 50.9 |
| Geosciences, atmospheric sciences, and ocean sciences | 30.6 | 46.3 |
| Physical sciences | 26.6 | 33.0 |
| Mathematics and statistics | 29.0 | 28.3 |
| Engineering | 17.6 | 27.0 |
| Computer and information sciences | 20.7 | 24.9 |
S&E = science and engineering.
Note(s):
The survey data collection for field of study changed in 2021, which may affect the data comparability across years. For more information, see the “Data source” section.
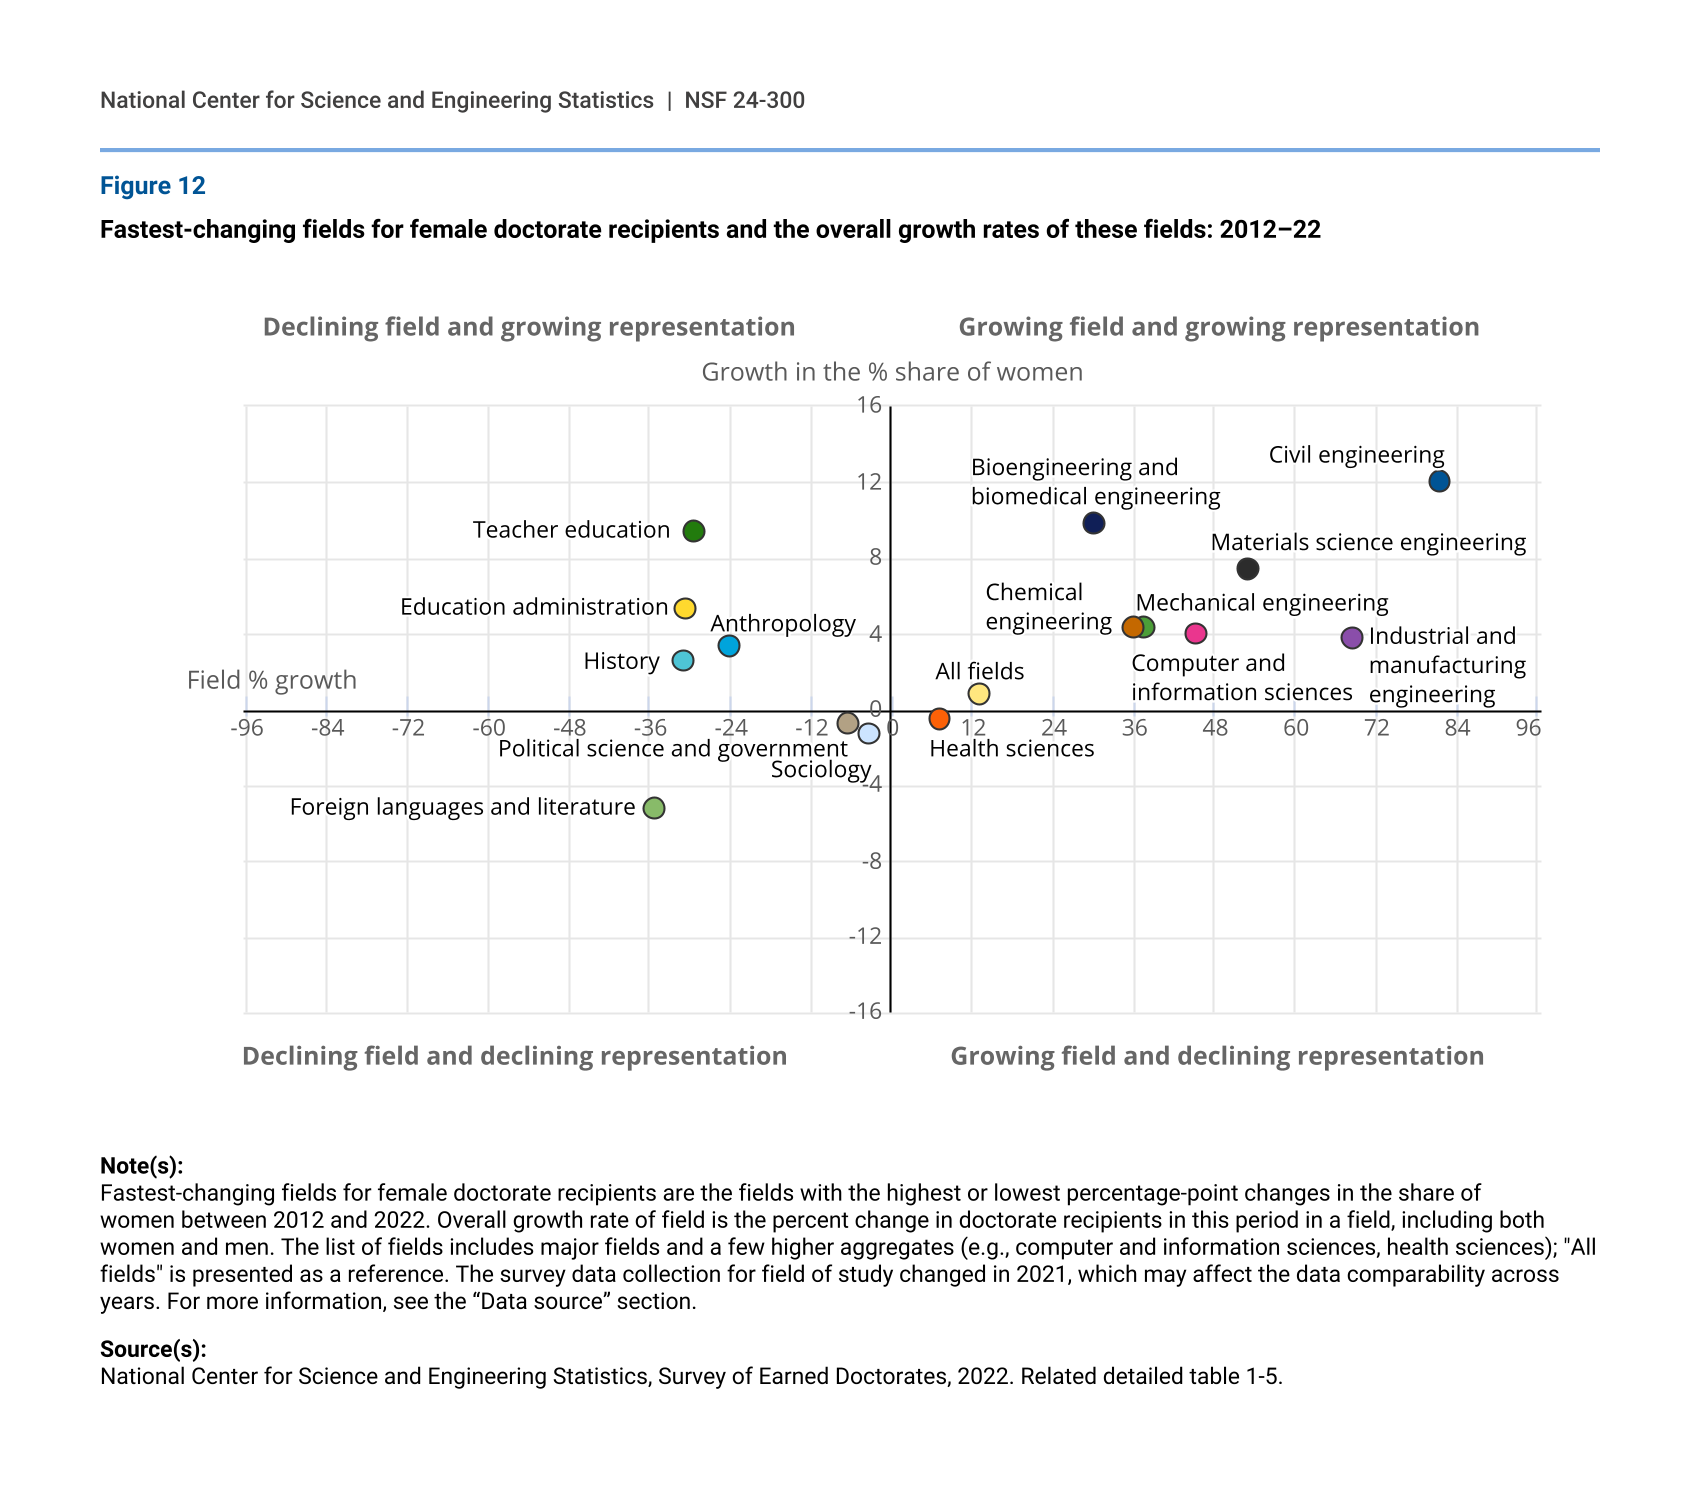
Growing and declining S&E fields
The growth or decline in the share of female doctorate recipients in different fields does not always track with the overall growth in those fields. Between 2012 and 2022, the number of doctorate recipients in all fields increased by 13% while the share of women increased by 0.8 percentage points (figure 12). From 2012 to 2022, the proportion of female doctorate recipients increased between 4 and 12 percentage points in the seven top growing fields (fields that grew 30% or more during these 10 years): civil engineering, bioengineering and biomedical engineering, material sciences engineering, mechanical engineering, chemical engineering, computer and information sciences, and industrial and manufacturing engineering. Women’s share of doctorates also increased between 3 and 9 percentage points in teacher education, education administration, anthropology, and history—fields in which the overall number of doctorates awarded declined between 25% and 30% during this 10-year period. Despite the growth of doctorate recipients in health sciences by 7% in the past 10 years, women’s shares of doctorates declined by about 1 percentage point. The proportion of female doctorate recipients also declined in foreign languages and literature, political science and government, and sociology—fields in which the overall number of doctorates declined as well.
Fastest-changing fields for female doctorate recipients and the overall growth rates of these fields: 2012–22
| Field | Growth in the % share of women | Field % growth |
|---|---|---|
| Civil engineering | 12 | 81.4 |
| Bioengineering and biomedical engineering | 9.8 | 30.2 |
| Teacher education | 9.4 | -29.5 |
| Materials science engineering | 7.4 | 52.9 |
| Education administration | 5.3 | -30.6 |
| Mechanical engineering | 4.3 | 37.4 |
| Chemical engineering | 4.3 | 36 |
| Computer and information sciences | 4 | 45.3 |
| Industrial and manufacturing engineering | 3.8 | 68.6 |
| Anthropology | 3.3 | -24.1 |
| History | 2.6 | -30.9 |
| All fields | 0.8 | 13.1 |
| Health sciences | -0.5 | 7.2 |
| Political science and government | -0.7 | -6.4 |
| Sociology | -1.3 | -3.5 |
| Foreign languages and literature | -5.2 | -35.4 |
Note(s):
Fastest-changing fields for female doctorate recipients are the fields with the highest or lowest percentage-point changes in the share of women between 2012 and 2022. Overall growth rate of field is the percent change in doctorate recipients in this period in a field, including both women and men. The list of fields includes major fields and a few higher aggregates (e.g., computer and information sciences, health sciences); "All fields" is presented as a reference. The survey data collection for field of study changed in 2021, which may affect the data comparability across years. For more information, see the “Data source” section.
Source(s):
National Center for Science and Engineering Statistics, Survey of Earned Doctorates, 2022. Related detailed table 1-5.