 An official website of the United States government
 Knowledge Transfer Indicators: Making Information Available
As described in the previous Invention Indicators: Protecting Useful Ideas section, the output of R&D, both formal and informal, includes scientific knowledge, inventions (i.e., new and useful processes, machines, manufactures, or compositions of matter, or any new and useful improvements thereof), and innovations, which are new products or processes that have been made available to potential users or brought into use (OECD Eurostat 2018). Knowledge transfer is broader and more diverse. It encompasses the many activities whereby newly created knowledge is shared with those who can apply it, develop it, or transform it into new outputs, inventions, and innovations. The institutional performers of R&D activity are covered in detail in the forthcoming Indicators report “Research and Development: U.S. Trends and International Comparisons” and the Indicators report “Academic Research and Development.” Knowledge transfer also includes transfer between individuals, transfer from one organization to another, and transfer to new fields of study and domains of application.
The transformative role of knowledge transfer is illustrated in Image INV-1 (see Introduction section). The processes by which knowledge becomes embodied in new inventions, and inventions are transformed into innovations, are nonlinear and proceed through multiple directions. New insights on the natural world emerge from successful and unsuccessful attempts to transform new scientific knowledge into inventions. Similarly, the work required to bring new products and processes to market often leads to refinements that themselves qualify as new inventions.
Knowledge embedded in technology constitutes a special case of knowledge transfer often referred to as technology transfer. Indicators discussed in this chapter include both the narrower case of technology transfer and the broader category of knowledge transfer. Although businesses conduct the largest share of U.S. R&D, academic institutions and federal labs are also key contributors to knowledge creation (see forthcoming Indicators report “Research and Development: U.S. Trends and International Comparisons”) and knowledge transfer.
Both formal R&D and informal activities conducted by organizations and individuals produce new knowledge. That knowledge can be transferred through the dissemination of the information embedded in documented R&D outputs, such as publications, patents, and software; through direct organization-to-organization interaction and collaboration; and via direct and tacit interaction among individuals. Most knowledge transfer indicators described in this report directly measure the operation of these transfer mechanisms. Coauthorship of research publications across business, academia, and government is used to assess the transfer of knowledge across sectors. Citations to the peer-reviewed scientific literature appearing in patents provide evidence of the application of scientific knowledge to invention and highlight knowledge transfer between universities and businesses.
In addition to its contribution to indicators based on published research, the role of academia in knowledge transfer is assessed via the licensing by businesses of university-owned patents. Several indicators highlight the role of the federal government in knowledge transfer. These include: (1) invention disclosures made by, patents granted to, and licenses granted by federal government entities; (2) cooperative R&D agreements between federal laboratories and one or more nonfederal organizations; and (3) the open-source licensing of software created for government use.
Startup companies that form based on the licensing of university technology represent a particularly important form of knowledge transfer: they signal the active commercial use of new knowledge and overlap with those described above. In addition to the formal licensed use of technology, knowledge transfer can play an indirect role as startups draw on newly created knowledge to provide the basis for their commercial activities. Indicators related to startups include general U.S. startup formation and employment trends and financial support of startups through the SBIR and STTR programs.
Business Collaborations in Published Literature
All parties benefit when business, academia, and government agencies collaborate. Through collaboration, the participants gain access to advanced tools, emerging technologies, unpublished or private data, and technical expertise. An indicator of such collaborations is the authorship data of peer-reviewed publications in the Scopus database. Scopus is an abstract and citation database of scholarly literature provided by Elsevier Publishing. Peer-reviewed publications by business authors have become more collaborative over time, although fewer in number. One indication of the high impact of collaborations on the progress of science and engineering (S&E) is the greater than average citation of articles with authors from multiple sectors versus those with authors from a single sector or institution (Shneiderman 2018).
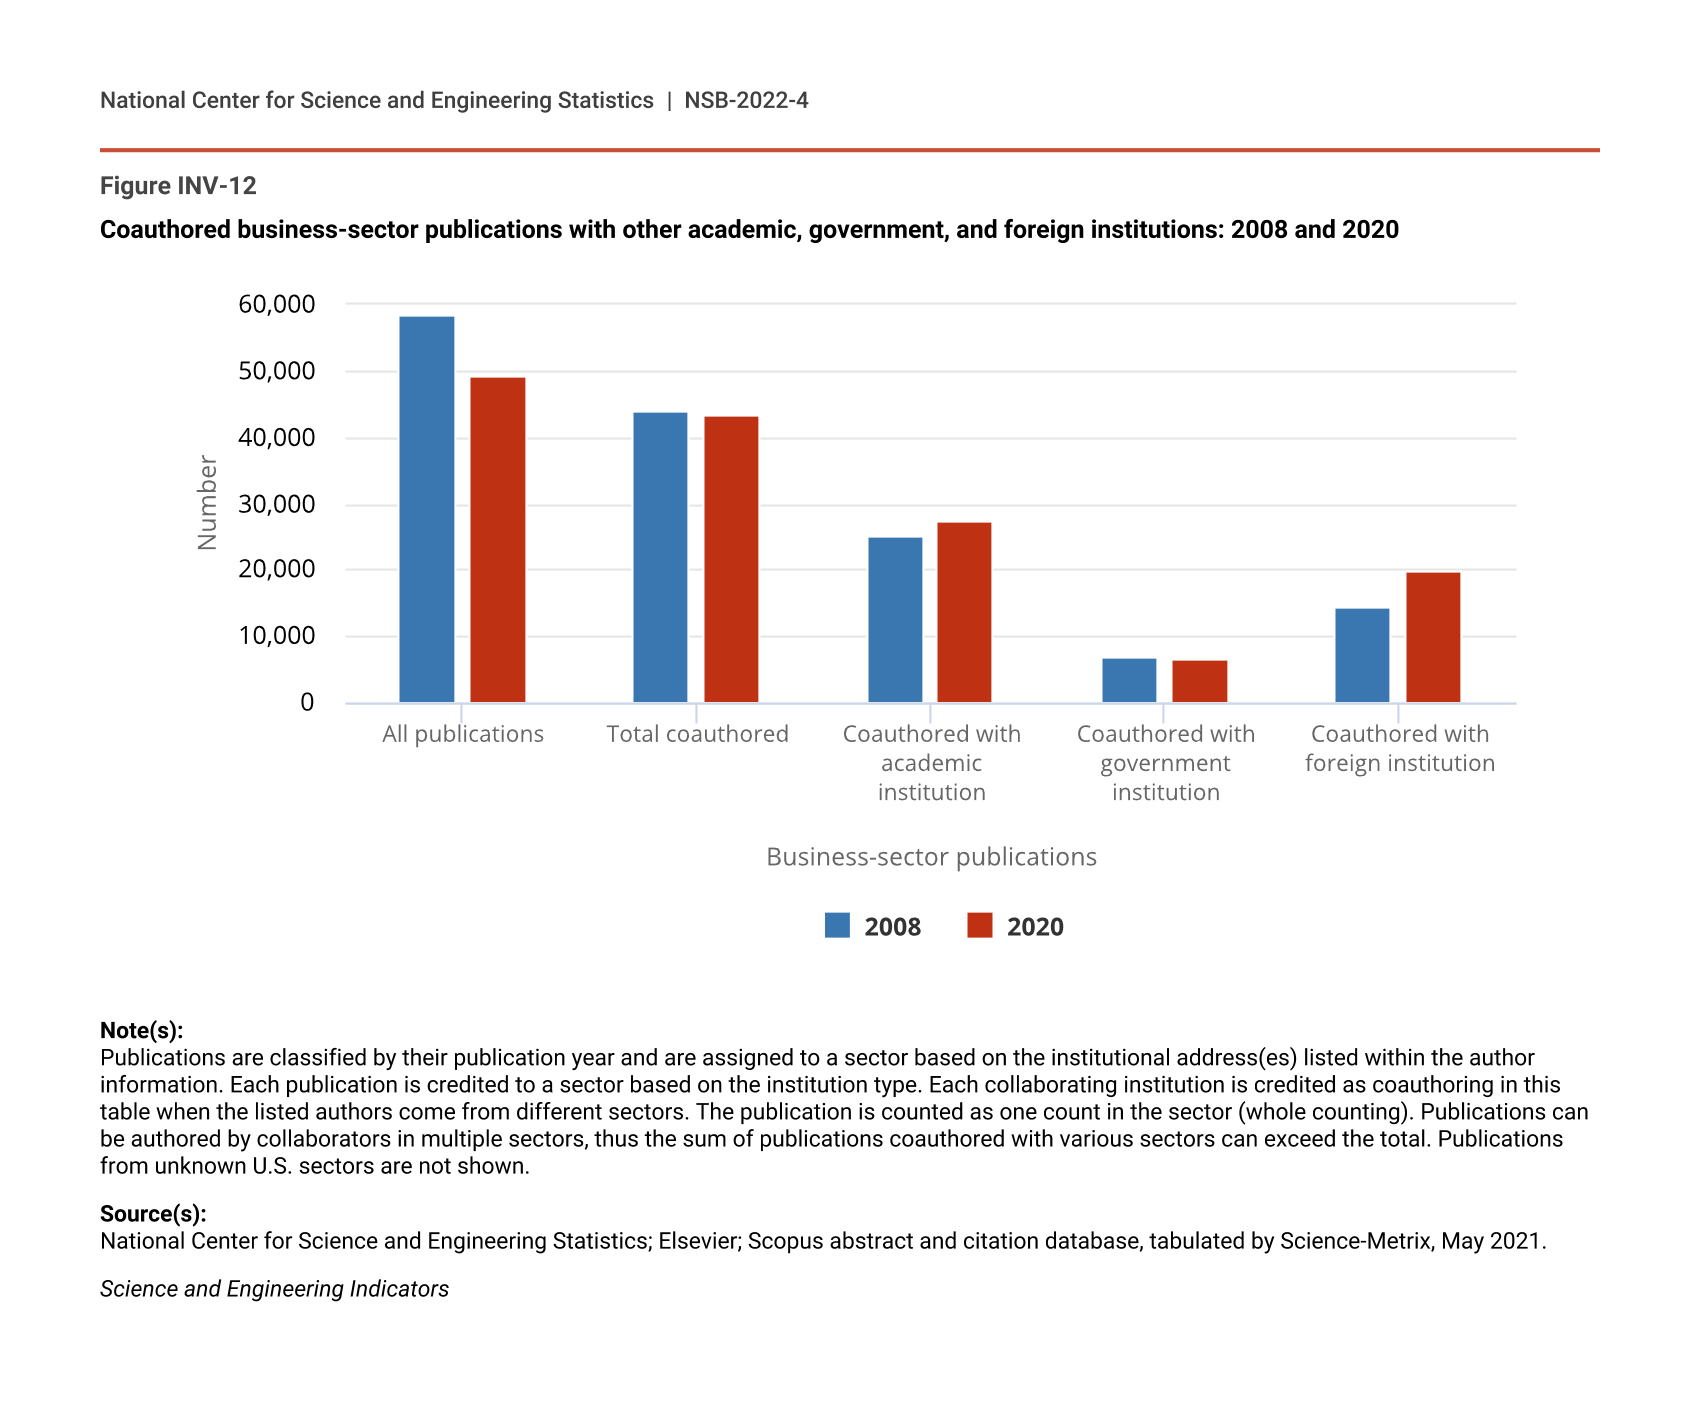
Authors with U.S. business affiliations published 49,000 peer-reviewed publications in 2020, based on the Scopus publications output data reported in the Indicators report “Publications Output: U.S. Trends and International Comparisons.” The total number of peer-reviewed publications in that year with a U.S. address was almost half a million (456,000). Almost 90% (43,203) of business-authored publications were coauthored with authors from other institutions, including other businesses, up from 75% in 2008 (Figure INV-12). Business-authored publications are increasingly coauthored with U.S. academic researchers, the share increasing from 43% (25,112) in 2008 to 56% (27,475) in 2020 (Figure INV-12). Collaboration between the federal government and business represent a relatively small portion of the coauthored publications in 2020 at 13% (6,563) (Figure INV-12).
Coauthored business-sector publications with other academic, government, and foreign institutions: 2008 and 2020
| Business-sector publications | 2008 | 2020 |
|---|---|---|
| All publications | 58,403 | 49,208 |
| Total coauthored | 43,959 | 43,203 |
| Coauthored with academic institution | 25,112 | 27,475 |
| Coauthored with government institution | 6,780 | 6,563 |
| Coauthored with foreign institution | 14,336 | 19,884 |
Note(s):
Publications are classified by their publication year and are assigned to a sector based on the institutional address(es) listed within the author information. Each publication is credited to a sector based on the institution type. Each collaborating institution is credited as coauthoring in this table when the listed authors come from different sectors. The publication is counted as one count in the sector (whole counting). Publications can be authored by collaborators in multiple sectors, thus the sum of publications coauthored with various sectors can exceed the total. Publications from unknown U.S. sectors are not shown.
Source(s):
National Center for Science and Engineering Statistics; Elsevier; Scopus abstract and citation database, tabulated by Science-Metrix, May 2021.
Science and Engineering Indicators
Business-authored publications are also increasingly coauthored with international authors, a trend reflected in the overall increase of international collaboration in peer-reviewed literature (NSB 2021a). Among the business-coauthored publications, this category of cooperation grew the most. From 2008 to 2020, the number and proportion of publications coauthored between U.S. businesses and foreign collaborators increased, reaching 40% (19,884) in 2020 (Figure INV-12). Publications, citations, and collaborations in peer-reviewed literature are covered in greater depth in the Indicators report “Publications Output: U.S. Trends and International Comparisons.”
Publications Cited in Patents
When peer-reviewed publications like those described above are cited in patent documents, the linkage between the two documents provides an indicator of knowledge transfer from the scientific literature to the patent. These indicators show the disproportionately large role of academic publications in patent citations, pointing to the importance of academic research in invention. Data for peer-reviewed publications are from the Scopus database used in the Indicators report “Publications Output: U.S. Trends and International Comparisons.” The same taxonomy of disciplines for fields of science and classification of sectors that produce publications from that report are used here.
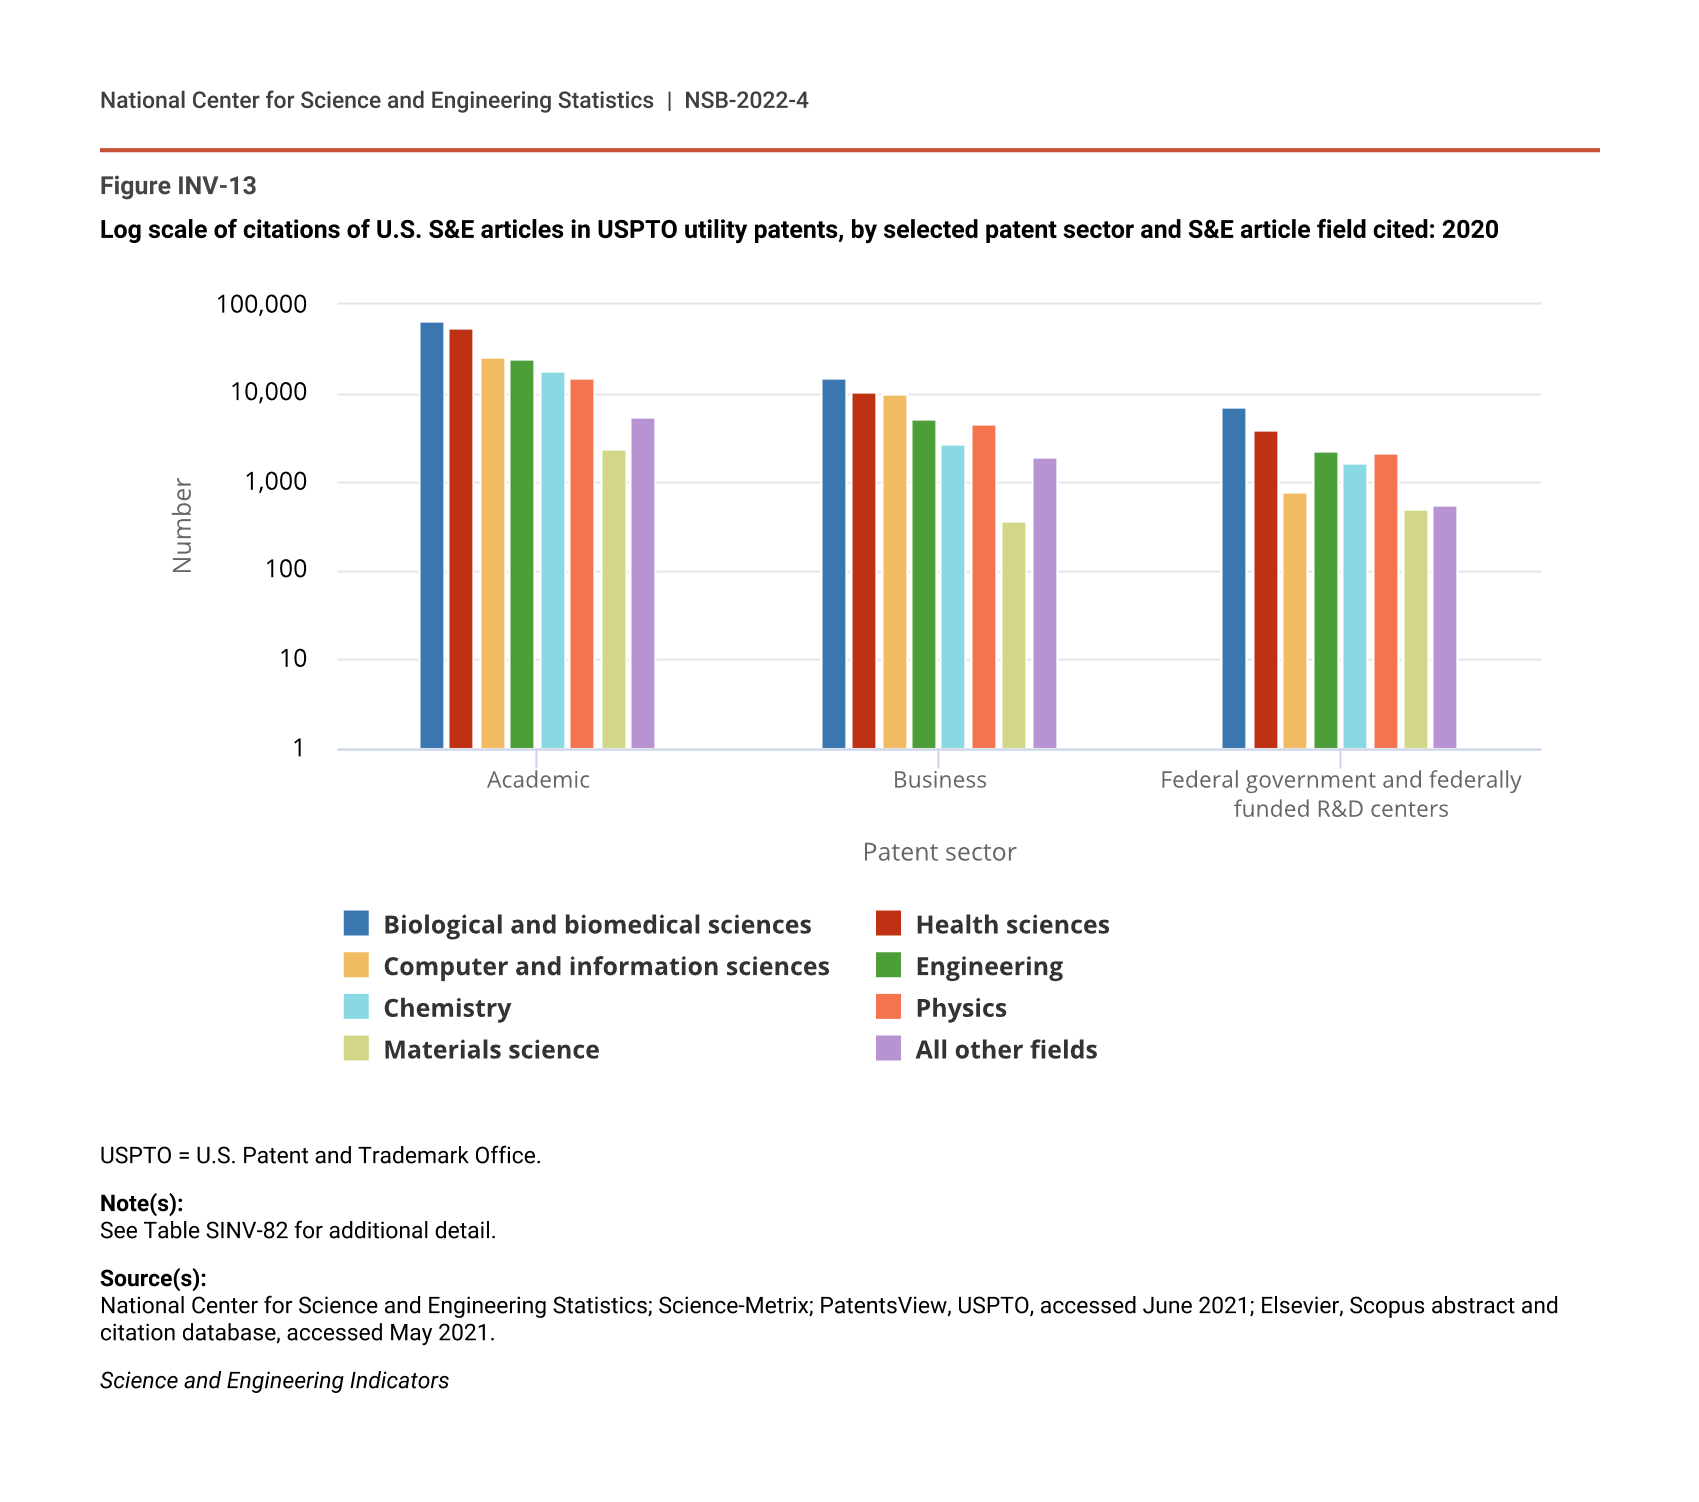
Biological and biomedical sciences are most often cited in patent documents; this is true for U.S. authors affiliated with academia, business, or federal labs (Figure INV-13). However, the scale of these citations varies substantially. Authors from academia contributed the greatest number and proportion of S&E articles cited in patents in 2020. Of the 696,000 citations to S&E articles in patents in 2020, about 31% (214,305) were to articles from the U.S. academic sector (Table SINV-82). Publications of U.S. S&E articles with academic-affiliated authors in the biological and biomedical sciences received 66,000 citations in patent documents, publications with business-affiliated authors received 15,000 citations, and publications with federal government-affiliated authors received almost 7,000 (Figure INV-13). Health sciences publications, the next most cited category for each sector, was the field with the largest number of publications worldwide in 2020 according to the analysis of all S&E articles in the Indicators report “Publications Output: U.S. Trends and International Comparisons.”
Log scale of citations of U.S. S&E articles in USPTO utility patents, by selected patent sector and S&E article field cited: 2020
| Patent sector | Biological and biomedical sciences | Health sciences | Computer and information sciences | Engineering | Chemistry | Physics | Materials science | All other fields |
|---|---|---|---|---|---|---|---|---|
| Academic | 66,356 | 55,935 | 26,375 | 24,812 | 17,970 | 15,044 | 2,439 | 5,375 |
| Business | 15,150 | 10,440 | 9,951 | 5,158 | 2,653 | 4,714 | 371 | 1,974 |
| Federal government and federally funded R&D centers | 6,893 | 3,812 | 785 | 2,279 | 1,644 | 2,158 | 505 | 548 |
USPTO = U.S. Patent and Trademark Office.
Note(s):
See Table SINV-82 for additional detail.
Source(s):
National Center for Science and Engineering Statistics; Science-Metrix; PatentsView, USPTO, accessed June 2021; Elsevier, Scopus abstract and citation database, accessed May 2021.
Science and Engineering Indicators
University Knowledge Transfer Activities
Licensing and university-based startup activity are two frequently tracked indicators of the technology commercialization component of knowledge transfer by university faculty, staff, and students. The analysis of these activities is based on data from AUTM, a membership organization that supports the technology transfer of academic research. The transfer of knowledge embedded in technology constitutes a special case of knowledge transfer often referred to as technology transfer. This section considers the special case of knowledge transfer in the form of technology transfer from universities to the business sector.
For many technology-based startups, possession of a patent or an exclusive option to license a patent is the first step to attracting external financing. Patented inventions can be licensed directly to an external party, or an exclusive option can be granted for licensing rights at a future date. The startups assessed in this section are companies that are founded using university intellectual property (AUTM 2021). These startup companies reported by universities in AUTM data refer to companies that were formed in the reporting year specifically to develop the technology being licensed.
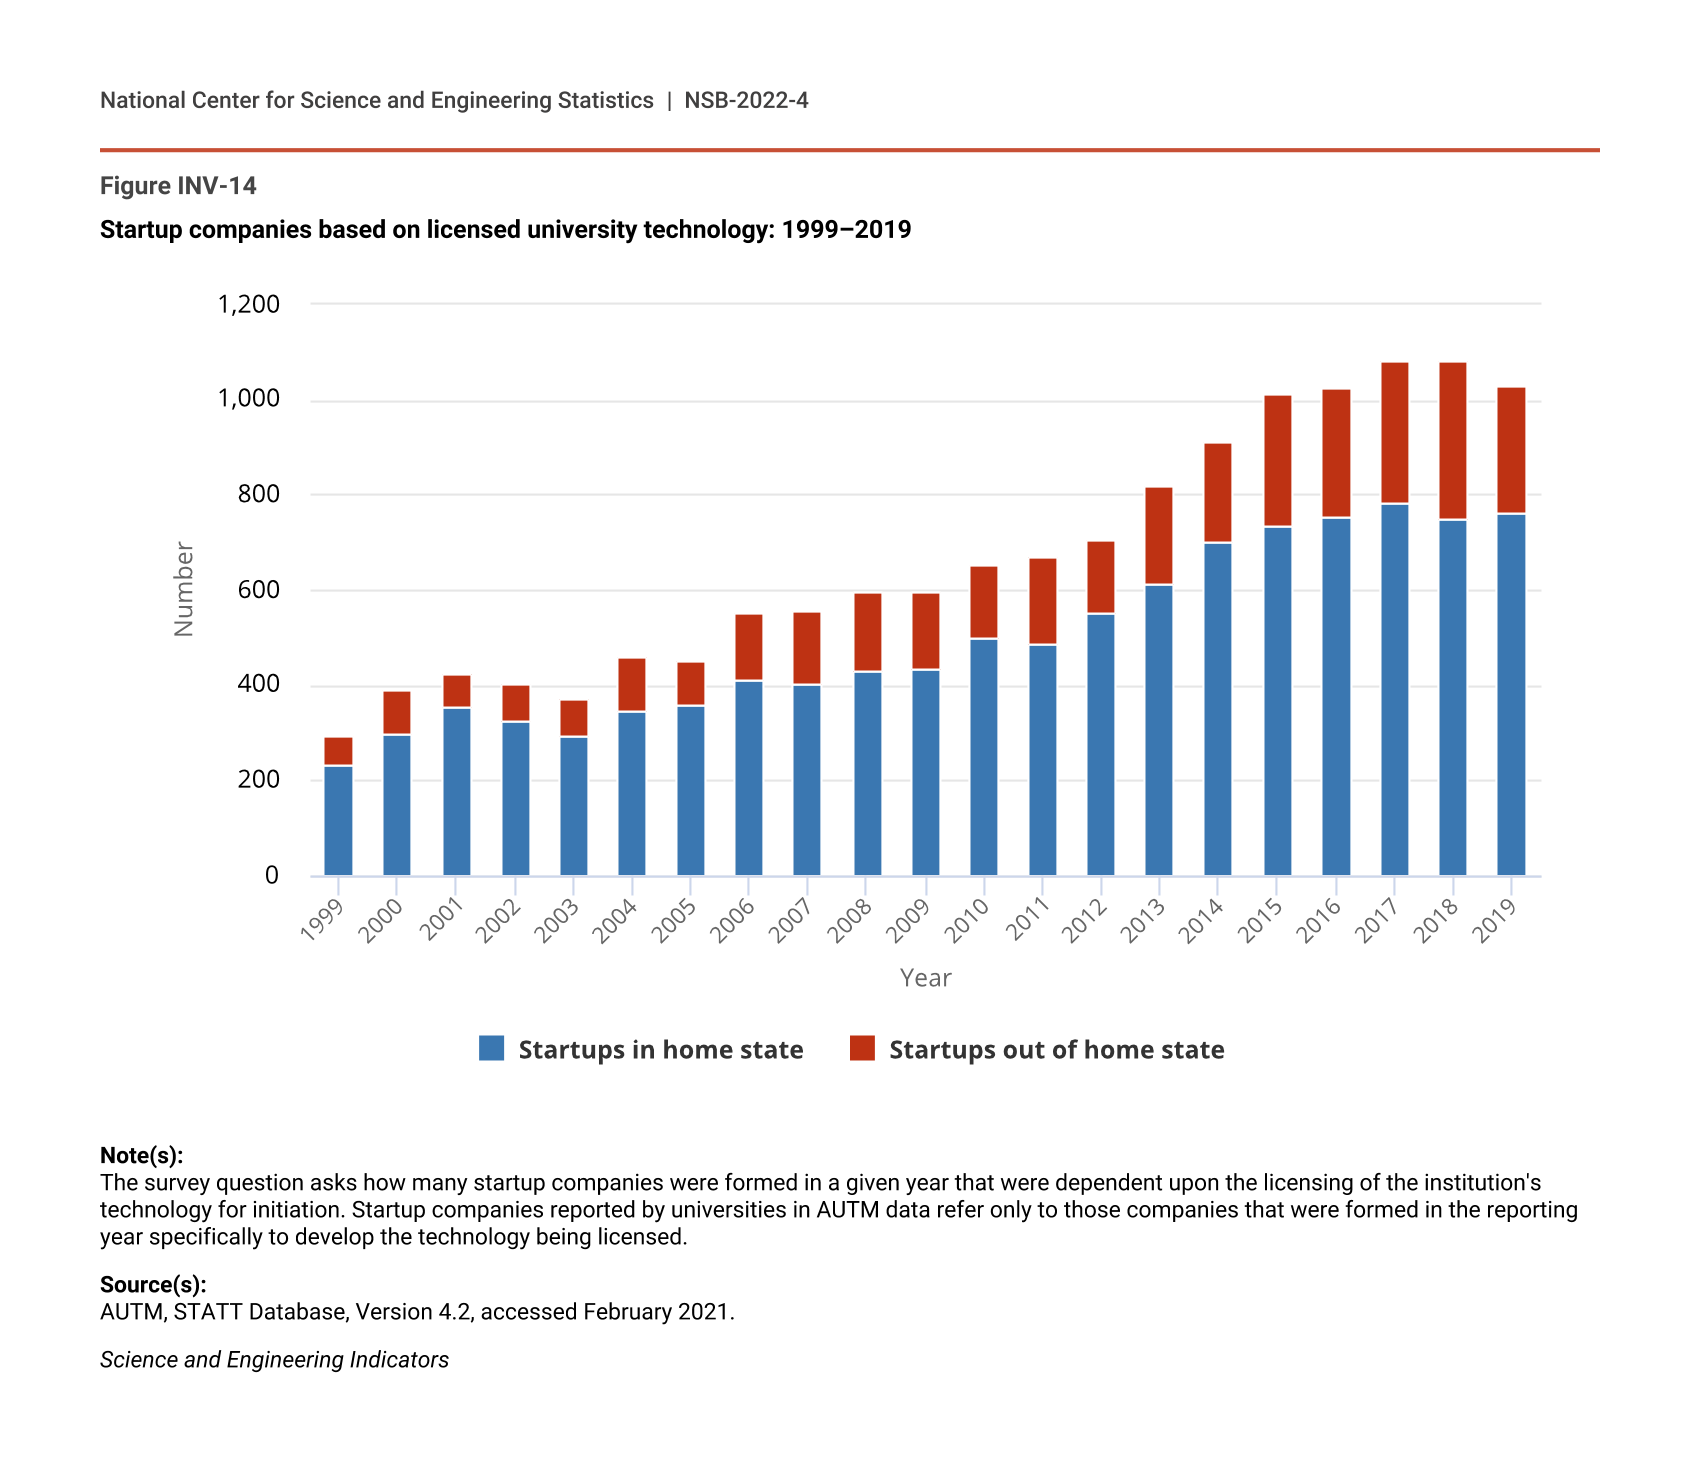
According to AUTM, in 2019, U.S. universities executed almost 8,000 new licenses or options. Increasingly, these licenses or options are executed by startups and small firms (those with fewer than 500 employees). In 2009, startups accounted for 15% (800) and small businesses 50% (2,597) of new licenses or options (Table INV-2). By 2019, university startups accounted for about 1,500 licenses (19%) and small companies licensing university technology accounted for almost 4,700 (59%) (Table INV-2). Most university-related startups are located in the home state of the research university; only 26% were in another state in 2019 (Figure INV-14). The number of university-related startups launched annually has increased steadily since 2000, and in 2019 AUTM reported a combined 1,029 new university-related startups (Figure INV-14).
University technology licenses or license options executed, by company characteristic: 2009, 2014, and 2019
Note(s):
AUTM collects data on invention and patent-related activities of its member universities and hospitals. The number of member universities varies slightly from year to year. There were 248 in 2009, 252 in 2014, and 236 in 2019. Responding institutions may report for any 12-month period ending in the identified year. Startup companies reported by universities in AUTM data refer only to those companies that were formed in the reporting year specifically to develop the technology being licensed. Counts of licenses to startups and small companies are mutually exclusive. Small companies are those with fewer than 500 employees.
Source(s):
AUTM, AUTM Licensing Survey (various years), accessed February 2021.
Science and Engineering Indicators
Startup companies based on licensed university technology: 1999–2019
| Year | Startups in home state | Startups out of home state |
|---|---|---|
| 1999 | 230 | 64 |
| 2000 | 299 | 89 |
| 2001 | 353 | 73 |
| 2002 | 325 | 76 |
| 2003 | 295 | 79 |
| 2004 | 344 | 118 |
| 2005 | 357 | 94 |
| 2006 | 410 | 144 |
| 2007 | 402 | 153 |
| 2008 | 430 | 165 |
| 2009 | 435 | 161 |
| 2010 | 498 | 153 |
| 2011 | 487 | 184 |
| 2012 | 554 | 151 |
| 2013 | 611 | 207 |
| 2014 | 702 | 207 |
| 2015 | 735 | 277 |
| 2016 | 752 | 272 |
| 2017 | 782 | 298 |
| 2018 | 749 | 331 |
| 2019 | 763 | 266 |
Note(s):
The survey question asks how many startup companies were formed in a given year that were dependent upon the licensing of the institution's technology for initiation. Startup companies reported by universities in AUTM data refer only to those companies that were formed in the reporting year specifically to develop the technology being licensed.
Source(s):
AUTM, STATT Database, Version 4.2, accessed February 2021.
Science and Engineering Indicators
Federal Government Knowledge Transfer Support
Multiple indicators provide insight into how federal R&D contributes to innovation through knowledge transfer. Federal laboratories in multiple agencies or departments facilitate knowledge transfer through the information included in invention disclosures and patents and by way of licenses and collaborative relationships. Collaborative relationships include cooperative R&D agreements (CRADAs), of which the traditional type involves an agreement between a federal agency or laboratory and one or more nonfederal organizations. The nonfederal organization (a business, nonprofit, or other government entity) provides some of its own resources for the research activity. In exchange, the nonfederal organization is granted the option to license resulting technology. Nontraditional CRADAs provide a material transfer or other forms of federal technical assistance that may result in protected information. Additionally, federal laboratories and federal science-funding agencies support startups in many ways, including through the SBIR and STTR programs, the latter of which supports technology transfer from universities.
Nine federal departments or agencies reported R&D obligations of at least $1 billion in 2018, which generated significant new knowledge available for transfer (see Indicators 2020 report “Research and Development: U.S. Trends and International Comparisons”). Some of these departments and agencies report support for startups to the National Institute of Standards and Technology (NIST). For reporting departments and agencies, of the startups that received support from federal laboratories in 2016, the Department of Commerce (DOC) funded the most at 51 (Table INV-3). In 2016, the Department of Energy (DOE), with 1,760, and the National Aeronautics and Space Administration (NASA), with 1,554, disclosed the greatest numbers of inventions (Table INV-3). DOE had the highest number of patents granted (856 out of 2,341 total) (Table INV-3). DOE also had the greatest number of active invention licenses (943) and executed the highest number of new invention licenses (145) (Table INV-3). Furthermore, DOE had the highest total active licenses (5,410) (Table INV-3). As is the case with university licensing, federal government licensing of its inventions represents the technology transfer special case of knowledge transfer. Patents are used here as indicators of knowledge transfer because the assignment of patent protection allows for subsequent use and commercialization.
Federal laboratory technology transfer activity indicators, by selected departments and agencies: FY 2016
na = not applicable; data not reported at this level.
CRADA = Cooperative R&D Agreement; DHS = Department of Homeland Security; DOC = Department of Commerce; DOD = Department of Defense; DOE = Department of Energy; NASA = National Aeronautics and Space Administration; USDA = Department of Agriculture.
a Startups are companies that have been in existence for 5 years or less.
Note(s):
In addition to the federal departments and agencies listed in the table, the "All reporting federal agencies and departments" totals also include the Department of Health and Human Services, the Department of the Interior, the Department of Transportation, the Department of Veterans Affairs, and the Environmental Protection Agency. Invention licenses refer to inventions that are patented or could be patented. CRADAs refer to all agreements executed under CRADA authority (15 U.S.C. 3710a). Traditional CRADAs are collaborative R&D partnerships between a federal laboratory and one or more nonfederal organizations. In addition to CRADAs, federal agencies have varying authorities for other kinds of collaborative R&D relationships, such as Space Act Agreements (NASA) or other transaction authorities. Agency support for startups is defined as critical technical support (NIST 2019).
Source(s):
National Institute of Standards and Technology (NIST), U.S. Department of Commerce, Federal Laboratory Technology Transfer, Fiscal Year 2016: Summary Report to the President and the Congress (2019), accessed 10 January 2021.
Science and Engineering Indicators
Collaborative relationships were unevenly distributed among the six federal departments. Of the 30,116 active collaborations across all federal laboratories, the U.S. Department of Agriculture was involved in more than a third (12,092), and most of these (11,854) were not CRADAs (Table INV-3). With 27% and 25%, respectively, the Department of Defense and DOC had the greatest proportions of the 11,644 active CRADAs in 2016 (Table INV-3). These data suggest that the CRADA mechanism is suitable for establishing collaborations by some agencies, but other mechanisms, such as licensing, appear better able to meet the needs of other agencies.
Focused cross-agency federal initiatives strive to strengthen the development and flow of early-stage technologies into the commercial marketplace. The most substantial federal initiatives focused on small companies are two complementary programs, SBIR and STTR. Both are administered by the U.S. Small Business Administration with the goal of fostering innovation among domestic small businesses engaged in R&D activities to meet federal R&D needs. These two programs provide competitively awarded funding to small businesses (fewer than 500 employees) with the goal of stimulating technological innovation to address federal R&D needs. The programs are run through individual federal agencies with extramural research budgets of $100 million or greater. Many of the program recipients are startups, especially those receiving funds as part of the STTR program.
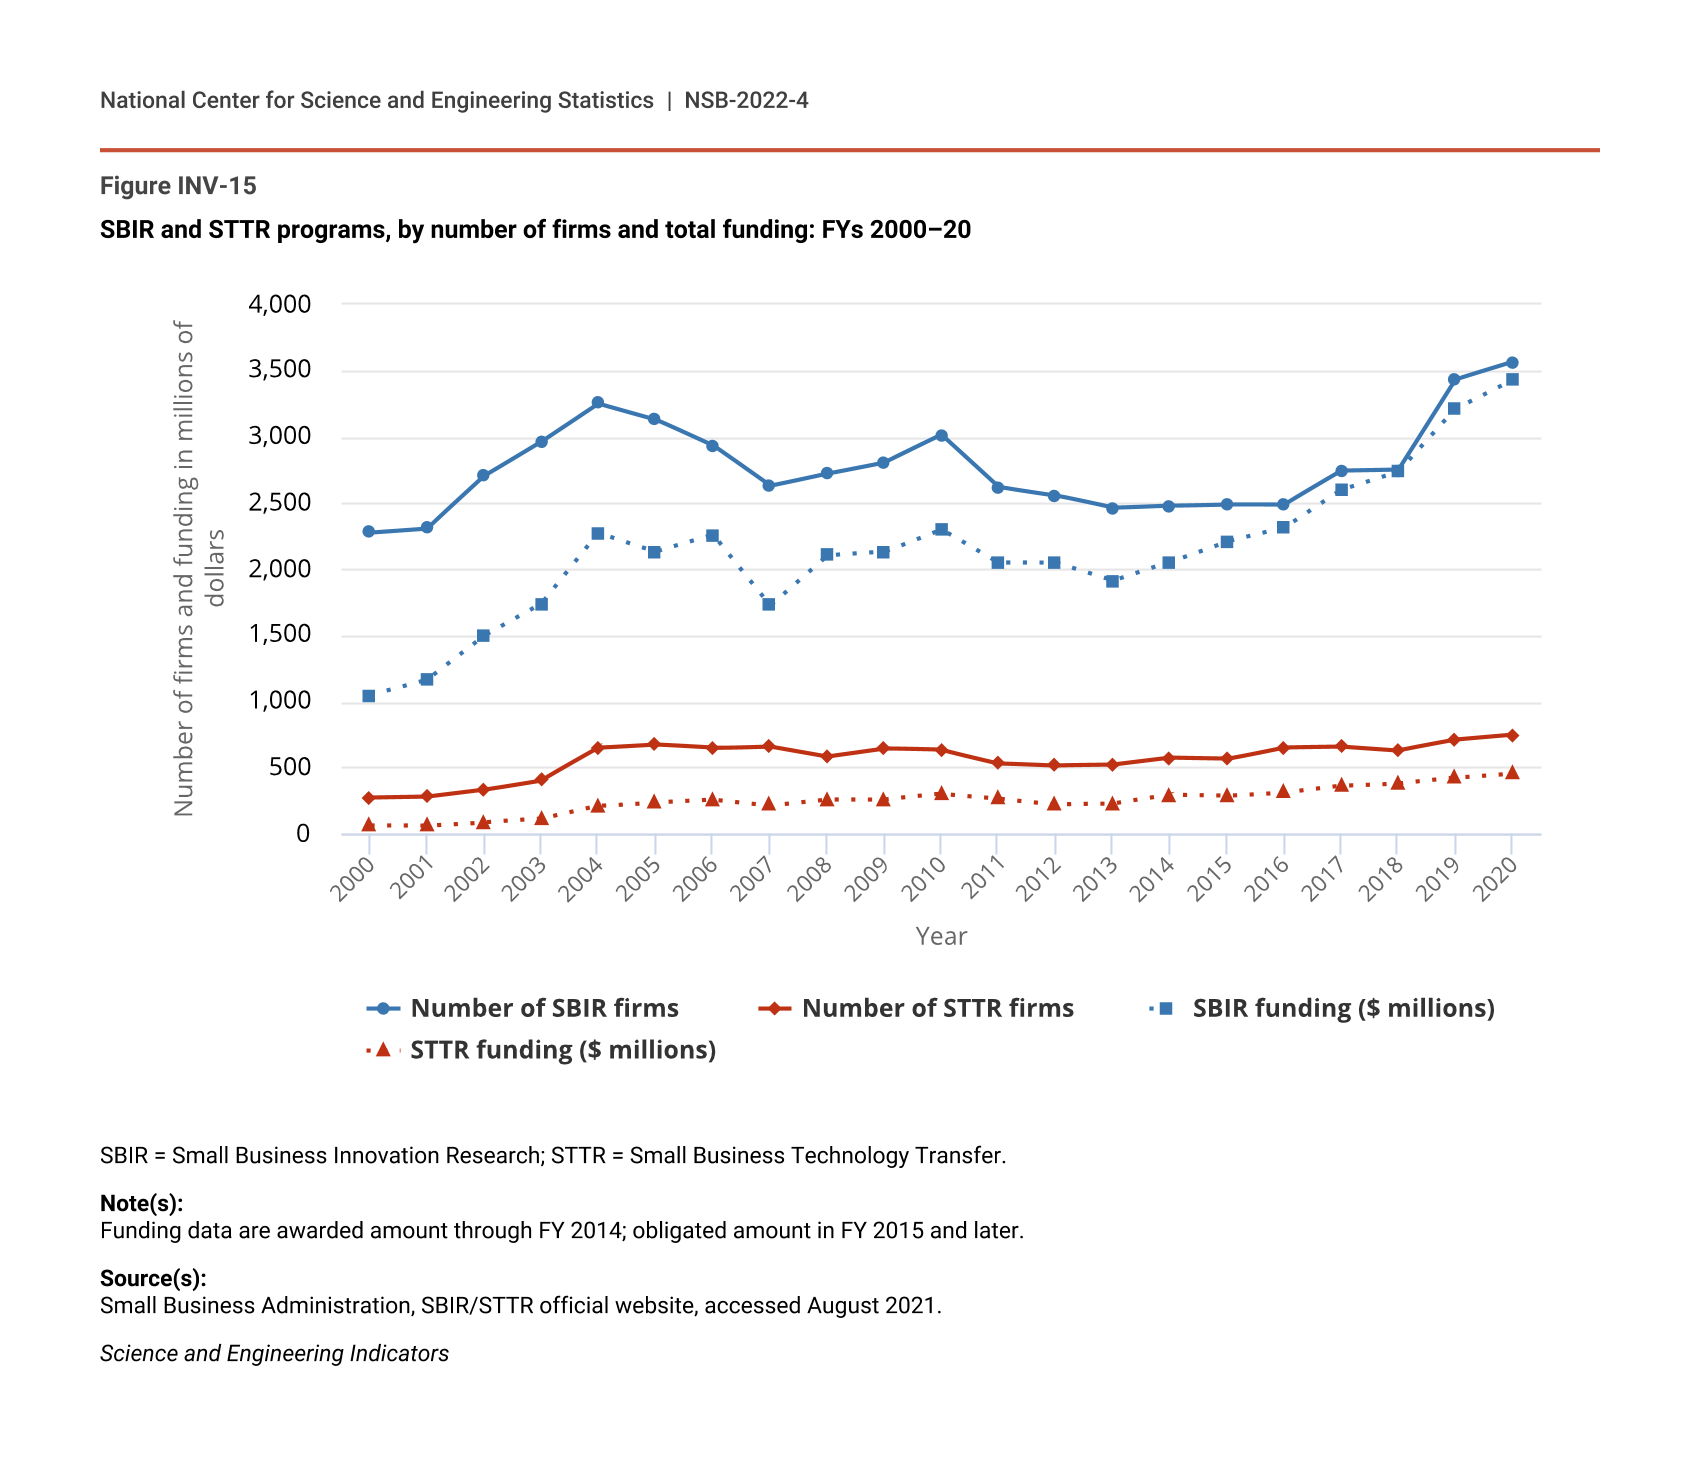
Established in 1992, the STTR program focuses on partnerships between small businesses and universities or other nonprofit research institutions. Accordingly, it plays a large role in knowledge transfer, and program award data provide a useful indicator of the same. The number of firms supported by the program rose from 272 in 2000 to 745 in 2020 (Figure INV-15). Program funding grew from $63 million to $455 million over the same period.
SBIR and STTR programs, by number of firms and total funding: FYs 2000–20
| Year | Number of SBIR firms | Number of STTR firms | SBIR funding ($ millions) | STTR funding ($ millions) |
|---|---|---|---|---|
| 2000 | 2,277 | 272 | 1,047 | 63 |
| 2001 | 2,308 | 279 | 1,165 | 61 |
| 2002 | 2,703 | 332 | 1,495 | 85 |
| 2003 | 2,963 | 403 | 1,735 | 109 |
| 2004 | 3,252 | 646 | 2,272 | 208 |
| 2005 | 3,132 | 671 | 2,133 | 237 |
| 2006 | 2,933 | 646 | 2,259 | 257 |
| 2007 | 2,627 | 660 | 1,726 | 214 |
| 2008 | 2,721 | 584 | 2,104 | 258 |
| 2009 | 2,806 | 644 | 2,130 | 257 |
| 2010 | 3,015 | 633 | 2,301 | 299 |
| 2011 | 2,619 | 532 | 2,046 | 266 |
| 2012 | 2,556 | 514 | 2,045 | 222 |
| 2013 | 2,461 | 519 | 1,909 | 226 |
| 2014 | 2,479 | 571 | 2,052 | 291 |
| 2015 | 2,489 | 564 | 2,209 | 285 |
| 2016 | 2,487 | 653 | 2,311 | 311 |
| 2017 | 2,740 | 659 | 2,599 | 363 |
| 2018 | 2,748 | 629 | 2,738 | 381 |
| 2019 | 3,433 | 708 | 3,215 | 423 |
| 2020 | 3,564 | 745 | 3,434 | 455 |
SBIR = Small Business Innovation Research; STTR = Small Business Technology Transfer.
Note(s):
Funding data are awarded amount through FY 2014; obligated amount in FY 2015 and later.
Source(s):
Small Business Administration, SBIR/STTR official website, accessed August 2021.
Science and Engineering Indicators
SBIR participant companies often rely on third parties to help perform program-funded research, the results of which are transferred to participants. SBIR program data therefore also provide an indication of knowledge transfer, albeit a less direct one. The SBIR program conferred awards to 3,564 firms in 2020, up from 2,277 in 2000. The 2020 awards accounted for almost $3.5 billion in funding (Figure INV-15).
At the state level, SBIR and STTR funding as a ratio to state gross domestic product provides a direct measure of federal support for small businesses. These data are available in the National Science Board’s State Indicators Data Tool. From 2016 to 2018, the SBIR ratio is highest in two New England states, Massachusetts and New Hampshire, followed by New Mexico and Colorado (NSB 2021b).
Increasingly, another form of shared knowledge is original computer software created for government activities throughout the U.S. federal government. Much of this software has the potential for reuse, both inside and outside of government. The U.S. federal government supports the sharing of software developed by and for the federal government through its Federal Source Code Policy, which provides a framework for government code to be released and reused through OSS licensing. This policy allows software created for narrow federal purposes to be reused elsewhere within the federal government, multiplying its value to the government, and outside of the federal government, further extending its impact.
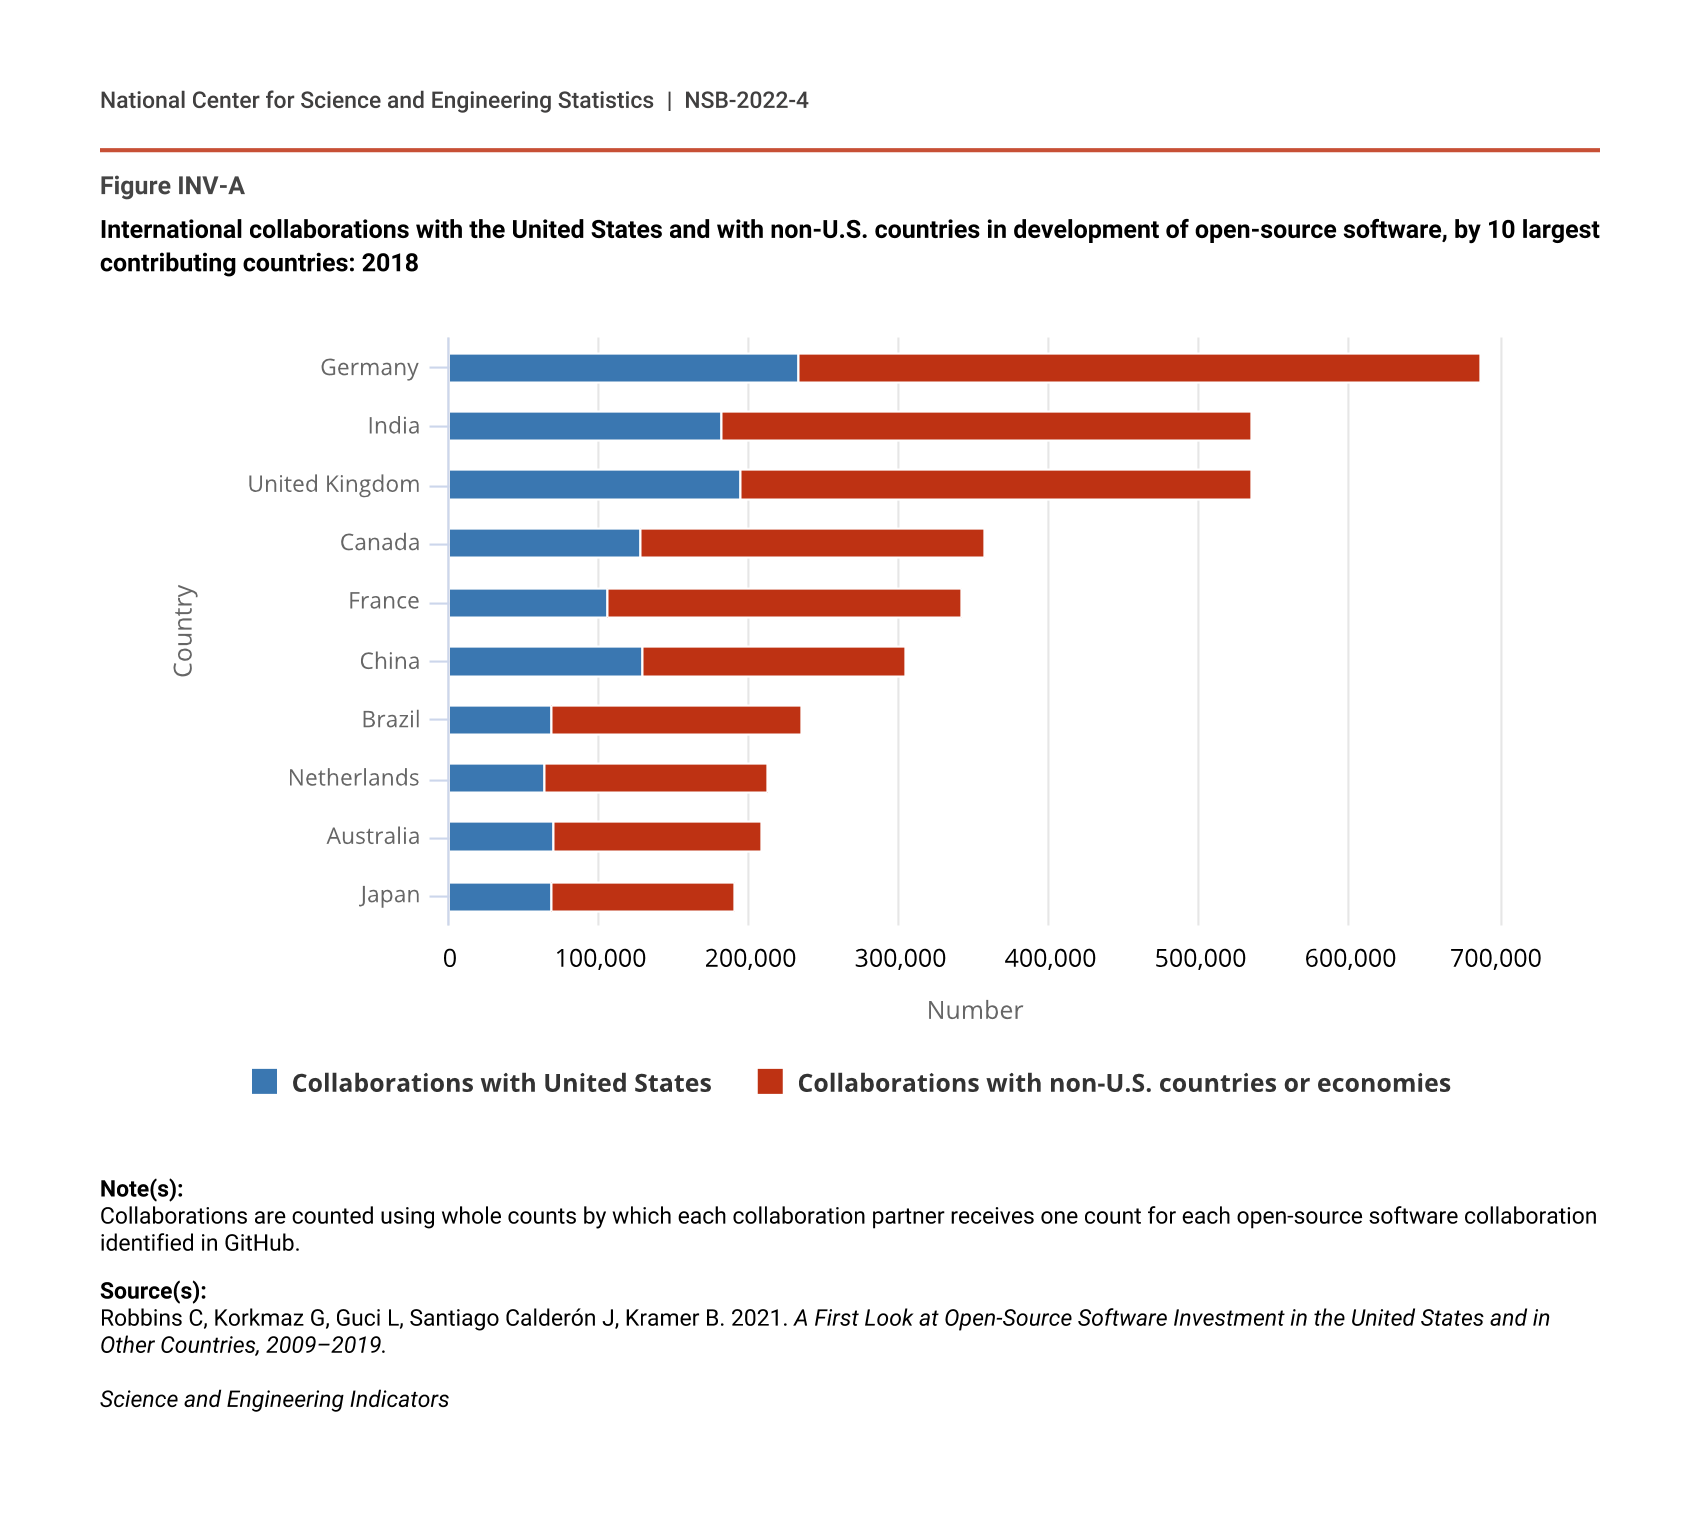
One indication of the increasing activity of federal departments and agencies is the sharing of computer software repositories with an Open Source Initiative (OSI)–approved license on the GitHub platform. Repositories contain all of the files and folders associated with a specific OSS project and can be owned by individual entities or shared across multiple entities. While this measure based on GitHub is not comprehensive (federal agencies may share through separate platforms), it shows that from 2010 to 2019, the 10 most active federal department and agency participants in OSS sharing contributed to over 15,000 distinct OSS repositories (Table INV-4). Representative government-contributed OSS projects include DOE’s Raven, code for performing risk analysis of nuclear reactor systems, and DOE’s Qball, code for performing molecular dynamics to compute the electronic structure of matter. Not surprisingly, because DOE and NASA were early adopters of OSS, these two agencies have the largest number of repositories among federal agencies. In 2009, only DOC, DOE, and NASA used open-source platforms to share software with other users; by 2019, 21 agencies did so (Table SINV-83).
Cumulative contribution of selected entities to open-source software on GitHub: 2010–19
Note(s):
Included repositories are those public on GitHub with machine detectable Open Source Initiative-approved licenses that received contributions from affiliates from each organization; software shared through other licenses are excluded. Public higher education institutions and selected private entities are included as benchmarks. The Department of Energy encompasses 17 national laboratories, 16 of which were included in the data. The exception is the Department of Energy's SLAC National Accelerator Laboratory, formerly known as Stanford Linear Accelerator. Due to data constraints, these repositories are attributed to the operator (Stanford), rather than to the Department of Energy. Overall, in terms of number of repositories, Microsoft and RedHat are the two largest contributors from the private sector and UC Berkeley from higher education institutions.
Source(s):
Robbins C, Korkmaz G, Guci L, Santiago Calderón J, Kramer B. 2021. A First Look at Open-Source Software Investment in the United States and in Other Countries, 2009–2019.
Science and Engineering Indicators
U.S. Startup Trends
A significant amount of knowledge transfer to startup companies takes place via startup licensing of university and government technology and from startup participation in government programs like STTR. However, many startups that rely on outside knowledge as the basis for their new products and processes neither license that outside knowledge nor participate in government programs. Data from university technology transfer offices, for example, indicate that just over 1,000 university-related startups were formed in 2019 (Figure INV-14). Thus, the data described in preceding sections do not account for all knowledge transfer to startups.
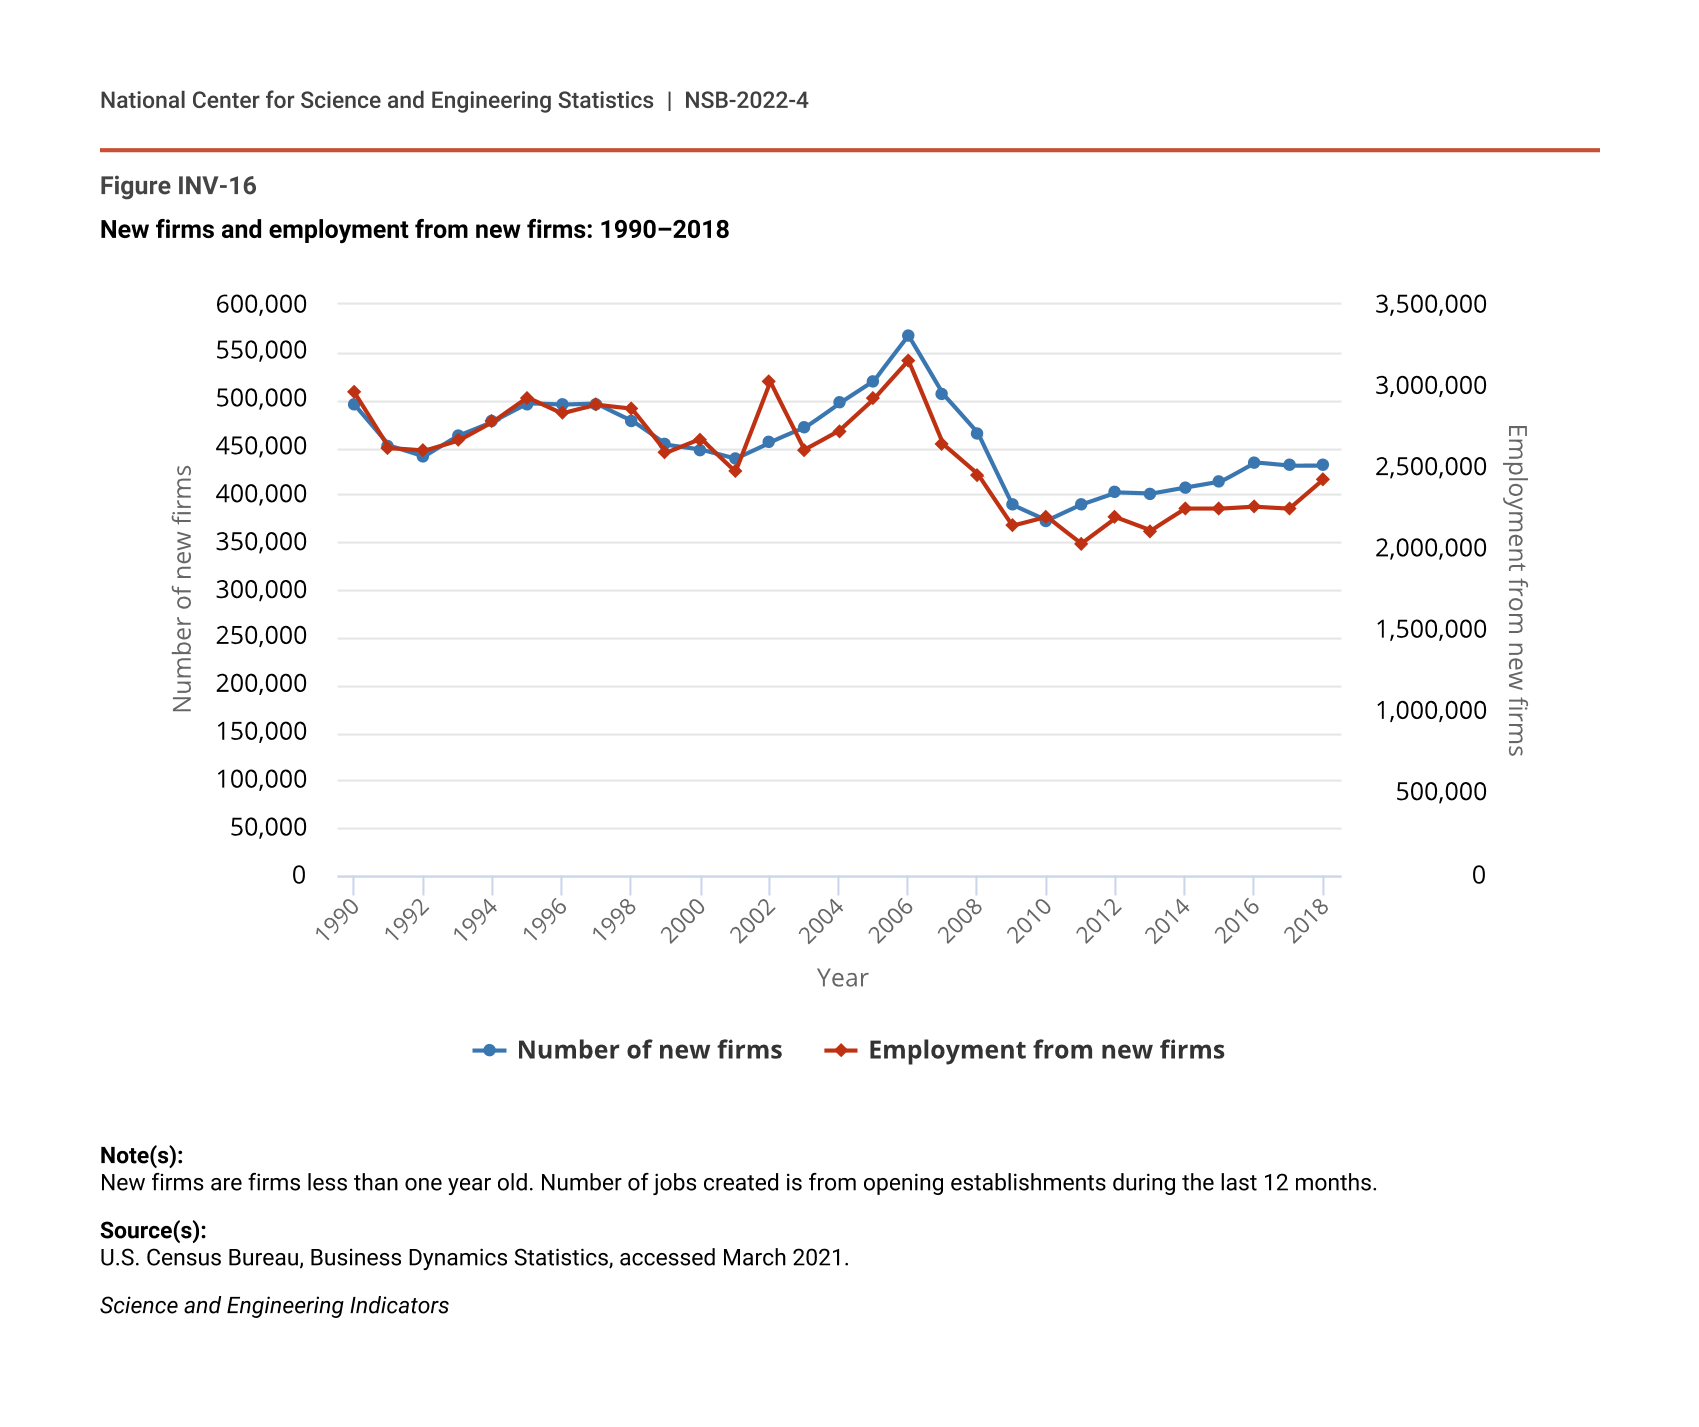
According to the U.S. Census Bureau, over 400,000 firms in the United States were less than one year old in 2018. Many factors influence startup activity, not only transfer of science and technology knowledge. That said, data on trends for total new firm formation provide a top-down and indirect view of knowledge transfer to startups over time that complements license and program participation data. An increase or decrease in new firm formation could be expected to correlate with overall knowledge transfer to new firms. In other words, if many more or many fewer new firms are formed, it is likely that a correspondingly larger or smaller number of new firms are making use of external knowledge. From 1990 to 2018, the number of new firms (those less than a year old) fell from 494,000 to 431,000 (Figure INV-16). While it may be the case that the share of young firms relying on external science and technology knowledge has grown during this period, this long-term decline in new firm formation suggests a decline in the flow of knowledge into this sector of the economy or other factors holding back firm formation.
New firms and employment from new firms: 1990–2018
| Year | Number of new firms | Employment from new firms |
|---|---|---|
| 1990 | 494,211 | 2,959,829 |
| 1991 | 451,624 | 2,618,099 |
| 1992 | 440,213 | 2,600,868 |
| 1993 | 462,047 | 2,665,454 |
| 1994 | 476,946 | 2,781,932 |
| 1995 | 495,775 | 2,930,505 |
| 1996 | 494,101 | 2,832,321 |
| 1997 | 495,182 | 2,883,298 |
| 1998 | 478,100 | 2,861,071 |
| 1999 | 452,201 | 2,588,174 |
| 2000 | 447,447 | 2,673,766 |
| 2001 | 437,946 | 2,474,293 |
| 2002 | 455,034 | 3,027,582 |
| 2003 | 470,033 | 2,608,143 |
| 2004 | 496,036 | 2,725,907 |
| 2005 | 519,532 | 2,919,477 |
| 2006 | 566,888 | 3,153,508 |
| 2007 | 504,884 | 2,638,994 |
| 2008 | 463,757 | 2,454,459 |
| 2009 | 389,009 | 2,140,981 |
| 2010 | 372,915 | 2,198,021 |
| 2011 | 389,610 | 2,035,948 |
| 2012 | 402,146 | 2,193,060 |
| 2013 | 400,766 | 2,112,546 |
| 2014 | 407,244 | 2,245,467 |
| 2015 | 413,468 | 2,244,958 |
| 2016 | 433,961 | 2,258,063 |
| 2017 | 430,437 | 2,247,807 |
| 2018 | 430,630 | 2,429,963 |
Note(s):
New firms are firms less than one year old. Number of jobs created is from opening establishments during the last 12 months.
Source(s):
U.S. Census Bureau, Business Dynamics Statistics, accessed March 2021.
Science and Engineering Indicators