 An official website of the United States government
 Data
Tables
Select "VIEW" to see the table. PDF and Excel are available for download.
Figures
Data Sources
DOWNLOAD DATA SOURCES| Item | Title | Provider | Product |
|---|---|---|---|
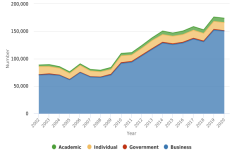
| Figure INV-1 | USPTO utility patents granted to U.S. owners: 2002–20 | United States Patent and Trademark Office | PatentsView |
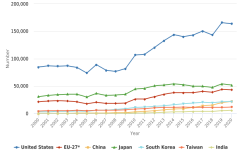
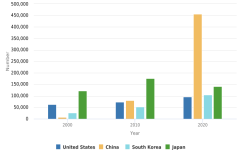
| Figure INV-2 | USPTO utility patents granted, by selected region, country, or economy: 2000–20 | United States Patent and Trademark Office | PatentsView |
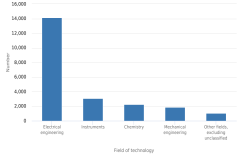
| Figure INV-3 | USPTO patents granted to inventors from China, by field of technology: 2020 | United States Patent and Trademark Office | PatentsView |
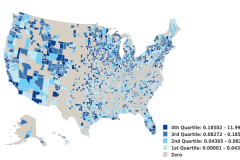
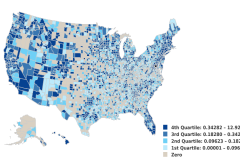
| Figure INV-4 | USPTO utility patents granted to U.S. owners per 1,000 residents, by U.S. county: 2020 | U.S. Census Bureau | Population Estimates Program |
| Figure INV-4 | USPTO utility patents granted to U.S. owners per 1,000 residents, by U.S. county: 2020 | United States Patent and Trademark Office | PatentsView |
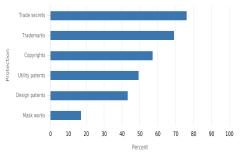
| Figure INV-5 | Rating of importance of different types of intellectual property protections by U.S. companies that performed or funded R&D: 2018 | National Center for Science and Engineering Statistics | Business Research and Development Survey |
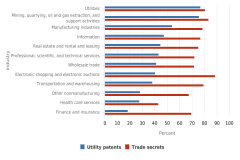
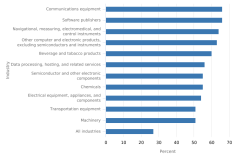
| Figure INV-6 | R&D performing or funding U.S. companies that rate intellectual property protection as important, by intellectual property type and industry: 2018 | National Center for Science and Engineering Statistics | Business Research and Development Survey |
| Figure INV-7 | International patent families granted, by country: 2000, 2010, and 2020 | European Patent Office | PATSTAT |
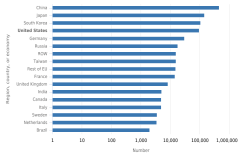
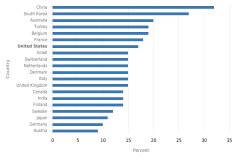
| Figure INV-8 | Log scale of international patent families granted, by region, country, or economy: 2020 | European Patent Office | PATSTAT |
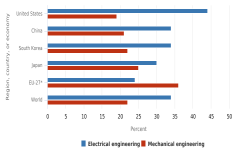
| Figure INV-9 | Share of electrical and mechanical engineering patents in a selected region's, country's, or economy's international patent families granted: 2020 | European Patent Office | PATSTAT |
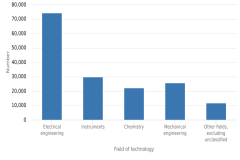
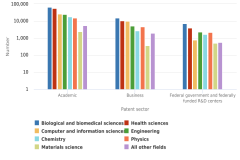
| Figure INV-10 | USPTO patents granted to U.S. inventors, by field of technology: 2020 | United States Patent and Trademark Office | PatentsView |
| Figure INV-11 | Share of PCT applications with at least one woman listed as inventor for the top 20 origins: 2019 | European Patent Office | PATSTAT |
| Figure INV-11 | Share of PCT applications with at least one woman listed as inventor for the top 20 origins: 2019 | World Intellectual Property Organization | Intellectual Property Statistics |
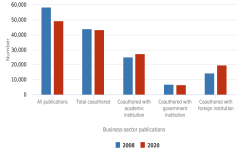
| Figure INV-12 | Coauthored business-sector publications with other academic, government, and foreign institutions: 2008 and 2020 | Elsevier | Scopus |
| Figure INV-13 | Log scale of citations of U.S. S&E articles in USPTO utility patents, by selected patent sector and S&E article field cited: 2020 | Elsevier | Scopus |
| Figure INV-13 | Log scale of citations of U.S. S&E articles in USPTO utility patents, by selected patent sector and S&E article field cited: 2020 | United States Patent and Trademark Office | PatentsView |
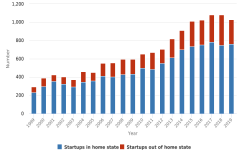
| Figure INV-14 | Startup companies based on licensed university technology: 1999–2019 | AUTM | AUTM Licensing Activity Survey |
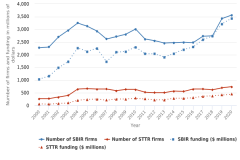
| Figure INV-15 | SBIR and STTR programs, by number of firms and total funding: FYs 2000–20 | Small Business Administration | SBIR/STTR Awards Data |
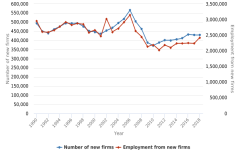
| Figure INV-16 | New firms and employment from new firms: 1990–2018 | U.S. Census Bureau | Business Dynamics Statistics |
| Figure INV-17 | Share of U.S. companies reporting product or process innovation, by selected industry: 2015–17 | National Center for Science and Engineering Statistics | Annual Business Survey |
| Figure INV-18 | U.S. companies introducing product or process innovation, by selected industry: 2015–17 | National Center for Science and Engineering Statistics | Annual Business Survey |
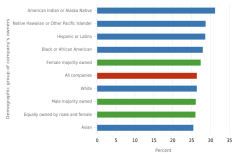
| Figure INV-19 | Share of U.S. companies introducing product or process innovations, by owners' sex, race, and ethnicity: 2015–17 | National Center for Science and Engineering Statistics | Annual Business Survey |
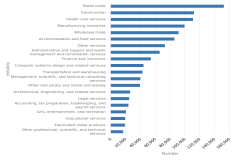
| Figure INV-20 | Number of U.S.-registered USPTO trademarks, by business sector: 2010 and 2020 | Reed Tech, LexisNexis | USPTO Trademark Data |
| Figure INV-21 | Number of registered USPTO trademarks per 1,000 residents, by U.S. county: 2020 | Reed Tech, LexisNexis | USPTO Trademark Data |
| Figure INV-21 | Number of registered USPTO trademarks per 1,000 residents, by U.S. county: 2020 | U.S. Census Bureau | Population Estimates Program |
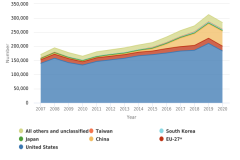
| Figure INV-22 | Number of registered USPTO trademarks, by selected region, country, or economy: 2007–20 | Reed Tech, LexisNexis | USPTO Trademark Data |
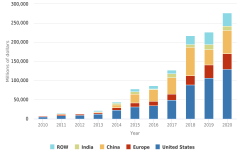
| Figure INV-23 | Global venture capital investment, by selected country, region, or economy: 2010–20 | PitchBook | Venture Capital and Private Equity Database |
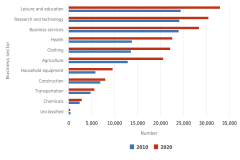
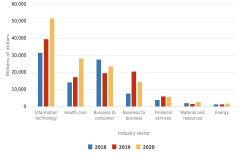
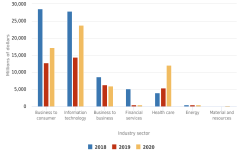
| Figure INV-24 | Venture capital investment received by firms headquartered in the United States, by industry sector: 2018, 2019, and 2020 | PitchBook | Venture Capital and Private Equity Database |
| Figure INV-25 | Venture capital investment received by firms headquartered in China, by industry sector: 2018, 2019, and 2020 | PitchBook | Venture Capital and Private Equity Database |
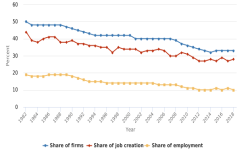
| Figure INV-26 | Share of firms, job creation, and employment from firms 5 years old or younger: 1982–2018 | U.S. Census Bureau | Business Dynamics Statistics |
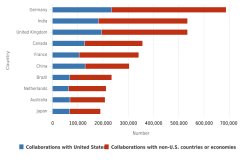
| Figure INV-A | International collaborations with the United States and with non-U.S. countries in development of open-source software, by 10 largest contributing countries: 2018 | GitHub | GitHub Platform |
| Table INV-2 | University technology licenses or license options executed, by company characteristic: 2009, 2014, and 2019 | AUTM | AUTM Licensing Activity Survey |
| Table INV-3 | Federal laboratory technology transfer activity indicators, by selected departments and agencies: FY 2016 | National Institute of Standards and Technology | Federal Laboratory Technology Transfer Report |
| Table INV-4 | Cumulative contribution of selected entities to open-source software on GitHub: 2010–19 | GitHub | GitHub Platform |
| Table INV-A | Federally sponsored citizen science projects on citizenscience.gov, by federal department or agency: 2020 | U.S. General Services Administration | CitizenScience.gov |
| Table SINV-1 | USPTO utility patents granted, by sector: 1998–2020 | United States Patent and Trademark Office | PatentsView |
| Table SINV-2 | Regions, countries, or economies in patent and trademark data | United States Patent and Trademark Office | PatentsView |
| Table SINV-3 | World Bank income levels of regions, countries, or economies in patent and trademark data: 2020 | World Bank | World Bank Country and Lending Groups |
| Table SINV-4 | Technical fields by fields of technology in patent data | World Intellectual Property Organization | Intellectual Property Statistics |
| Table SINV-5 | International patent families granted, by region, country, or economy: 1998–2020 | European Patent Office | PATSTAT |
| Table SINV-6 | International patent families granted in electrical machinery, apparatus, energy, by region, country, or economy: 1998–2020 | European Patent Office | PATSTAT |
| Table SINV-7 | International patent families granted in audio-visual technology, by region, country, or economy: 1998–2020 | European Patent Office | PATSTAT |
| Table SINV-8 | International patent families granted in telecommunications, by region, country, or economy: 1998–2020 | European Patent Office | PATSTAT |
| Table SINV-9 | International patent families granted in digital communication, by region, country, or economy: 1998–2020 | European Patent Office | PATSTAT |
| Table SINV-10 | International patent families granted in basic communication processes, by region, country, or economy: 1998–2020 | European Patent Office | PATSTAT |
| Table SINV-11 | International patent families granted in computer technology, by region, country, or economy: 1998–2020 | European Patent Office | PATSTAT |
| Table SINV-12 | International patent families granted in IT methods for management, by region, country, or economy: 1998–2020 | European Patent Office | PATSTAT |
| Table SINV-13 | International patent families granted in semiconductors, by region, country, or economy: 1998–2020 | European Patent Office | PATSTAT |
| Table SINV-14 | International patent families granted in optics, by region, country, or economy: 1998–2020 | European Patent Office | PATSTAT |
| Table SINV-15 | International patent families granted in measurement, by region, country, or economy: 1998–2020 | European Patent Office | PATSTAT |
| Table SINV-16 | International patent families granted in analysis of biological materials, by region, country, or economy: 1998–2020 | European Patent Office | PATSTAT |
| Table SINV-17 | International patent families granted in control, by region, country, or economy: 1998–2020 | European Patent Office | PATSTAT |
| Table SINV-18 | International patent families granted in medical technology, by region, country, or economy: 1998–2020 | European Patent Office | PATSTAT |
| Table SINV-19 | International patent families granted in organic fine chemistry, by region, country, or economy: 1998–2020 | European Patent Office | PATSTAT |
| Table SINV-20 | International patent families granted in biotechnology, by region, country, or economy: 1998–2020 | European Patent Office | PATSTAT |
| Table SINV-21 | International patent families granted in pharmaceuticals, by region, country, or economy: 1998–2020 | European Patent Office | PATSTAT |
| Table SINV-22 | International patent families granted in macromolecular chemistry, polymers, by region, country, or economy: 1998–2020 | European Patent Office | PATSTAT |
| Table SINV-23 | International patent families granted in food chemistry, by region, country, or economy: 1998–2020 | European Patent Office | PATSTAT |
| Table SINV-24 | International patent families granted in basic materials chemistry, by region, country, or economy: 1998–2020 | European Patent Office | PATSTAT |
| Table SINV-25 | International patent families granted in materials, metallurgy, by region, country, or economy: 1998–2020 | European Patent Office | PATSTAT |
| Table SINV-26 | International patent families granted in surface technology, coating, by region, country, or economy: 1998–2020 | European Patent Office | PATSTAT |
| Table SINV-27 | International patent families granted in microstructural technology and nanotechnology, by region, country, or economy: 1998–2020 | European Patent Office | PATSTAT |
| Table SINV-28 | International patent families granted in chemical engineering, by region, country, or economy: 1998–2020 | European Patent Office | PATSTAT |
| Table SINV-29 | International patent families granted in environmental technology, by region, country, or economy: 1998–2020 | European Patent Office | PATSTAT |
| Table SINV-30 | International patent families granted in handling, by region, country, or economy: 1998–2020 | European Patent Office | PATSTAT |
| Table SINV-31 | International patent families granted in machine tools, by region, country, or economy: 1998–2020 | European Patent Office | PATSTAT |
| Table SINV-32 | International patent families granted in engines, pumps, turbines, by region, country, or economy: 1998–2020 | European Patent Office | PATSTAT |
| Table SINV-33 | International patent families granted in textile and paper machines, by region, country, or economy: 1998–2020 | European Patent Office | PATSTAT |
| Table SINV-34 | International patent families granted in other special machines, by region, country, or economy: 1998–2020 | European Patent Office | PATSTAT |
| Table SINV-35 | International patent families granted in thermal processes and apparatus, by region, country, or economy: 1998–2020 | European Patent Office | PATSTAT |
| Table SINV-36 | International patent families granted in mechanical elements, by region, country, or economy: 1998–2020 | European Patent Office | PATSTAT |
| Table SINV-37 | International patent families granted in transport, by region, country, or economy: 1998–2020 | European Patent Office | PATSTAT |
| Table SINV-38 | International patent families granted in furniture, games, by region, country, or economy: 1998–2020 | European Patent Office | PATSTAT |
| Table SINV-39 | International patent families granted in other consumer goods, by region, country, or economy: 1998–2020 | European Patent Office | PATSTAT |
| Table SINV-40 | International patent families granted in civil engineering, by region, country, or economy: 1998–2020 | European Patent Office | PATSTAT |
| Table SINV-41 | International patent families unassigned under the WIPO classification, by region, country, or economy: 1998-2020 | European Patent Office | PATSTAT |
| Table SINV-42 | U.S. granted international patent families, by WIPO technical field: 1998–2020 | European Patent Office | PATSTAT |
| Table SINV-43 | U.S. specialization index of international patent families, by WIPO technical field: 1998–2020 | European Patent Office | PATSTAT |
| Table SINV-44 | USPTO utility patents granted, by region, country, or economy: 1998–2020 | United States Patent and Trademark Office | PatentsView |
| Table SINV-45 | USPTO utility patents granted in electrical machinery, apparatus, energy, by region, country, or economy: 1998–2020 | United States Patent and Trademark Office | PatentsView |
| Table SINV-46 | USPTO utility patents granted in audio-visual technology, by region, country, or economy: 1998–2020 | United States Patent and Trademark Office | PatentsView |
| Table SINV-47 | USPTO utility patents granted in telecommunications, by region, country, or economy: 1998–2020 | United States Patent and Trademark Office | PatentsView |
| Table SINV-48 | USPTO utility patents granted in digital communication, by region, country, or economy: 1998–2020 | United States Patent and Trademark Office | PatentsView |
| Table SINV-49 | USPTO utility patents granted in basic communication processes, by region, country, or economy: 1998–2020 | United States Patent and Trademark Office | PatentsView |
| Table SINV-50 | USPTO utility patents granted in computer technology, by region, country, or economy: 1998–2020 | United States Patent and Trademark Office | PatentsView |
| Table SINV-51 | USPTO utility patents granted in IT methods for management, by region, country, or economy: 1998–2020 | United States Patent and Trademark Office | PatentsView |
| Table SINV-52 | USPTO utility patents granted in semiconductors, by region, country, or economy: 1998–2020 | United States Patent and Trademark Office | PatentsView |
| Table SINV-53 | USPTO utility patents granted in optics, by region, country, or economy: 1998–2020 | United States Patent and Trademark Office | PatentsView |
| Table SINV-54 | USPTO utility patents granted in measurement, by region, country, or economy: 1998–2020 | United States Patent and Trademark Office | PatentsView |
| Table SINV-55 | USPTO utility patents granted in analysis of biological materials, by region, country, or economy: 1998–2020 | United States Patent and Trademark Office | PatentsView |
| Table SINV-56 | USPTO utility patents granted in control, by region, country, or economy: 1998–2020 | United States Patent and Trademark Office | PatentsView |
| Table SINV-57 | USPTO utility patents granted in medical technology, by region, country, or economy: 1998–2020 | United States Patent and Trademark Office | PatentsView |
| Table SINV-58 | USPTO utility patents granted in organic fine chemistry, by region, country, or economy: 1998–2020 | United States Patent and Trademark Office | PatentsView |
| Table SINV-59 | USPTO utility patents granted in biotechnology, by region, country, or economy: 1998–2020 | United States Patent and Trademark Office | PatentsView |
| Table SINV-60 | USPTO utility patents granted in pharmaceuticals, by region, country, or economy: 1998–2020 | United States Patent and Trademark Office | PatentsView |
| Table SINV-61 | USPTO utility patents granted in macromolecular chemistry, polymers, by region, country, or economy: 1998–2020 | United States Patent and Trademark Office | PatentsView |
| Table SINV-62 | USPTO utility patents granted in food chemistry, by region, country, or economy: 1998–2020 | United States Patent and Trademark Office | PatentsView |
| Table SINV-63 | USPTO utility patents granted in basic materials chemistry, by region, country, or economy: 1998–2020 | United States Patent and Trademark Office | PatentsView |
| Table SINV-64 | USPTO utility patents granted in materials, metallurgy, by region, country, or economy: 1998–2020 | United States Patent and Trademark Office | PatentsView |
| Table SINV-65 | USPTO utility patents granted in surface technology, coating, by region, country, or economy: 1998–2020 | United States Patent and Trademark Office | PatentsView |
| Table SINV-66 | USPTO utility patents granted in microstructural technology and nanotechnology, by region, country, or economy: 1998–2020 | United States Patent and Trademark Office | PatentsView |
| Table SINV-67 | USPTO utility patents granted in chemical engineering, by region, country, or economy: 1998–2020 | United States Patent and Trademark Office | PatentsView |
| Table SINV-68 | USPTO utility patents granted in environmental technology, by region, country, or economy: 1998–2020 | United States Patent and Trademark Office | PatentsView |
| Table SINV-69 | USPTO utility patents granted in handling, by region, country, or economy: 1998–2020 | United States Patent and Trademark Office | PatentsView |
| Table SINV-70 | USPTO utility patents granted in machine tools, by region, country, or economy: 1998–2020 | United States Patent and Trademark Office | PatentsView |
| Table SINV-71 | USPTO utility patents granted in engines, pumps, turbines, by region, country, or economy: 1998–2020 | United States Patent and Trademark Office | PatentsView |
| Table SINV-72 | USPTO utility patents granted in textile and paper machines, by region, country, or economy: 1998–2020 | United States Patent and Trademark Office | PatentsView |
| Table SINV-73 | USPTO utility patents granted in other special machines, by region, country, or economy: 1998–2020 | United States Patent and Trademark Office | PatentsView |
| Table SINV-74 | USPTO utility patents granted in thermal processes and apparatus, by region, country, or economy: 1998–2020 | United States Patent and Trademark Office | PatentsView |
| Table SINV-75 | USPTO utility patents granted in mechanical elements, by region, country, or economy: 1998–2020 | United States Patent and Trademark Office | PatentsView |
| Table SINV-76 | USPTO utility patents granted in transport, by region, country, or economy: 1998–2020 | United States Patent and Trademark Office | PatentsView |
| Table SINV-77 | USPTO utility patents granted in furniture, games, by region, country, or economy: 1998–2020 | United States Patent and Trademark Office | PatentsView |
| Table SINV-78 | USPTO utility patents granted in other consumer goods, by region, country, or economy: 1998–2020 | United States Patent and Trademark Office | PatentsView |
| Table SINV-79 | USPTO utility patents granted in civil engineering, by region, country, or economy: 1998–2020 | United States Patent and Trademark Office | PatentsView |
| Table SINV-80 | USPTO utility patents unassigned under the WIPO classification, by region, country, or economy: 1998-2020 | United States Patent and Trademark Office | PatentsView |
| Table SINV-81 | U.S. university USPTO utility patent awards, by WIPO technical field: 1998–2020 | United States Patent and Trademark Office | PatentsView |
| Table SINV-82 | Citation of S&E articles in USPTO utility patents, by cited field, cited author country, and patent sector: 2013–20 | Elsevier | Scopus |
| Table SINV-82 | Citation of S&E articles in USPTO utility patents, by cited field, cited author country, and patent sector: 2013–20 | United States Patent and Trademark Office | PatentsView |
| Table SINV-83 | Number of GitHub repositories contributed to by selected entities: 2009–19 | GitHub | GitHub Platform |
| Table SINV-84 | Number of registered USPTO trademarks, by region, country, or economy: 1998–2020 | Reed Tech, LexisNexis | USPTO Trademark Data |
| Table SINV-85 | Nice classes in trademark data, by business sector | World Intellectual Property Organization | Nice Classification |
| Table SINV-86 | Number of U.S. registered USPTO trademarks, by Nice class: 1998–2020 | Reed Tech, LexisNexis | USPTO Trademark Data |
| Table SINV-87 | Number of registered USPTO trademarks in the business sector of agriculture, by region, country, or economy: 1998–2020 | Reed Tech, LexisNexis | USPTO Trademark Data |
| Table SINV-88 | Number of registered USPTO trademarks in the business sector of business services, by region, country, or economy: 1998–2020 | Reed Tech, LexisNexis | USPTO Trademark Data |
| Table SINV-89 | Number of registered USPTO trademarks in the business sector of chemicals, by region, country, or economy: 1998–2020 | Reed Tech, LexisNexis | USPTO Trademark Data |
| Table SINV-90 | Number of registered USPTO trademarks in the business sector of clothing, by region, country, or economy: 1998–2020 | Reed Tech, LexisNexis | USPTO Trademark Data |
| Table SINV-91 | Number of registered USPTO trademarks in the business sector of construction, by region, country, or economy: 1998–2020 | Reed Tech, LexisNexis | USPTO Trademark Data |
| Table SINV-92 | Number of registered USPTO trademarks in the business sector of health, by region, country, or economy: 1998–2020 | Reed Tech, LexisNexis | USPTO Trademark Data |
| Table SINV-93 | Number of registered USPTO trademarks in the business sector of household equipment, by region, country, or economy: 1998–2020 | Reed Tech, LexisNexis | USPTO Trademark Data |
| Table SINV-94 | Number of registered USPTO trademarks in the business sector of leisure and education, by region, country, or economy: 1998–2020 | Reed Tech, LexisNexis | USPTO Trademark Data |
| Table SINV-95 | Number of registered USPTO trademarks in the business sector of research and technology, by region, country, or economy: 1998–2020 | Reed Tech, LexisNexis | USPTO Trademark Data |
| Table SINV-96 | Number of registered USPTO trademarks in the business sector of transportation, by region, country, or economy: 1998–2020 | Reed Tech, LexisNexis | USPTO Trademark Data |
| Table SINV-97 | Number of registered USPTO trademarks unassigned under the Nice classification, by region, country, or economy: 1998–2020 | Reed Tech, LexisNexis | USPTO Trademark Data |
| Table SINV-98 | Venture capital in selected countries, regions, or economies: 2000–20 | PitchBook | Venture Capital and Private Equity Database |
| Table SINV-99 | Venture capital investment by firms headquartered in the United States and in China, by industry sector: 2000–20. | PitchBook | Venture Capital and Private Equity Database |
| Table SINV-100 | PitchBook venture capital industry verticals and technologies | PitchBook | Venture Capital and Private Equity Database |