 An official website of the United States government
 Cross-National Comparisons of R&D Performance
U.S. R&D expenditures can be compared with those of other countries to illustrate the relative position of the United States in this area and its impact on economic and other national goals noted earlier. Statistics in this section cover available data from MSTI (OECD 2023c) and are reported in U.S. dollars using purchasing power parity (PPP). PPP converts different currencies to a common currency while adjusting for differences in price levels between economies, allowing for cross-country comparisons.
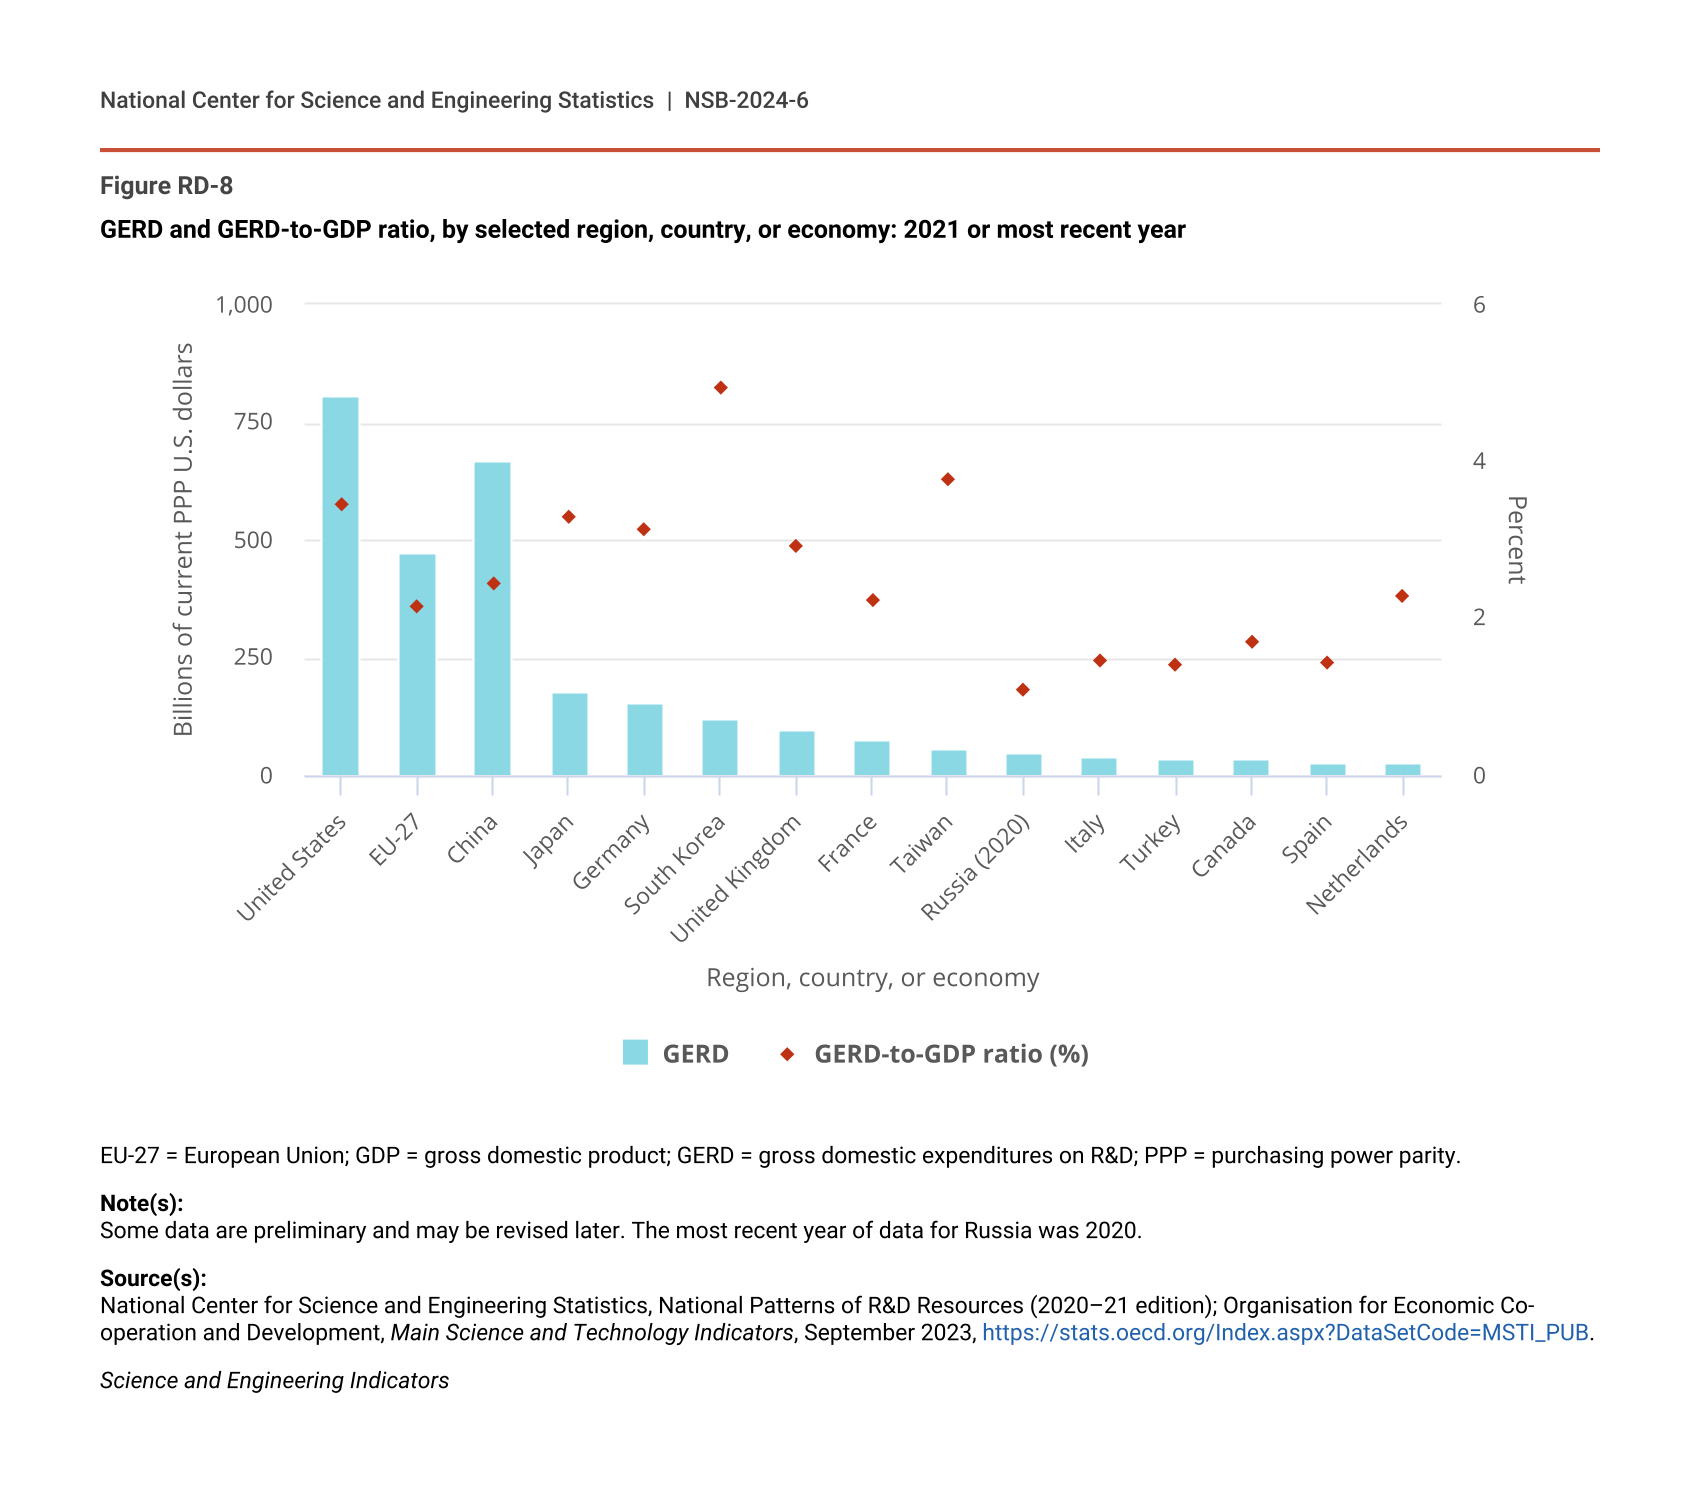
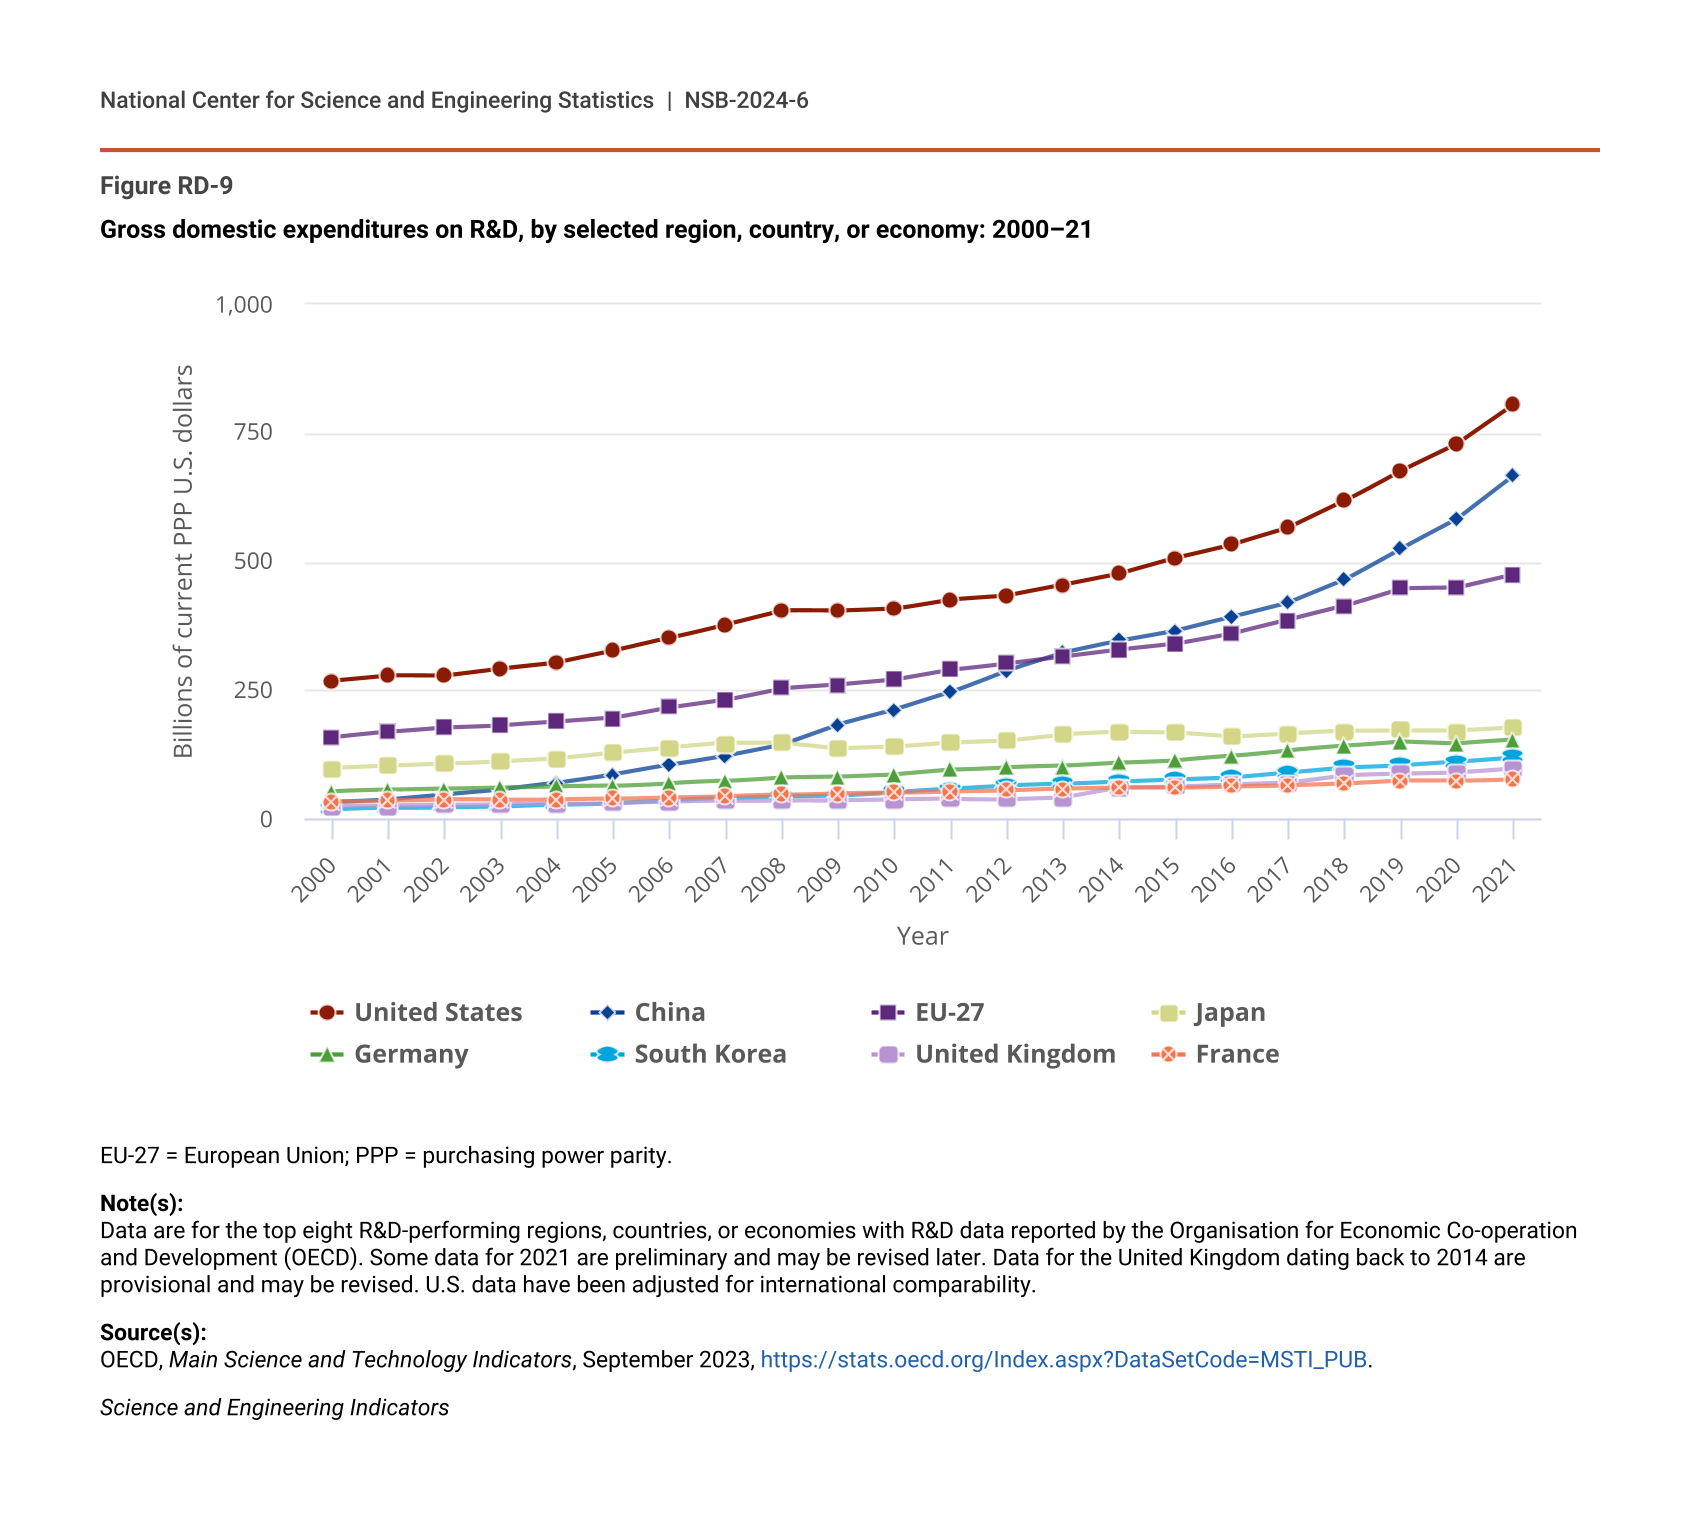
Based on internationally comparable estimates, the United States reached $806.0 billion in gross domestic expenditures on R&D (GERD) in 2021 ($709.7 billion in constant U.S. PPPs), up 10% from 2020 (6% in constant PPPs). China, the second-highest performer of domestic R&D in recent years, totaled $667.6 billion in 2021 ($620.1 billion in constant PPPs), up 14% from 2020 (10% in constant U.S. PPPs) (OECD 2023c). Other top R&D performers include Japan ($177.4 billion), Germany ($153.7 billion), South Korea ($119.6 billion), the United Kingdom ($97.8 billion), and France ($77.2 billion) in current U.S. PPP dollars (Figure RD-8, Figure RD-9; Table SRD-1).
GERD and GERD-to-GDP ratio, by selected region, country, or economy: 2021 or most recent year
| Region, country, or economy | GERD | GERD-to-GDP ratio (%) |
|---|---|---|
| United States | 806.0 | 3.46 |
| EU-27 | 474.1 | 2.16 |
| China | 667.6 | 2.43 |
| Japan | 177.4 | 3.30 |
| Germany | 153.7 | 3.13 |
| South Korea | 119.6 | 4.93 |
| United Kingdom | 97.8 | 2.91 |
| France | 77.2 | 2.22 |
| Taiwan | 55.6 | 3.77 |
| Russia (2020) | 48.0 | 1.10 |
| Italy | 40.1 | 1.45 |
| Turkey | 36.2 | 1.40 |
| Canada | 34.4 | 1.70 |
| Spain | 27.6 | 1.43 |
| Netherlands | 25.7 | 2.27 |
EU-27 = European Union; GDP = gross domestic product; GERD = gross domestic expenditures on R&D; PPP = purchasing power parity.
Note(s):
Some data are preliminary and may be revised later. The most recent year of data for Russia was 2020.
Source(s):
National Center for Science and Engineering Statistics, National Patterns of R&D Resources (2020–21 edition); Organisation for Economic Co-operation and Development, Main Science and Technology Indicators, September 2023, https://stats.oecd.org/Index.aspx?DataSetCode=MSTI_PUB.
Science and Engineering Indicators
Gross domestic expenditures on R&D, by selected region, country, or economy: 2000–21
| Year | United States | China | EU-27 | Japan | Germany | South Korea | United Kingdom | France |
|---|---|---|---|---|---|---|---|---|
| 2000 | 268.6 | 32.9 | 158.8 | 98.9 | 53.9 | 18.5 | 25.2 | 33.3 |
| 2001 | 279.1 | 38.4 | 169.2 | 103.9 | 56.2 | 21.3 | 26.3 | 36.1 |
| 2002 | 278.4 | 47.8 | 178.1 | 108.2 | 58.6 | 22.5 | 27.9 | 38.3 |
| 2003 | 292.2 | 56.9 | 182.0 | 112.4 | 61.1 | 24.1 | 28.6 | 37.2 |
| 2004 | 303.8 | 69.7 | 188.7 | 117.4 | 63.0 | 27.9 | 29.4 | 38.2 |
| 2005 | 326.2 | 86.2 | 196.3 | 128.7 | 64.0 | 30.6 | 30.6 | 39.5 |
| 2006 | 351.7 | 104.8 | 216.6 | 138.8 | 69.6 | 35.4 | 33.3 | 42.4 |
| 2007 | 378.5 | 123.4 | 231.8 | 147.6 | 73.5 | 40.6 | 35.2 | 44.2 |
| 2008 | 405.4 | 145.2 | 254.2 | 148.7 | 81.2 | 43.9 | 36.5 | 46.6 |
| 2009 | 404.2 | 184.1 | 260.6 | 137.3 | 82.7 | 45.8 | 36.4 | 49.6 |
| 2010 | 408.5 | 212.2 | 270.2 | 140.5 | 87.0 | 52.1 | 37.5 | 50.9 |
| 2011 | 427.1 | 246.5 | 289.7 | 148.4 | 95.8 | 58.4 | 38.8 | 53.6 |
| 2012 | 434.4 | 289.2 | 302.4 | 152.3 | 100.5 | 64.9 | 38.5 | 55.1 |
| 2013 | 455.1 | 323.4 | 315.6 | 164.7 | 102.9 | 68.2 | 41.5 | 58.4 |
| 2014 | 477.0 | 346.3 | 329.1 | 169.6 | 109.6 | 73.1 | 60.4 | 60.6 |
| 2015 | 507.4 | 366.1 | 340.5 | 168.5 | 114.1 | 76.9 | 63.0 | 60.5 |
| 2016 | 533.5 | 393.0 | 360.1 | 160.3 | 122.5 | 80.8 | 67.1 | 63.7 |
| 2017 | 565.7 | 420.8 | 386.6 | 166.6 | 133.7 | 90.3 | 70.8 | 65.6 |
| 2018 | 618.1 | 465.3 | 413.8 | 172.0 | 142.3 | 100.3 | 84.9 | 68.7 |
| 2019 | 677.9 | 526.2 | 448.0 | 172.3 | 151.1 | 104.0 | 87.8 | 74.6 |
| 2020 | 730.3 | 583.8 | 448.9 | 172.0 | 147.0 | 111.1 | 90.2 | 74.2 |
| 2021 | 806.0 | 667.6 | 474.1 | 177.4 | 153.7 | 119.6 | 97.8 | 77.2 |
EU-27 = European Union; PPP = purchasing power parity.
Note(s):
Data are for the top eight R&D-performing regions, countries, or economies with R&D data reported by the Organisation for Economic Co-operation and Development (OECD). Some data for 2021 are preliminary and may be revised later. Data for the United Kingdom dating back to 2014 are provisional and may be revised. U.S. data have been adjusted for international comparability.
Source(s):
OECD, Main Science and Technology Indicators, September 2023, https://stats.oecd.org/Index.aspx?DataSetCode=MSTI_PUB.
Science and Engineering Indicators
The distribution of R&D within countries presents some cross-sectional features. The business sector is the largest performer and funder of R&D across the top R&D-performing countries (Table RD-4). Across all countries with available statistics, Israel, Taiwan, and Ireland had the largest shares of R&D performed by the business sector (Table SRD-2). The government sector in many countries, including Germany and China, performed a higher share of R&D than the U.S. government sector (15% in Germany and China, compared with 8% in the United States, based on OECD GERD estimates). The R&D performance share of higher education was at least 20% in the European Union (EU-27), the United Kingdom, and France, compared with single-digit shares in China and South Korea. Table RD-4 also shows that government funded approximately 30% of R&D in Germany and France, driving the EU-27 overall share funded by this sector to 31%, compared with 20% and 19%, respectively, for the United States and China.
GERD for selected region, country, or economy, by performing sector and source of funds: 2021
NA = not available.
EU-27 = European Union; GERD = gross domestic expenditures on R&D; PPP = purchasing power parity.
a The private nonprofit sector comprises all nonprofit institutions serving households except those classified as part of the higher education sector.
b Data for U.S. GERD differ slightly from the U.S. total R&D data tabulated elsewhere in this report. For better consistency with international standards, U.S. GERD includes federal capital funding for federal intramural and nonprofit R&D, in addition to what is reported as U.S. total R&D. The data for U.S. funding from the rest of the world include funding for business R&D and academic R&D.
Note(s):
Some data are preliminary and may be revised later. Percentages may not add to 100% because of rounding. Germany's nonprofit sector expenditures are included in data for other performing sectors. Classification of sectors follows Organisation for Economic Co-operation and Development (OECD) surveys. U.S. data have been adjusted for international comparability. Foreign currencies are converted by OECD to U.S. dollars using PPP.
Source(s):
National Center for Science and Engineering Statistics, National Patterns of R&D Resources (2020–21 edition); OECD, Main Science and Technology Indicators, September 2023, https://stats.oecd.org/Index.aspx?DataSetCode=MSTI_PUB.
Science and Engineering Indicators
Global R&D and Top R&D-Performing Countries
Based on available statistics across countries, the global total for R&D expenditures was $2.6 trillion in U.S. current PPP dollars in 2021. This includes all 37 OECD members plus another 7 economies (Argentina, China, Romania, Russia, Singapore, South Africa, and Taiwan) available in the OECD R&D database (Table SRD-1). The global total for the same set of economies in 2018 was $2.1 trillion, for a CAGR of 7.8% in U.S. current PPP dollars from 2018 to 2021 (OECD 2023c).
Overall, the top 5 R&D-performing economies (the United States, China, Japan, Germany, and South Korea) accounted for 73% of the 2021 total, the top 10 for 85%, and the top 20 for 93% (Figure RD-8; Table RD-5; Table SRD-1). The EU-27 accounted for 18% of global GERD in 2021 (OECD 2023c). China’s GERD grew annually by double digits (nominal CAGR) in 2000–10 (20.5%) and in 2010–21 (11.0%), exceeding the rate of GDP growth over each of these periods, measured in U.S. current PPP dollars based on OECD MSTI statistics (Table RD-5). For the United States, the CAGR for GERD between 2000 and 2010 was 4.3%, compared with a growth rate of 3.9% for GDP over that period. For 2010–21, U.S. GERD grew 6.4% annually in nominal CAGR terms, faster than the nominal GDP growth rate of 4.1%.
GERD, GDP, GERD-to-GDP ratio, and growth rates, by selected region, country, or economy: Selected years, 1990–2021
NA = not available.
CAGR = compound annual growth rate; EU-27 = European Union; GDP = gross domestic product; GERD = gross domestic expenditures on R&D; PPP = purchasing power parity.
a Data are for 2021 or the most recent year with GERD data available.
Note(s):
The most recent year of GERD data for Russia was 2020. Data for U.S. GERD differ slightly from the U.S. total R&D data tabulated elsewhere in this report. For better consistency with international standards, U.S. GERD includes federal capital funding for federal intramural and nonprofit R&D, in addition to what is reported as U.S. total R&D. Some data are preliminary and may be revised later. Foreign currencies are converted by the Organisation for Economic Co-operation and Development (OECD) to U.S. dollars using PPP. U.S. data have been adjusted for international comparability. For more information on GERD and GDP statistics across regions, countries, or economies, see Table SRD-1.
Source(s):
National Center for Science and Engineering Statistics, National Patterns of R&D Resources (2020–21 edition); OECD, Main Science and Technology Indicators, September 2023, https://stats.oecd.org/Index.aspx?DataSetCode=MSTI_PUB.
Science and Engineering Indicators
R&D Intensities
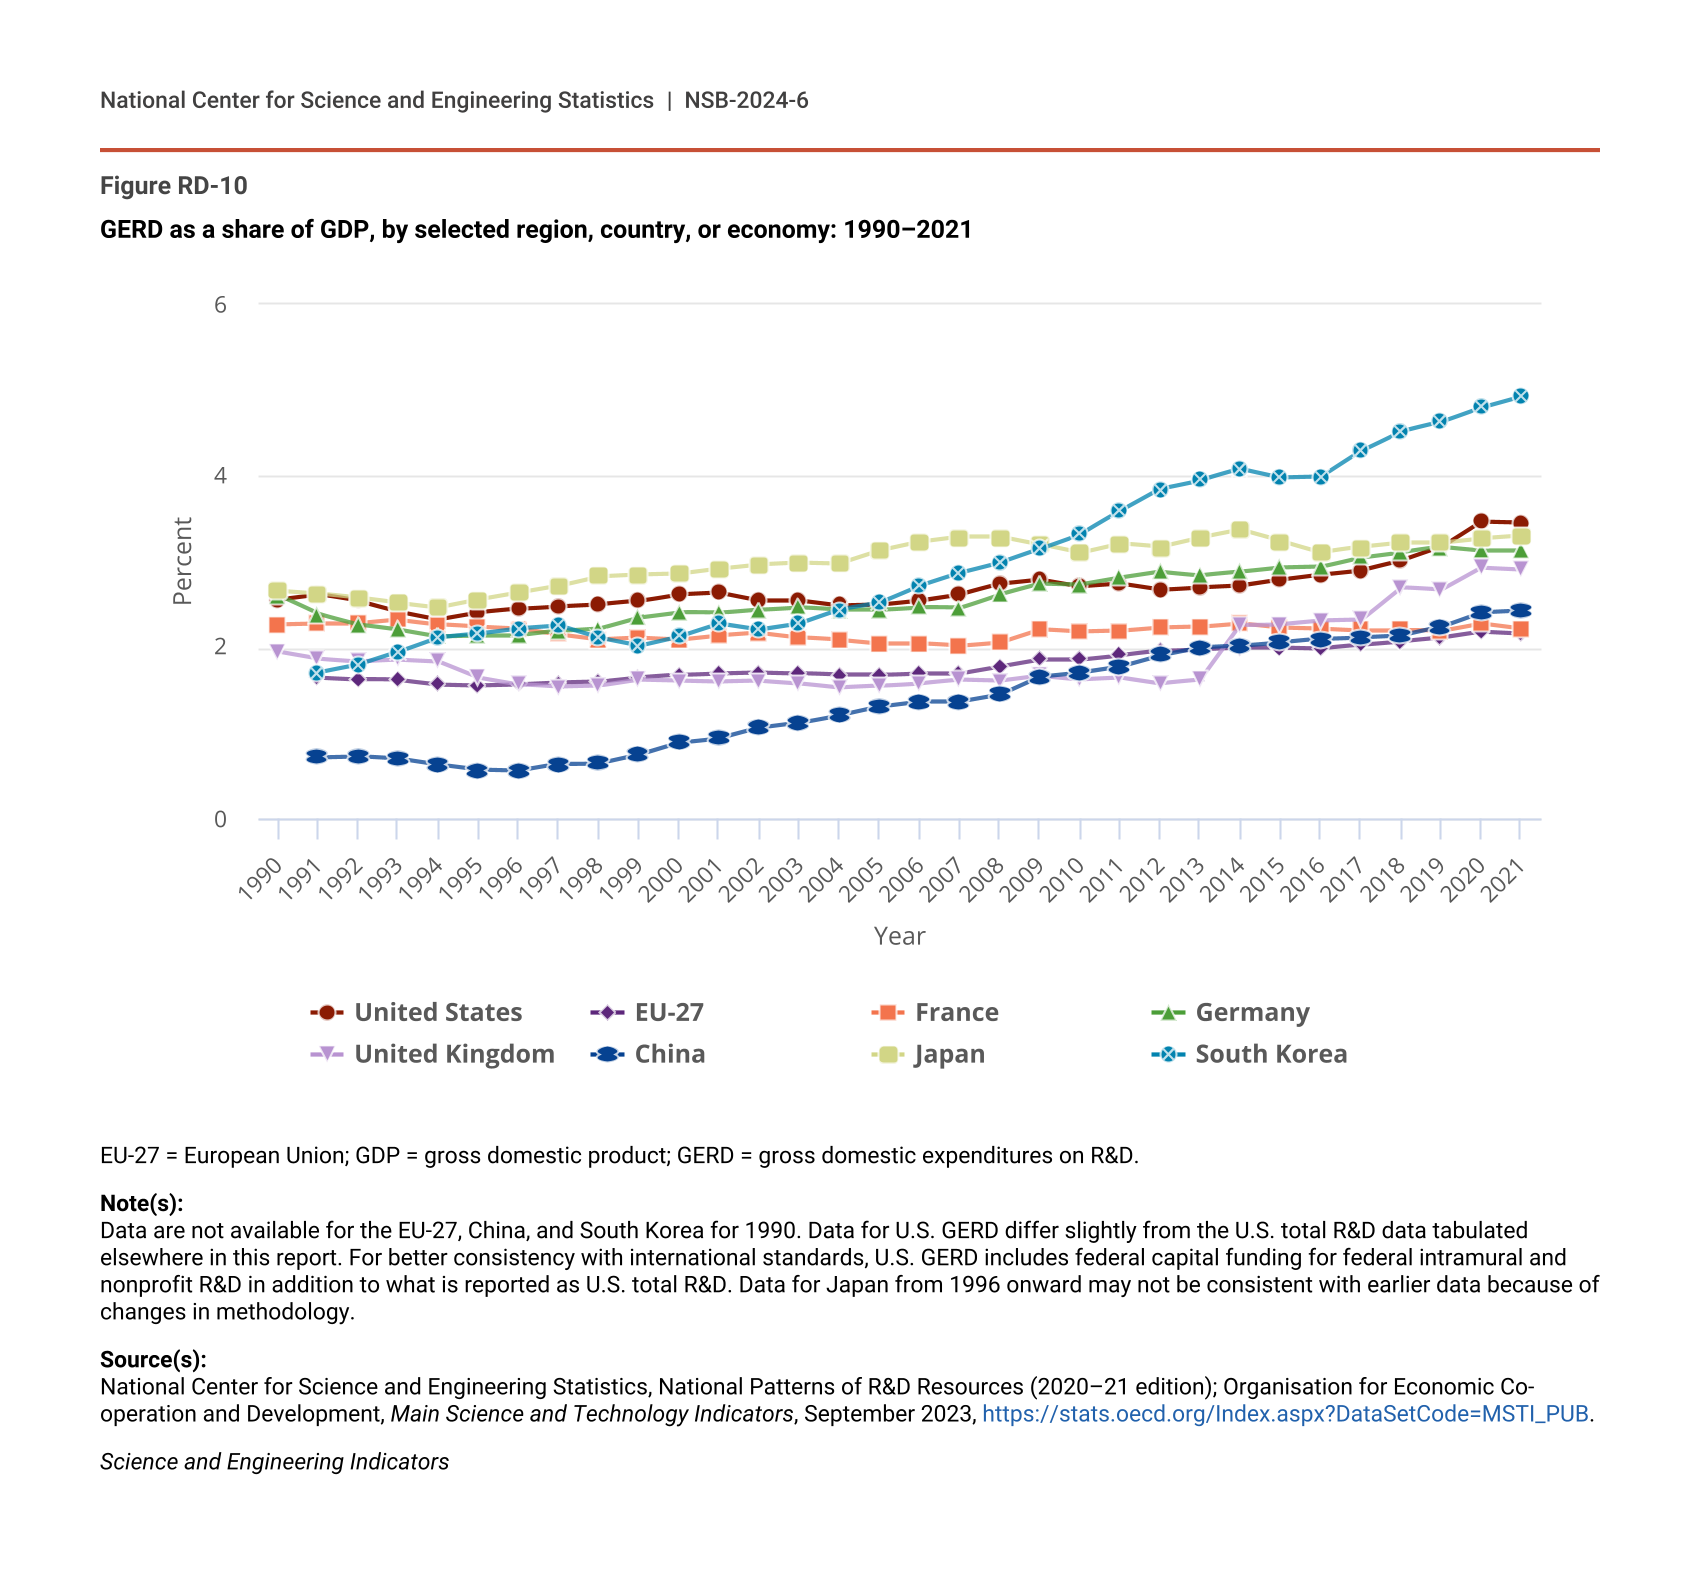
The GERD-to-GDP ratio facilitates comparisons of national investment in R&D relative to the size of the economy across countries and time (Figure RD-8, Figure RD-10). This indicator may be grouped into three size categories. Only two countries, Israel and South Korea, had R&D intensities above 4.0% in 2021 (Table SRD-1). Eight economies had intensities between 3.0% and 4.0%, including Taiwan (3.8%), the United States (3.5%), Japan (3.3%), and Germany (3.1%). And multiple countries had intensities above 2.0%, including the United Kingdom at 2.9%, China at 2.4%, France at 2.2%, and Singapore at 2.2%. The EU-27 had a ratio of 2.2% in 2021, compared with 1.9% in 2010.
GERD as a share of GDP, by selected region, country, or economy: 1990–2021
| Year | United States | EU-27 | France | Germany | United Kingdom | China | Japan | South Korea |
|---|---|---|---|---|---|---|---|---|
| 1990 | 2.56 | NA | 2.27 | 2.61 | 1.95 | NA | 2.66 | NA |
| 1991 | 2.62 | 1.65 | 2.28 | 2.39 | 1.87 | 0.72 | 2.63 | 1.71 |
| 1992 | 2.54 | 1.63 | 2.28 | 2.27 | 1.84 | 0.73 | 2.58 | 1.80 |
| 1993 | 2.42 | 1.62 | 2.32 | 2.21 | 1.86 | 0.70 | 2.52 | 1.95 |
| 1994 | 2.33 | 1.57 | 2.27 | 2.13 | 1.84 | 0.63 | 2.47 | 2.12 |
| 1995 | 2.41 | 1.56 | 2.24 | 2.14 | 1.65 | 0.57 | 2.56 | 2.16 |
| 1996 | 2.45 | 1.57 | 2.22 | 2.14 | 1.57 | 0.56 | 2.64 | 2.22 |
| 1997 | 2.48 | 1.59 | 2.15 | 2.19 | 1.54 | 0.64 | 2.72 | 2.25 |
| 1998 | 2.50 | 1.60 | 2.09 | 2.22 | 1.55 | 0.65 | 2.83 | 2.11 |
| 1999 | 2.54 | 1.65 | 2.11 | 2.35 | 1.62 | 0.75 | 2.85 | 2.02 |
| 2000 | 2.62 | 1.68 | 2.09 | 2.41 | 1.61 | 0.89 | 2.86 | 2.13 |
| 2001 | 2.64 | 1.70 | 2.14 | 2.40 | 1.60 | 0.94 | 2.92 | 2.28 |
| 2002 | 2.55 | 1.71 | 2.17 | 2.44 | 1.61 | 1.06 | 2.97 | 2.21 |
| 2003 | 2.55 | 1.70 | 2.12 | 2.47 | 1.58 | 1.12 | 2.99 | 2.28 |
| 2004 | 2.49 | 1.68 | 2.09 | 2.44 | 1.53 | 1.21 | 2.98 | 2.44 |
| 2005 | 2.50 | 1.68 | 2.05 | 2.44 | 1.55 | 1.31 | 3.13 | 2.52 |
| 2006 | 2.55 | 1.70 | 2.05 | 2.47 | 1.58 | 1.37 | 3.23 | 2.72 |
| 2007 | 2.62 | 1.70 | 2.02 | 2.46 | 1.62 | 1.37 | 3.29 | 2.87 |
| 2008 | 2.74 | 1.78 | 2.06 | 2.62 | 1.61 | 1.45 | 3.29 | 2.99 |
| 2009 | 2.79 | 1.86 | 2.21 | 2.74 | 1.67 | 1.66 | 3.20 | 3.15 |
| 2010 | 2.71 | 1.86 | 2.18 | 2.73 | 1.63 | 1.71 | 3.10 | 3.32 |
| 2011 | 2.74 | 1.91 | 2.19 | 2.81 | 1.65 | 1.78 | 3.21 | 3.59 |
| 2012 | 2.67 | 1.96 | 2.23 | 2.88 | 1.58 | 1.91 | 3.17 | 3.85 |
| 2013 | 2.70 | 1.98 | 2.24 | 2.84 | 1.62 | 2.00 | 3.28 | 3.95 |
| 2014 | 2.72 | 2.00 | 2.28 | 2.88 | 2.26 | 2.02 | 3.37 | 4.08 |
| 2015 | 2.79 | 2.00 | 2.23 | 2.93 | 2.27 | 2.06 | 3.24 | 3.98 |
| 2016 | 2.85 | 1.99 | 2.22 | 2.94 | 2.31 | 2.10 | 3.11 | 3.99 |
| 2017 | 2.90 | 2.03 | 2.20 | 3.05 | 2.32 | 2.12 | 3.17 | 4.29 |
| 2018 | 3.01 | 2.07 | 2.20 | 3.11 | 2.70 | 2.14 | 3.22 | 4.52 |
| 2019 | 3.17 | 2.11 | 2.19 | 3.17 | 2.67 | 2.24 | 3.22 | 4.63 |
| 2020 | 3.47 | 2.18 | 2.28 | 3.13 | 2.93 | 2.41 | 3.27 | 4.80 |
| 2021 | 3.46 | 2.16 | 2.22 | 3.13 | 2.91 | 2.43 | 3.30 | 4.93 |
EU-27 = European Union; GDP = gross domestic product; GERD = gross domestic expenditures on R&D.
Note(s):
Data are not available for the EU-27, China, and South Korea for 1990. Data for U.S. GERD differ slightly from the U.S. total R&D data tabulated elsewhere in this report. For better consistency with international standards, U.S. GERD includes federal capital funding for federal intramural and nonprofit R&D in addition to what is reported as U.S. total R&D. Data for Japan from 1996 onward may not be consistent with earlier data because of changes in methodology.
Source(s):
National Center for Science and Engineering Statistics, National Patterns of R&D Resources (2020–21 edition); Organisation for Economic Co-operation and Development, Main Science and Technology Indicators, September 2023, https://stats.oecd.org/Index.aspx?DataSetCode=MSTI_PUB.
Science and Engineering Indicators