 An official website of the United States government
 R&D Performance, by Application Area
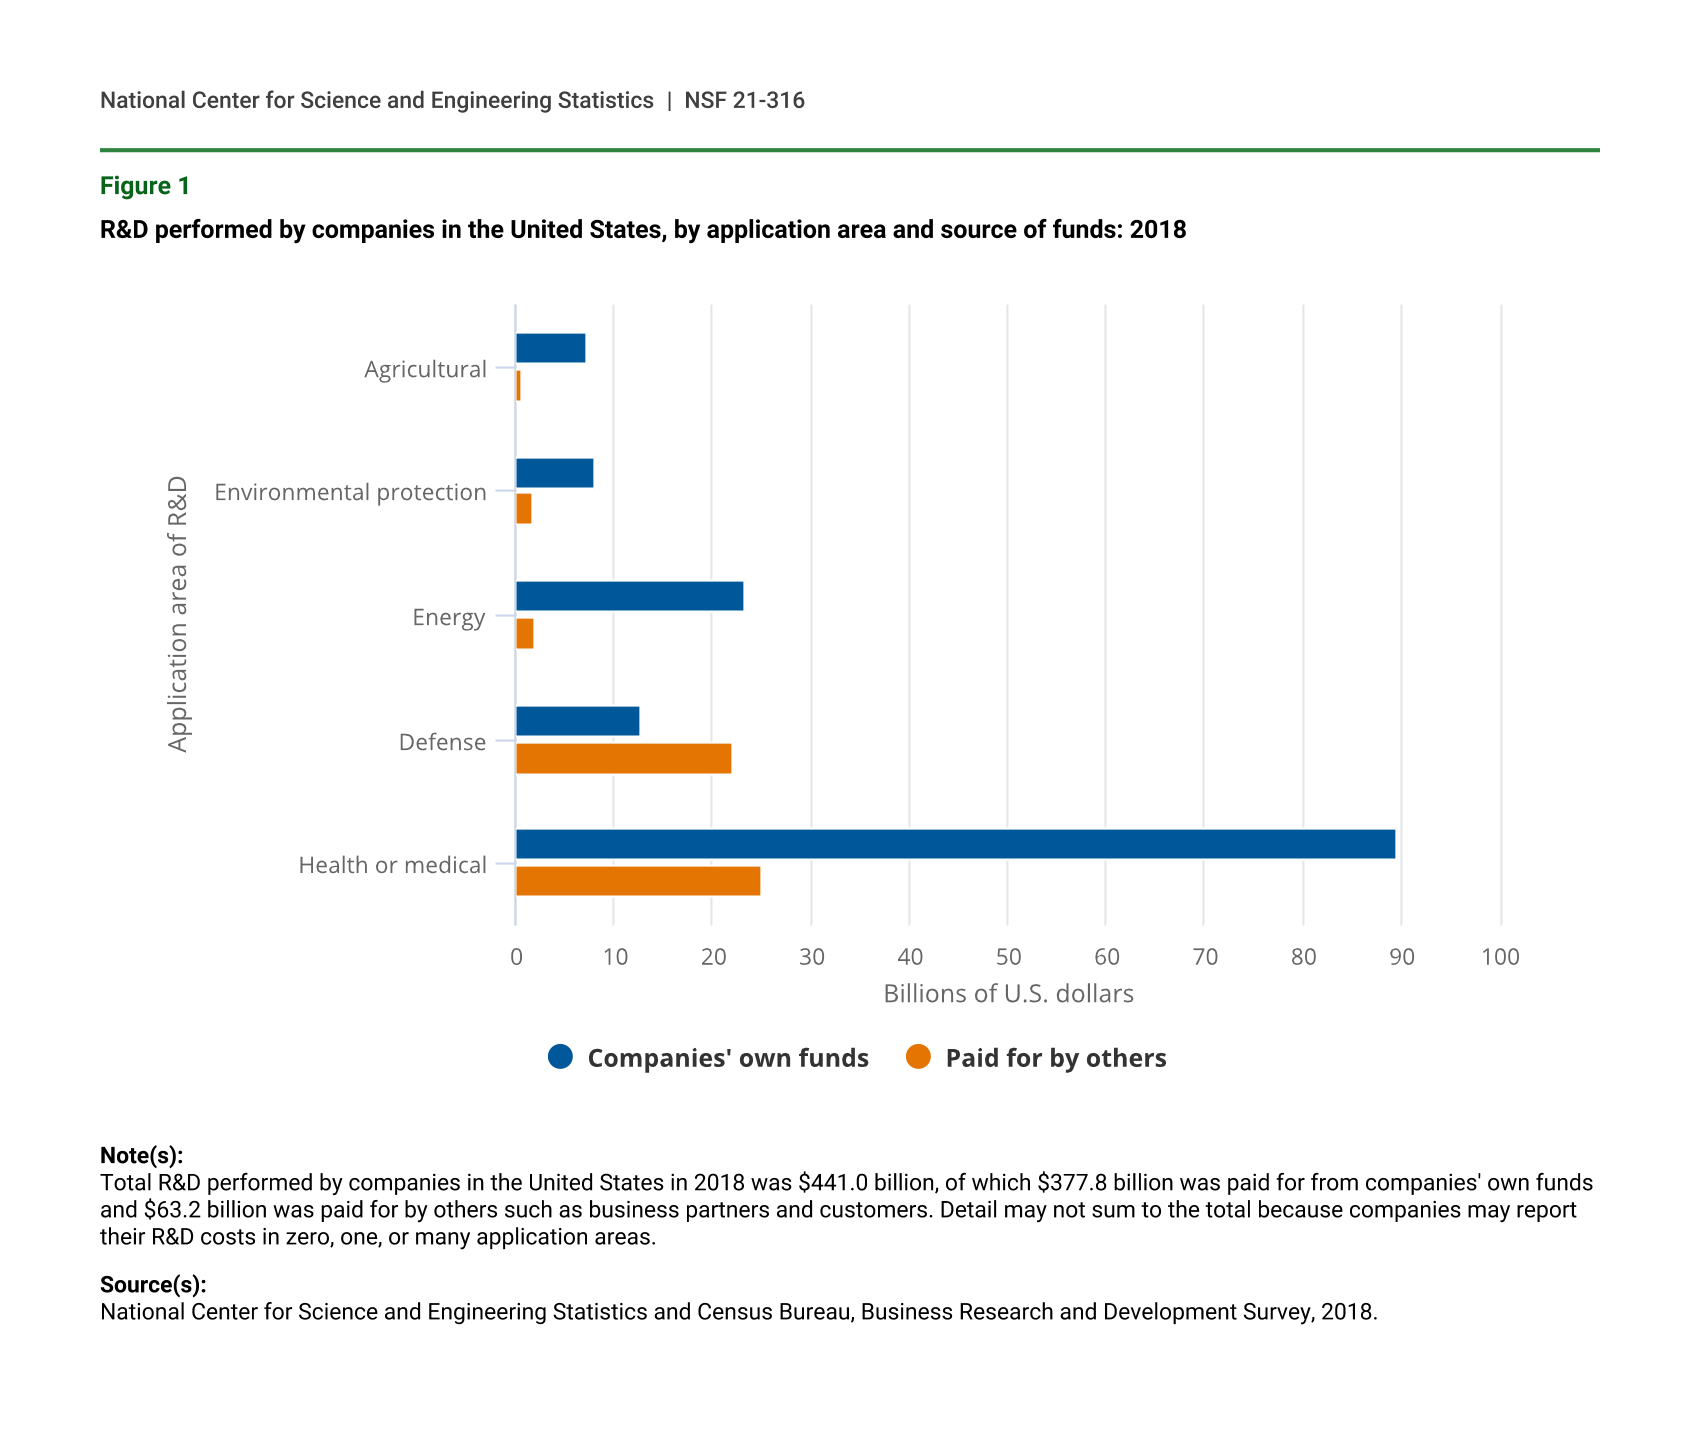
The R&D performed by businesses in the United States is funded primarily by the performing companies themselves ($377.8 billion, or 86%), while the remainder ($63.2 billion, or 14%) is paid for by others, such as the federal government, customers, and the affiliates and owners of foreign-owned companies operating in the United States. Figure 1 shows the amount of R&D performed by companies for each application area, by source of funds. Unlike the other application areas, most (63%) of the R&D with defense applications that was performed by businesses was paid for by others—primarily the federal government—not by the performing companies themselves. Although companies are estimated to have performed $12.7 billion of R&D with defense applications that are paid for out of their own R&D budgets, the federal government allows companies to recoup some of these costs. In particular, some costs for R&D in specific areas of strategic interest to the Department of Defense may be charged on existing government contracts as a general and administrative expense. BRDS estimated U.S. companies had almost $7 billion of such independent research and development (IR&D) in 2018, which would be reported on BRDS as companies’ own funding and not funding from the federal government. Business R&D performed for agriculture and energy applications is almost entirely paid for by the R&D-performing companies themselves, whereas R&D with environmental protection applications had relatively more external funding.
R&D performed by companies in the United States, by application area and source of funds: 2018
| Application area of R&D | Companies' own funds | Paid for by others |
|---|---|---|
| Agricultural | 7.3 | 0.6 |
| Environmental protection | 8.0 | 1.8 |
| Energy | 23.3 | 1.9 |
| Defense | 12.7 | 22.1 |
| Health or medical | 89.6 | 24.9 |
Note(s):
Total R&D performed by companies in the United States in 2018 was $441.0 billion, of which $377.8 billion was paid for from companies' own funds and $63.2 billion was paid for by others such as business partners and customers. Detail may not sum to the total because companies may report their R&D costs in zero, one, or many application areas.
Source(s):
National Center for Science and Engineering Statistics and Census Bureau, Business Research and Development Survey, 2018.
R&D with health or medical applications was more concentrated in a small number of industries than was R&D in most other application areas (table 1). Three industries performed 86% of R&D with health or medical applications: pharmaceuticals and medicines manufacturing (North American Industry Classification System [NAICS] code 3254), scientific R&D services (NAICS 5417), and miscellaneous manufacturing (NAICS 339). Pharmaceutical manufacturing is one of the largest industries by R&D performance in the United States and accounts for 17% of total U.S. business R&D performance and 62% of the R&D with health-related applications performed by businesses. The scientific R&D services industry performed 13% of the R&D with health or medical applications performed by businesses—largely in the form of services such as administering clinical trials for makers of drugs. Companies classified in the medical equipment and supplies manufacturing industry (NAICS 3391) account for almost all the R&D with health or medical applications that are reported for miscellaneous manufacturing.
Defense, the second largest application area tracked by BRDS, is performed primarily by federal contractors classified in the transportation equipment (NAICS 336) industry group. This industry group along with the computer and electronic products (NAICS 334) industry group and the professional and scientific services (NAICS 54) sector accounted for 94% of business defense R&D in 2018. Business R&D with agriculture, energy, or environmental protection applications did not have a single industry or industry group that accounted for over half their R&D.
Business R&D performed in the United States, by application area and selected industry: 2018
i = more than 50% of the estimate is a combination of imputation and reweighting to account for nonresponse.
NAICS = North American Industry Classification System; nec = not elsewhere classified.
Note(s):
Industry detail may not add to total because of rounding. Statistics are representative of companies located in the United States that performed or funded $50,000 or more of R&D. Industry classification was based on dominant business code for domestic R&D performance, where available. For companies that did not report business codes, the classification used for sampling was assigned. Application areas are not mutually exclusive as companies could report R&D in one, more than one, or no application area. Additional industry-level data can be found in the full set of Business Research and Development Survey data tables.
Source(s):
National Center for Science and Engineering Statistics and Census Bureau, Business Research and Development Survey, 2018.
Biotechnology Business R&D
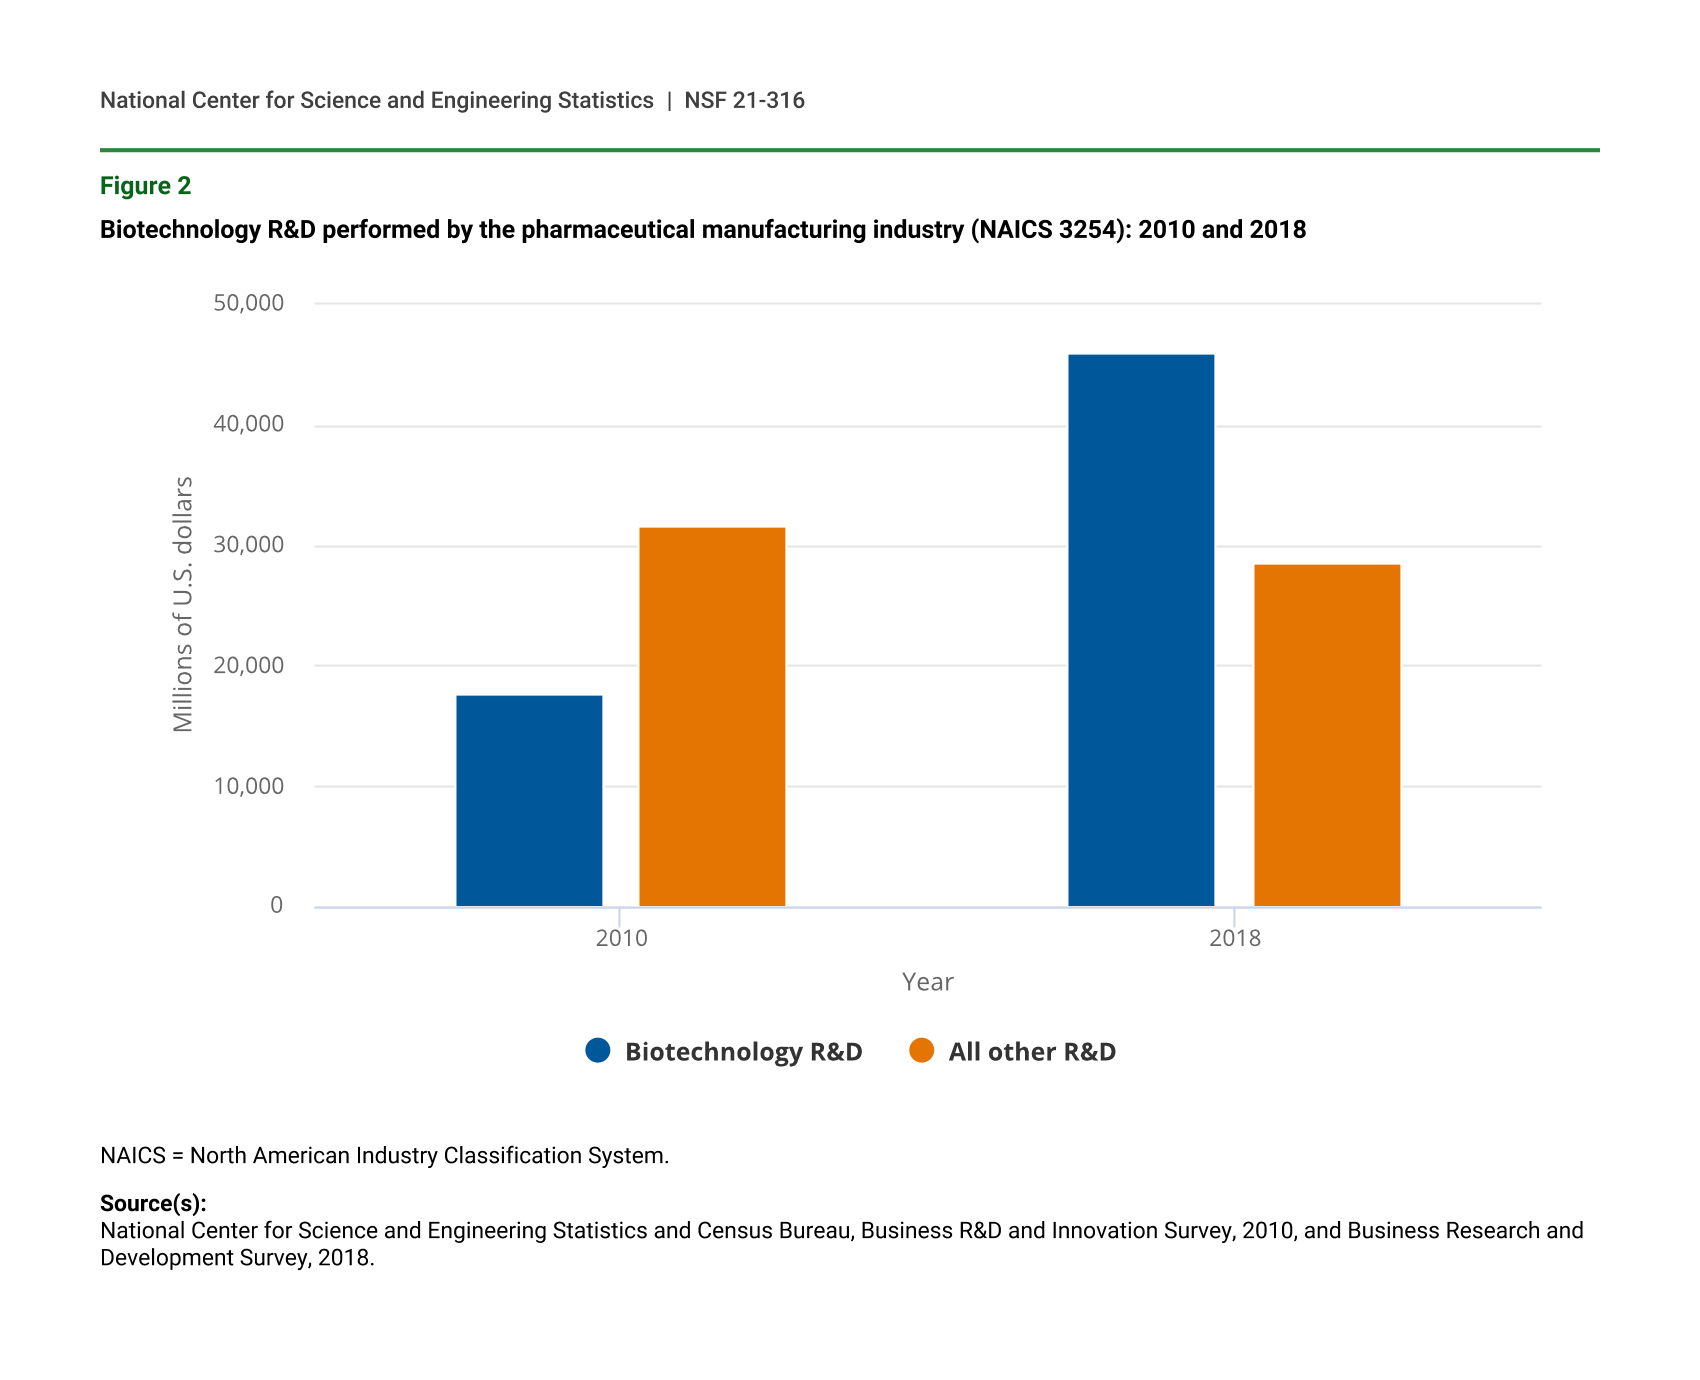
Total business R&D performance in the United States has grown from $290.7 billion in 2008 when BRDS was piloted to $441.0 billion in 2018, but the share of this R&D estimated to be for health and medical applications in these 2 years is the same: 26%. However, other information collected by BRDS indicates that the technology focus of this R&D has changed over this period. R&D with a focus on biotechnology, which is concentrated in the same industries as health and medical applications, has grown substantially over the past decade. The basic definition for biotechnology used by BRDS is the application of science and technology to living organisms, as well as parts, products, and models thereof, to alter living or non-living materials for the production of knowledge, goods, and services. This includes a wide range of applications from brewing to bioinformatics, but in the present, it is most commonly associated with the development of large-molecule drugs (complex proteins with therapeutic effects) and other biologics (products derived from human, animal, or microorganisms via biotechnology).
In 2010, the first year the estimates are directly comparable, companies performed $27.4 billion of R&D in the United States with a focus on biotechnology, or 10% of their overall $279 billion domestic R&D performance. In 2018, $62.9 billion (14%) out of the total $441 billion domestic R&D performance was for biotechnology. Within the pharmaceutical industry the share of R&D focused on biotechnology grew from 36% ($17.7 billion out of $49.4 billion) in 2010 to 62% ($46.0 billion out of $74.6 billion) in 2018 (figure 2). The results of increased investment in biotechnology R&D is evident in the number and share of biologic drugs approved by the Food and Drug Administration (FDA). A review of these drug approvals showed that 7% of the 209 drugs approved from 2000 to 2008 were biologics whereas, 16% of the 302 drugs approved from 2009 to 2017 were biologics (Batta, Kalra, and Khirasaria 2020).
Biotechnology R&D performed by the pharmaceutical manufacturing industry (NAICS 3254): 2010 and 2018
| Year | Biotechnology R&D | All other R&D |
|---|---|---|
| 2010 | 17,681 | 31,734 |
| 2018 | 46,023 | 28,569 |
NAICS = North American Industry Classification System.
Source(s):
National Center for Science and Engineering Statistics and Census Bureau, Business R&D and Innovation Survey, 2010, and Business Research and Development Survey, 2018.
Software R&D
Expenditures on software R&D have grown at a higher rate than overall business R&D expenditures for more than a decade (Moris 2019). This trend continued in 2018 as businesses performed $165.6 billion of software R&D in 2018—38% of the total (table 2). Although much of this software R&D is performed in information and communications technologies (ICT) industries, such as semiconductor manufacturing (NAICS 3344) and software publishing (NAICS 5112), it is much less concentrated by industry than are the other technologies (biotechnology and nanotechnology) tracked by BRDS.
Business R&D performed in the United States, by technology focus, selected industry, and company size: 2018
i = more than 50% of the estimate is a combination of imputation and reweighting to account for nonresponse.
NAICS = North American Industry Classification System; nec = not elsewhere classified.
a Beginning in survey year 2018, these statistics include an adjustment to the weight to account for unit nonresponse. A company having multiple reporting parts for data collection may contribute to the statistics for multiple industries, so the detail may not add to the total for the number of companies.
b Business Research and Development Survey does not include companies with fewer than 10 domestic employees.
Note(s):
Technology focus categories may not sum to the total because companies may report their R&D costs in zero, one, or many categories. Industry and company size category detail may not add to total because of rounding. Statistics are representative of companies located in the United States that performed or funded $50,000 or more of R&D. Industry classification was based on dominant business code for domestic R&D performance, where available. For companies that did not report business codes, the classification used for sampling was assigned. Technologies are not mutually exclusive as companies could report R&D in one, more than one, or no technology focus. Additional industry-level data can be found in the full set of BRDS detailed statistical tables posted online.
Source(s):
National Center for Science and Engineering Statistics and U.S. Census Bureau, Business Research and Development Survey, 2018.
Overall, of the approximately 26,000 companies with 10 or more employees that performed R&D in 2018, 42% are estimated to have performed software R&D. When analyzing data by the size of the companies (in terms of domestic employment) the share of companies with software R&D is highest among the very smallest companies (10–19 employees) and the very largest companies (25,000 or more employees). Fifty percent of companies in both of these size categories are estimated to have performed software R&D, whereas 35% of companies with 250–499 employees were estimated to have performed software R&D in 2018. This pattern reflects the fact that there are relatively more companies in nonmanufacturing industries in the smallest and largest size categories, and nonmanufacturing industries tend to have higher rates of software R&D performance than do manufacturing industries. Nonmanufacturing industries account for over half of the companies with 10–19 employees and with 25,000 or more employees, but just over a third of the companies with 250–499 employees.
Data Sources and Limitations
In this InfoBrief, money amounts are expressed in current U.S. dollars and are not adjusted for inflation. A company is defined as a business organization located in the United States, either U.S. owned or a U.S. affiliate of a foreign parent company, of one or more establishments under common ownership or control.
The sample for BRDS is selected to represent all for-profit, nonfarm companies that were publicly or privately held and had 10 or more employees in the United States. Because the statistics from the surveys are based on samples, they are subject to both sampling and nonsampling errors (see technical notes in the data tables reports at https://www.nsf.gov/statistics/srvyindustry/).
Beginning in survey year 2018, companies that performed or funded less than $50,000 of R&D were excluded from tabulation. In prior years, companies that performed or funded any amount of R&D were tabulated. These companies in aggregate represented a very small share of total R&D expenditures in prior years. Had the companies under this threshold been included in the 2018 estimates, they would have contributed approximately $90 million to the overall $441 billion R&D expenditure total.
Notes
1The application area and technology focus categories collected by BRDS are neither mutually exclusive nor exhaustive. Companies may report their R&D in zero, one, or many categories and thus the sum of the categories do not necessarily equal the survey’s total R&D estimate.
2BRDS classifies each company into one industry based on the business activity that accounts for the most domestic R&D performance. This means that, for example, a company that makes both pharmaceuticals (NAICS 3254) and food products (NAICS 311) would have its total R&D for both lines of business reported in only one of those two NAICS codes.
3BRDS was named the Business R&D and Innovation Survey (BRDIS) in 2008.
4In 2008 and 2009, companies were asked to report biotechnology R&D that was paid for by the reporting companies (respondents were not asked about biotechnology R&D paid for by others). Of the $232.5 billion domestic R&D performance paid for by the companies themselves in 2008 it is estimated $19.8 billion (8.5%) was for biotechnology.
References
Batta A, Kalra BS, Khirasaria R. 2020. Trends in FDA drug approvals over last 2 decades: An observational study. Journal of Family Medicine and Primary Care 9(1):105–14. Available at https://www.ncbi.nlm.nih.gov/pmc/articles/PMC7014862/.
Moris F, National Center for Science and Engineering Statistics (NCSES). 2019. Software R&D: Revised Treatment in U.S. National Accounts and Related Trends in Business R&D Expenditures. NSF 19-315. Alexandria, VA: National Science Foundation. Available at https://www.nsf.gov/statistics/2019/nsf19315/.
Suggested Citation
Shackelford B and Wolfe R; National Center for Science and Engineering Statistics (NCSES). 2020. Health-Related Applications Account for One-Quarter of 2018 U.S. Business R&D; Most Pharmaceutical R&D Focused on Biotechnology. NSF 21-316. Alexandria, VA: National Science Foundation. Available at https://ncses.nsf.gov/pubs/nsf21316.
Contact Us
NCSES
National Center for Science and Engineering Statistics
Directorate for Social, Behavioral and Economic Sciences
National Science Foundation
2415 Eisenhower Avenue, Suite W14200
Alexandria, VA 22314
Tel: (703) 292-8780
FIRS: (800) 877-8339
TDD: (800) 281-8749
E-mail: ncsesweb@nsf.gov