 An official website of the United States government
Trends for Graduate Student Enrollment and Postdoctoral Appointments in Science, Engineering, and Health Fields at U.S. Academic Institutions between 2017 and 2019
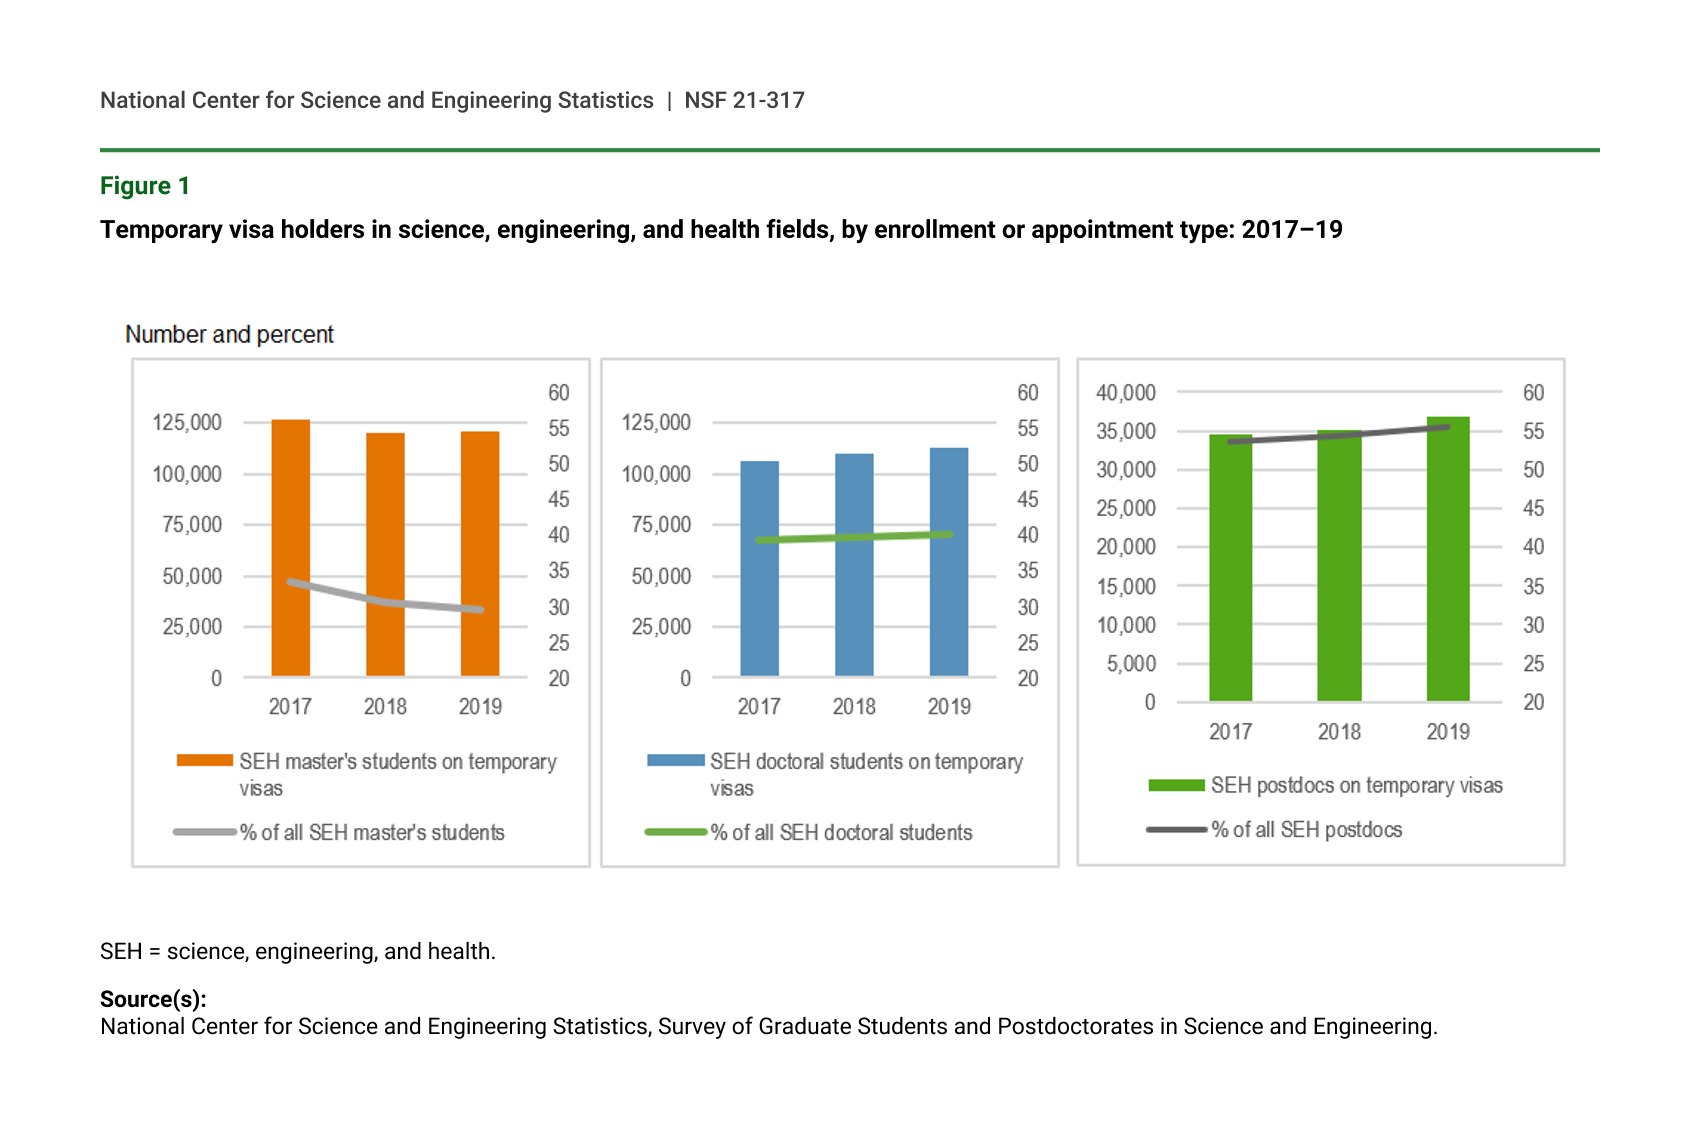
In 2019, there were 408,228 master’s students, 281,889 doctoral students, 66,247 postdoctoral researchers (postdocs), and 30,349 doctorate-holding nonfaculty researchers (NFRs) in science, engineering, and health (SEH) fields at U.S. academic institutions. Between 2017 and 2019, the number of individuals receiving advanced SEH training at U.S. academic institutions increased by 29,641 master’s students (7.8%), 11,364 doctoral students (4.2%), and 1,514 postdocs (2.3%). Nearly one-third of SEH master’s students, two-fifths of doctoral students, and more than half of postdocs were temporary visa holders in 2017 and 2019 (figure 1). The number of international students enrolled in U.S. academic institutions across all fields and degree levels declined between 2017 and 2019, and the Survey of Graduate Students and Postdoctorates in Science and Engineering (GSS) shows that within graduate SEH programs this decline among temporary visa holders was limited to master’s degree enrollment. The number and proportion of temporary visa holders enrolled in master’s-level SEH programs declined by almost 4 percentage points from 2017 to 2019 (figure 1, table 1). In contrast, from 2017 to 2019, U.S. doctoral and postdoctoral training programs in SEH expanded the ranks of temporary visa holders, by 1 and 2 percentage points, respectively (figure 1, table 1).
These and other findings in this report are from the 2017 through 2019 GSS. Data from the GSS provide insight into the composition of the current and future science and engineering (S&E) workforce by collecting data on graduate students in SEH fields, postdoctoral appointees, and doctorate-holding NFRs. The GSS is sponsored by the National Center for Science and Engineering Statistics (NCSES) within the National Science Foundation (NSF) and by the National Institutes of Health (NIH).
Temporary visa holders in science, engineering, and health fields, by enrollment or appointment type: 2017–19
SEH = science, engineering, and health.
Source(s):
National Center for Science and Engineering Statistics, Survey of Graduate Students and Postdoctorates in Science and Engineering.
Master’s students, doctoral students, and postdocs in science, engineering, and health fields, by sex, citizenship, ethnicity, and race: 2017–19
a Race and ethnicity data are available for U.S. citizens and permanent residents only.
Source(s):
National Center for Science and Engineering Statistics, Survey of Graduate Students and Postdoctorates in Science and Engineering.
Trends in Graduate Enrollment and Postdoc Appointments
The total number of SEH graduate students with temporary visas remained relatively stable between 2017 and 2019, increasing by just 0.4%. The small change in the combined count masks opposing changes within master’s and doctoral programs. As stated earlier, the number of SEH master’s students with temporary visas declined, whereas the corresponding number of SEH doctoral students increased (table 1).
The decline between 2017 and 2019 in the number and proportion of temporary visa holders among SEH master’s students was driven largely by an 8.4% decrease in the number of men with temporary visas who enrolled in master’s programs. Most of this decline (-7.5%) in male temporary visa holder master’s program enrollment occurred between 2017 and 2018. The number of female temporary visa holders in master’s programs, however, increased by 2.0% between 2017 and 2019. This shift represents a decrease in the gender enrollment gap among temporary visa holders with men still comprising the majority (61.3%) of temporary visa holders in master’s programs in 2019, down from 63.8% in 2017.
In contrast to the decline in master’s enrollments, the number of doctoral students and postdocs with temporary visas increased between 2017 and 2019. The number of doctoral students and postdocs with temporary visas increased more among women than among men. The number of female doctoral students with temporary visas increased by 9.3%, compared to a 4.9% increase among men. The number of female postdocs with temporary visas increased by 8.7%, compared to a 4.9% increase among men between 2017 and 2019. Nevertheless, just over one-third of doctoral students and postdocs with temporary visas were women over the 3-year period (table 1).
Demographic Trends
The National Science Board’s Vision 2030 identifies a critical need for more women, Hispanic or Latino, and Black or African American individuals in the S&E pipeline and workforce. Among all SEH master’s and doctoral students, female enrollment increased more than male enrollment between 2017 and 2019 (11.1% compared to 2.4%). An increase of 18.0% in female U.S. citizen and permanent resident master’s degree enrollment, compared to a 9.8% increase in male enrollment was primarily responsible for the overall increase in female graduate student enrollment. The number of male U.S. citizen and permanent resident doctoral students remained relatively stable, increasing by only 0.2%, while female enrollment increased by 5.7%. These changes resulted in an increase of 2 percentage points in the female share of total graduate student enrollment, thus shrinking the gender gap among SEH graduate students between 2017 and 2019 (table 1).
Among SEH master’s students, doctoral students, and postdocs who were U.S. citizens and permanent residents, the number who were Hispanic or Latino increased by 21.8% between 2017 and 2019. This follows a decade-long (2006 to 2016) increase in Hispanic or Latino students earning S&E bachelor’s degrees. Thus, the increasing diversity of undergraduate completions is apparent in the current graduate enrollment trends.
Overall Growth in Postdocs
The 66,247 postdocs reported in 2019 is the largest number of postdocs ever reported to the GSS. This represents a 2.3% increase in SEH postdocs between 2017 and 2019, mainly due to the 6.3% increase in temporary visa holders, but also because of a small 1.1% increase in the number of female U.S. citizen and permanent resident postdocs. The total number of U.S. citizen and permanent resident postdocs declined by 2.2% due to a 4.9% decline in male U.S. citizen and permanent resident postdocs between 2017 and 2019 (table 1).
Field of Study and Research Trends
Between 2017 and 2019, master’s and doctoral enrollment and the number of postdocs changed in different ways across SEH fields of study (table 2). In engineering, master’s enrollments declined by 5.0%, while doctoral enrollment and the number of postdocs increased by 4.7% and 5.4%, respectively. This pattern repeats in five out of the nine engineering fields, including electrical, electronics, and communications engineering; mechanical engineering; civil engineering; industrial and manufacturing engineering; and metallurgical and materials engineering. The increase in the number of doctoral students and postdocs in these fields reflects an increasing research capacity in engineering (table 3).
Master's students, doctoral students, and postdoctoral appointees in science, engineering, and health fields, by broad field: 2017–19
a Other engineering includes aerospace, aeronautical, and astronautical engineering; agricultural engineering; biological and biosystems engineering; mining engineering; nanotechnology; nuclear engineering; petroleum engineering; and engineering not elsewhere classified.
Note(s):
Broad field refers to the field of the unit that reports postdocs and graduate students.
Source(s):
National Center for Science and Engineering Statistics, Survey of Graduate Students and Postdoctorates in Science and Engineering.
Doctorate-holding nonfaculty researchers in science, engineering, and health fields, by sex and broad field: 2017–19
a Other engineering includes aerospace, aeronautical, and astronautical engineering; agricultural engineering; biological and biosystems engineering; mining engineering; nanotechnology; nuclear engineering; petroleum engineering; and engineering not elsewhere classified.
Note(s):
Broad field refers to the field of the unit that reports doctorate-holding nonfaculty researchers.
Source(s):
National Center for Science and Engineering Statistics, Survey of Graduate Students and Postdoctorates in Science and Engineering.
Master’s enrollment in the sciences grew faster than doctoral enrollment and postdoctoral appointments between 2017 and 2019, but the growth was uneven across fields and degree types. The top five fields of growth among master’s science students, was led by psychology with a 37.8% increase in enrollment, followed by multidisciplinary and interdisciplinary studies (18.5%), mathematics and statistics (18.3%), biological and biomedical sciences (12.2%), and computer and information sciences (11.2%). The 4.0% increase in doctoral enrollment in the sciences was led by a 20.3% increase in computer and information sciences students. Biological and biomedical sciences, the single largest field of study among doctoral students, also grew by 5.1% to 53,915 students between 2017 and 2019 (table 2).
Biological and biomedical sciences is not only the largest field of study among doctoral students in U.S. academic institutions granting SEH advanced degrees, with 19.1% of SEH doctoral enrollment in 2019, but it also includes one-third of SEH postdocs in these institutions. Since 2017, health sciences units added 825 new postdocs, which is 54.5% of all SEH postdocs added between 2017 and 2019. The large percentage increase in the number of postdocs in social sciences (30.8%) stands in sharp contrast to the relatively stable social sciences enrollment among doctoral students (0.9%) and the moderate increase (5.8%) among master’s students between 2017 and 2019 (table 2).
Doctorate-Holding Nonfaculty Researchers
In contrast to postdoc positions, which provide additional training for early career researchers, NFRs hold nontenured staff research positions that do not have the terms of their employment limited by position duration or the number of years since earning a doctoral degree or equivalent credential. From 2017 to 2019, the number of NFRs reported to the GSS grew by 7.7%, representing an increase of 2,169 doctorates engaged in research outside of faculty rank or tenure. Unlike the rate of growth observed among postdocs and graduate students between 2017 and 2019, the number of male NFRs grew at a faster rate than the number of female NFRs between 2017 and 2019 (8.4% compared to 6.6%). In 2019, almost 60% of NFRs were male (table 3).
Rates of growth in the number of NFRs between 2017 and 2019 in various S&E fields of research varied widely, with the largest percentage increase being 59.9% in natural resources and conservation. At the other end of the range, the number of NFRs in engineering science, mechanics, and physics declined by 7.0% (table 3).
Data Source and Limitations
Conducted since 1966, the GSS is an annual survey of all academic institutions in the United States that grant research-based master’s or doctoral degrees in SEH fields. The 2019 GSS collected data from 20,249 organizational units (departments, programs, affiliated research centers, and health care facilities) at 714 eligible institutions and their affiliates in the United States, Puerto Rico, and Guam. The unit response rate was 97.4%. An overview of the survey is available at https://www.nsf.gov/statistics/srvygradpostdoc/.
In 2017, the GSS was redesigned to collect demographic and financial support data separately for master’s and doctoral students, to prioritize electronic data interchange as the primary means of data submission, and to use the U.S. Department of Education’s Classification of Instructional Programs (CIP) codes to report fields of study for graduate student enrollment data. More information regarding the 2017 GSS redesign is available in the technical notes for the 2019 data tables (https://ncses.nsf.gov/pubs/nsf21318). Further, in 2017, NSF updated the GSS fields of study to align with the NCSES Taxonomy of Disciplines to increase comparability with other NCSES surveys and more accurately reflect how disciplines are currently organized. For more information regarding the updated GSS taxonomy, see the 2018 GSS Methodology Report (available upon request).
Because of these changes, the data from 2017 to the present are not directly comparable to previously collected GSS data. Trend comparisons can be made using the 2017old estimates in the 2017 data tables, available at https://ncsesdata.nsf.gov/gradpostdoc/2017/.
GSS health fields are collected under the advisement of NIH. These GSS fields are about one-third of all health fields in the U.S. Department of Education’s CIP taxonomy. NIH information on trends seen within these selected health fields can be found at https://report.nih.gov/nihdatabook/.
The full set of data tables from the 2019 survey are available at https://www.nsf.gov/statistics/srvygradpostdoc/. Data are also available in NCSES’s interactive data tool (https://ncsesdata.nsf.gov/ids/gss). For more information about the survey, contact the GSS survey manager, Michael Yamaner.
Notes
1Several data reports have documented the decline in international graduate students from 2017 to 2019. These include the following: Institute of International Education. 2019. Open Doors, 2019 Fast Facts. Washington, DC. Available at https://opendoorsdata.org/fast_facts/fast-facts-2019/. National Science Board, National Science Foundation. 2019. Higher Education in Science and Engineering (Table 2-3). Science and Engineering Indicators 2020. NSB-2019-7. Alexandria, VA. Available at https://ncses.nsf.gov/pubs/nsb20197/international-s-e-higher-education#tableCtr1553. Okahana H, Zhou E. 2019. International Graduate Applications and Enrollment: Fall 2018. Washington, DC: Council of Graduate Schools. Available at https://www.cgsnet.org/ckfinder/userfiles/files/Intl_Survey_Report_Fall2018.pdf. Zhou E, Mitic RR, West CPL, Okahana H. 2020. International Graduate Applications and Enrollment: Fall 2019. Washington, DC: Council of Graduate Schools. Available at https://cgsnet.org/sites/default/files/civicrm/persist/contribute/files/CGS%20Fall%202019%20International%20Report.pdf?v=1.
2National Science Board. (2020). Vision 2030. NSB-2020-15. Washington, DC. Available at https://www.nsf.gov/nsb/publications/2020/nsb202015.pdf.
3The number of Hispanic or Latino students earning S&E bachelor’s degrees increased by an average of 8.9% per year from 2006 through 2016. For more information on bachelor’s completions in S&E by race and ethnicity from 2006 through 2016, see table 5-3 in https://ncses.nsf.gov/pubs/nsf19304/data. National Science Foundation, National Center for Science and Engineering Statistics. 2019. Women, Minorities, and Persons with Disabilities in Science and Engineering: 2019. Special Report NSF 19-304. Alexandria, VA. Available at https://ncses.nsf.gov/pubs/nsf19304/.
4Even though data comparability between 2017old and current data is limited because the 2017–19 GSS includes fewer fields than were collected from 2007 through 2016, in 2019, GSS institutions reported more postdocs than in any year before 2019. See table 1-1 for the postdoc counts reported to the GSS from 1979 through 2019 at https://ncses.nsf.gov/pubs/nsf21318.
5In the GSS, a unit is defined as an organizational unit where graduate students, postdoctoral researchers, and other doctoral degree–holding NFRs are enrolled and/or work. A unit can be a teaching unit, research unit, or both a teaching and a research unit. Research units can be research centers, health care facilities, and other organizations at the academic institution that appoint postdoctoral researchers and/or appoint doctorate-holding NFRs.
6Electronic data interchange is a method for transferring data between computer systems or networks using a standardized format.
7CIP is a taxonomy used for reporting postsecondary fields to the U.S. Department of Education for the Integrated Postsecondary Education Data System, a mandatory survey for institutions receiving federal financial aid. Most institutions in the GSS already use CIP codes to report data on graduate students. The CIP taxonomy was developed by the National Center for Education Statistics, which updates the taxonomy about once a decade; CIP was last revised in 2010. For more information, see http://nces.ed.gov/ipeds/cipcode/.
Suggested Citation
Arbeit C, Yamaner MI; National Center for Science and Engineering Statistics (NCSES). 2021. Trends for Graduate Student Enrollment and Postdoctoral Appointments in Science, Engineering, and Health Fields at U.S. Academic Institutions between 2017 and 2019. NSF 21-317. Alexandria, VA: National Science Foundation. Available at https://ncses.nsf.gov/pubs/nsf21317/.
Contact Us
NCSES
National Center for Science and Engineering Statistics
Directorate for Social, Behavioral and Economic Sciences
National Science Foundation
2415 Eisenhower Avenue, Suite W14200
Alexandria, VA 22314
Tel: (703) 292-8780
FIRS: (800) 877-8339
TDD: (800) 281-8749
E-mail: ncsesweb@nsf.gov