 An official website of the United States government
 Growth in Federal S&E Support to HBCUs Continues to Lag Behind Increases to All Institutions in FY 2019
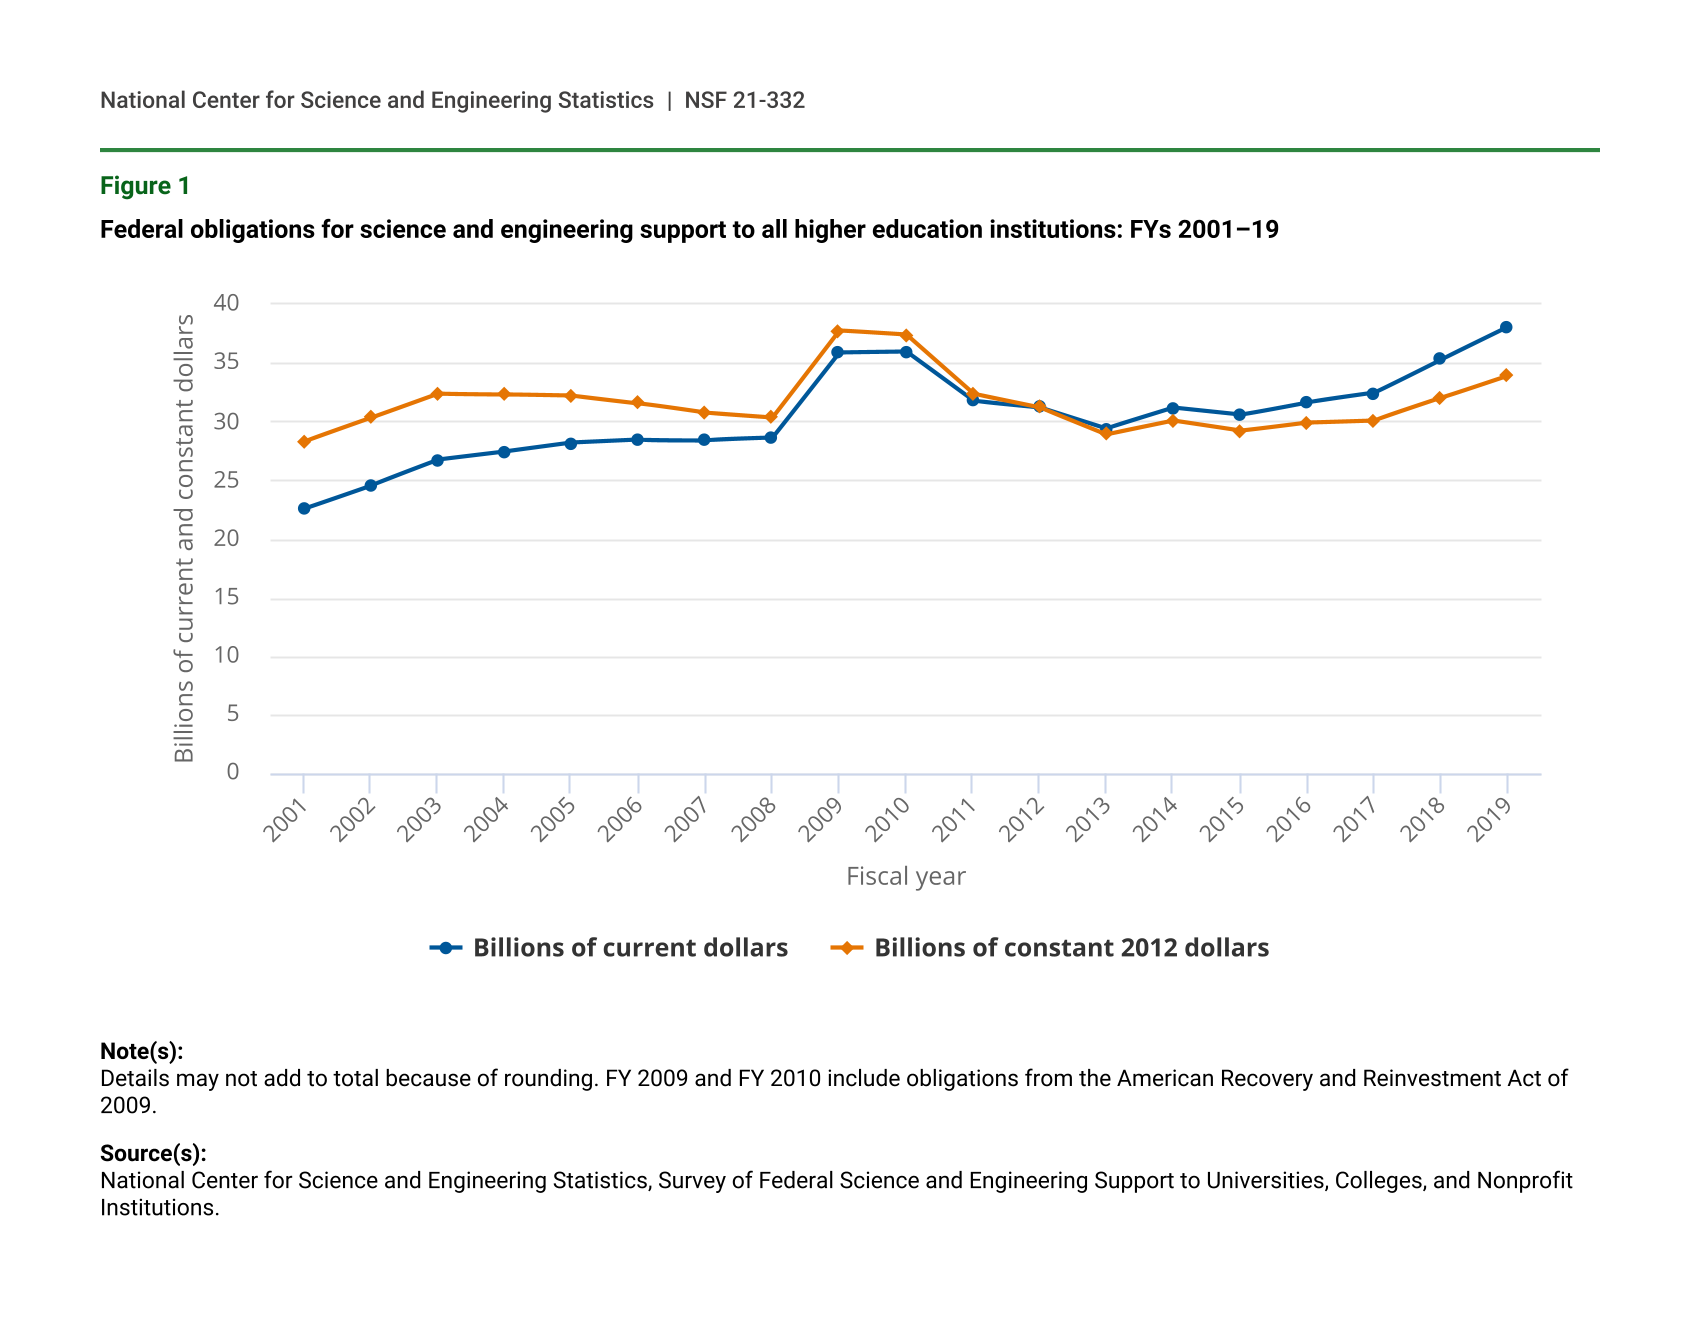
In FY 2019, federal agency obligations to universities and colleges for science and engineering (S&E) activities increased 8% from FY 2018, to a historical high of $38.1 billion in current dollars (figure 1). When adjusted for inflation, obligations increased 6% from FY 2018, but were down 10% from the level reached in FY 2009 when many agencies’ obligations included an infusion of funds from the American Recovery and Reinvestment Act of 2009 (ARRA).
Federal obligations for science and engineering support to all higher education institutions: FYs 2001–19
| Fiscal year | Billions of current dollars | Billions of constant 2012 dollars |
|---|---|---|
| 2001 | 22.585 | 28.305 |
| 2002 | 24.571 | 30.315 |
| 2003 | 26.727 | 32.374 |
| 2004 | 27.412 | 32.333 |
| 2005 | 28.170 | 32.223 |
| 2006 | 28.423 | 31.558 |
| 2007 | 28.413 | 30.722 |
| 2008 | 28.587 | 30.319 |
| 2009 | 35.874 | 37.760 |
| 2010 | 35.944 | 37.399 |
| 2011 | 31.762 | 32.371 |
| 2012 | 31.216 | 31.216 |
| 2013 | 29.407 | 28.900 |
| 2014 | 31.159 | 30.065 |
| 2015 | 30.563 | 29.212 |
| 2016 | 31.649 | 29.936 |
| 2017 | 32.440 | 30.118 |
| 2018 | 35.304 | 32.008 |
| 2019 | 38.085 | 33.924 |
Note(s):
Details may not add to total because of rounding. FY 2009 and FY 2010 include obligations from the American Recovery and Reinvestment Act of 2009.
Source(s):
National Center for Science and Engineering Statistics, Survey of Federal Science and Engineering Support to Universities, Colleges, and Nonprofit Institutions.
Between FY 2018 and FY 2019, obligations for S&E support to historically Black colleges and universities (HBCUs) increased at a slower rate, up 7% to $341 million (figure 2). Although the past 2 fiscal years show increased federal obligations for S&E to HBCUs, there is still an overall long-term decline since the early 2000s, with the exception of increases from ARRA. When adjusted for inflation, obligations to HBCUs increased 5% from FY 2018 but were down 37% from the level reached in FY 2009.
These and other estimates in this InfoBrief are from the FY 2019 Survey of Federal Science and Engineering Support to Universities, Colleges, and Nonprofit Institutions (Federal S&E Support Survey), conducted by the National Center for Science and Engineering Statistics (NCSES) within the National Science Foundation (NSF).
Federal obligations for science and engineering support to HBCUs: FYs 2001–19
| Fiscal year | Millions of current dollars | Millions of constant 2012 dollars |
|---|---|---|
| 2001 | 404 | 507 |
| 2002 | 438 | 540 |
| 2003 | 455 | 551 |
| 2004 | 472 | 557 |
| 2005 | 475 | 544 |
| 2006 | 444 | 493 |
| 2007 | 405 | 438 |
| 2008 | 433 | 459 |
| 2009 | 458 | 482 |
| 2010 | 497 | 517 |
| 2011 | 448 | 456 |
| 2012 | 400 | 400 |
| 2013 | 380 | 373 |
| 2014 | 408 | 394 |
| 2015 | 398 | 380 |
| 2016 | 373 | 353 |
| 2017 | 308 | 286 |
| 2018 | 320 | 290 |
| 2019 | 341 | 304 |
HBCUs = historically Black colleges and universities.
Note(s):
Details may not add to total because of rounding. FY 2009 and FY 2010 include obligations from the American Recovery and Reinvestment Act of 2009.
Source(s):
National Center for Science and Engineering Statistics, Survey of Federal Science and Engineering Support to Universities, Colleges, and Nonprofit Institutions.
S&E Obligations to All Universities and Colleges
Federal S&E support from 12 federal departments and 8 independent agencies is provided for six categories (see definitions in “Data Sources, Limitations, and Availability”): R&D; R&D plant; facilities and equipment for instruction in S&E; fellowships, traineeships, and training grants (FTTGs); general support for S&E; and other S&E activities. Twenty higher education institutions receiving the largest amounts of federal S&E support accounted for 36% of all S&E support obligations by the federal government for universities and colleges (table 1). Of the $13.7 billion obligated to these 20 academic institutions to support S&E activities, 95% was for R&D, 4% for FTTGs, and less than 1% was for each of the remaining four S&E categories. These shares differ slightly from those for all other academic institutions. Of the $24.4 billion obligated to all other academic institutions, 91% was for R&D, 5% for FTTGs, 2% for R&D plant, 2% for other S&E activities, and less than 1% for facilities for instruction in S&E and for general support for S&E.
Federal obligations for science and engineering to universities and colleges, ranked by total amount received, by type of activity: FY 2019
S&E = science and engineering.
Note(s):
Detail may not add to total because of rounding. Institution order is based on total actual dollars received before amounts are rounded.
Source(s):
National Center for Science and Engineering Statistics, Survey of Federal Science and Engineering Support to Universities, Colleges, and Nonprofit Institutions, FY 2019.
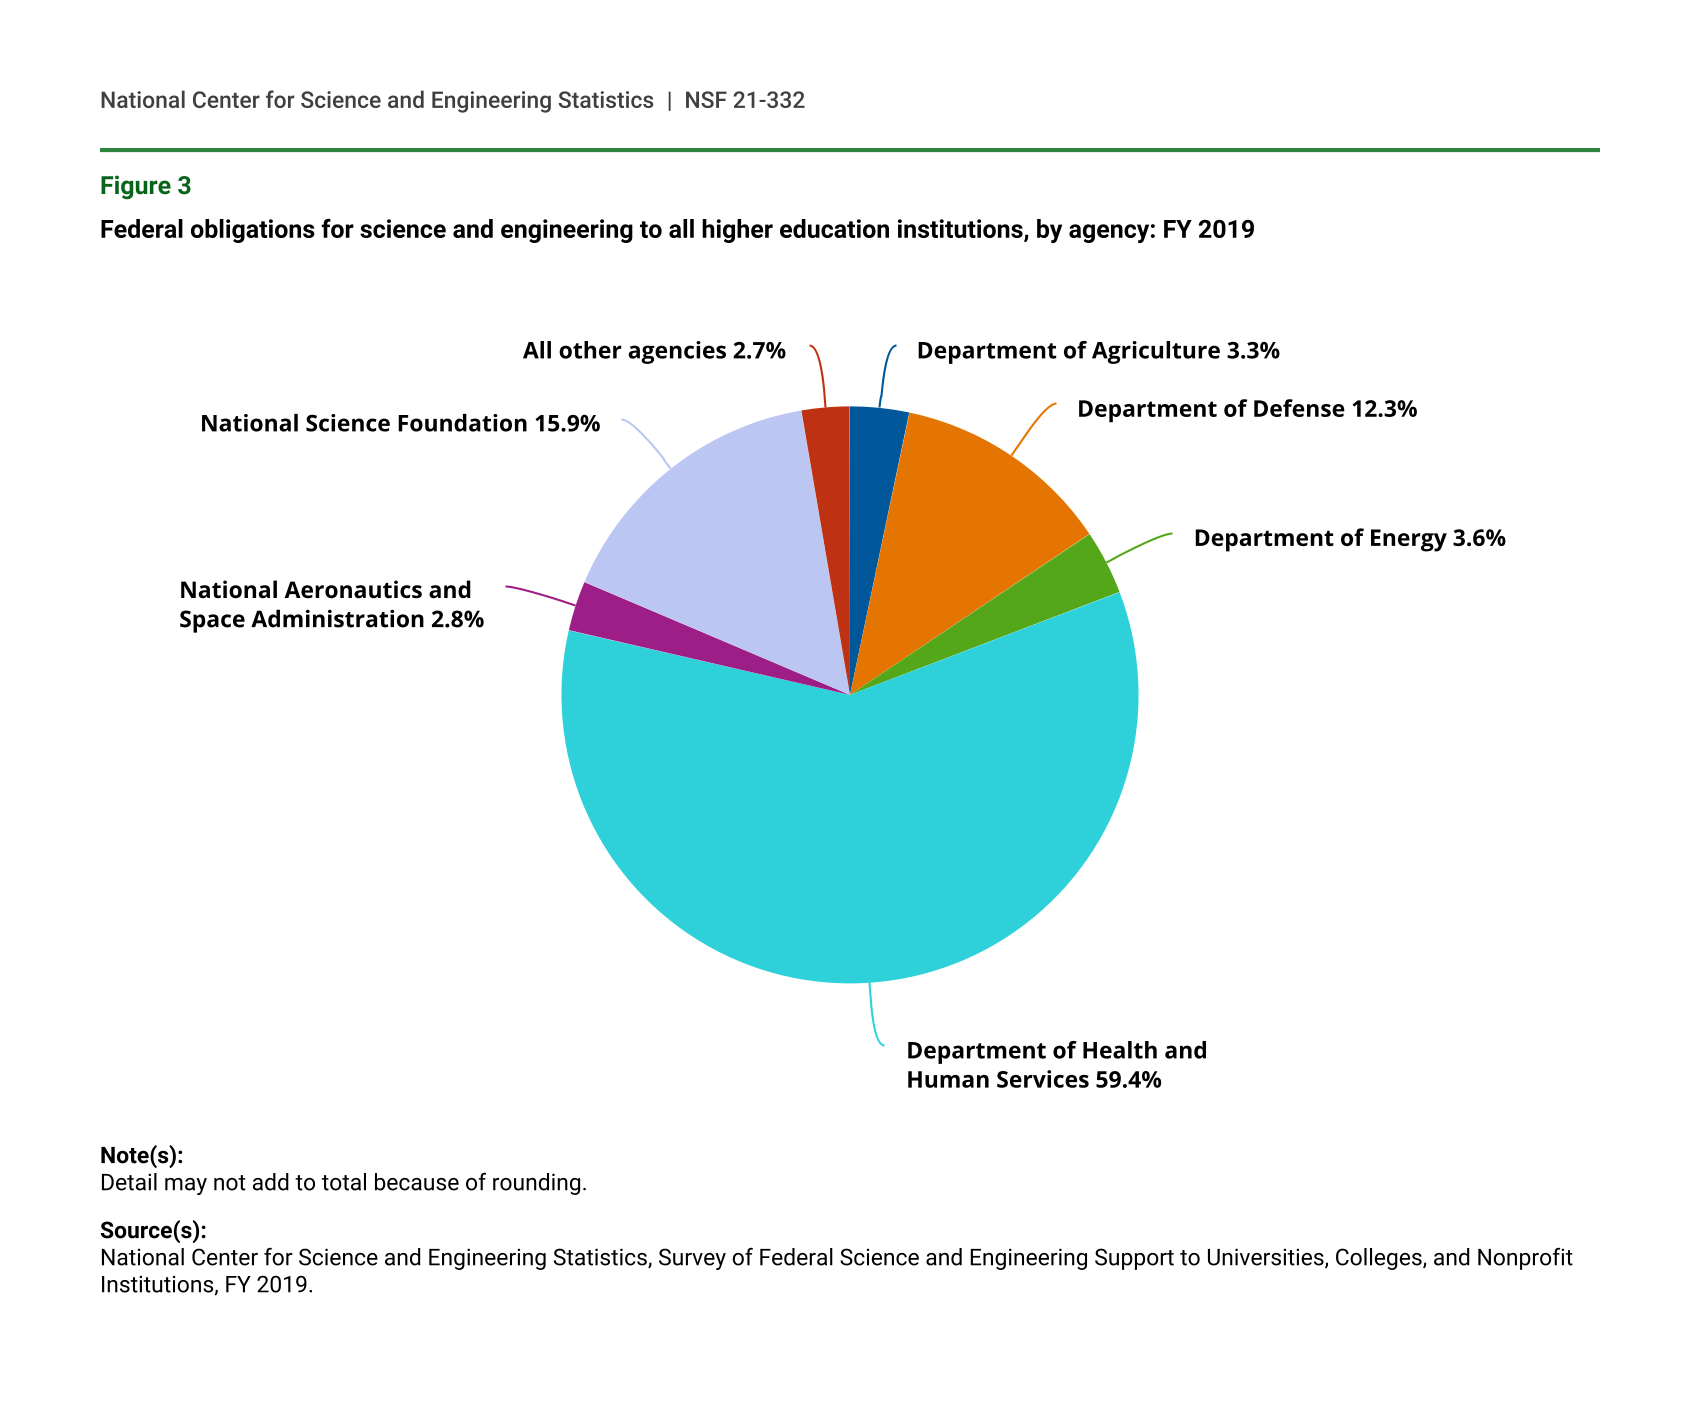
Six federal agencies accounted for 97% of all S&E support to higher education institutions in FY 2019 (figure 3): the Department of Health and Human Services (HHS), which includes the National Institutes of Health ($22.6 billion); NSF ($6.1 billion); the Department of Defense (DOD) ($4.7 billion); the Department of Energy ($1.4 billion); the Department of Agriculture (USDA) ($1.2 billion); and the National Aeronautics and Space Administration ($1.1 billion). Because obligations for R&D are by far the single largest component of total S&E support, these same six agencies accounted for 98% of all federal R&D obligations to the academic sector.
S&E Obligations to Minority Serving Institutions
In FY 2019, North Carolina A&T State University maintained its position as the primary recipient of federal obligations for S&E activities among all HBCUs, a position it has held since FY 2016. Prior to FY 2016, Morehouse School of Medicine was the largest HBCU recipient of federal S&E obligations, followed by North Carolina A&T State University. The University of California, San Diego maintained its position as the leading recipient of federal S&E support among high-Hispanic-enrollment institutions (HHEs) in FY 2019, a position it has held since FY 2018. Among tribal colleges and universities, Navajo Technical University maintained its position as the leading recipient of federal S&E support in FY 2019, a position it has held since FY 2018.
Federal obligations for science and engineering to all higher education institutions, by agency: FY 2019
| Agency | Percent |
|---|---|
| Department of Agriculture | 3.3 |
| Department of Defense | 12.3 |
| Department of Energy | 3.6 |
| Department of Health and Human Services | 59.4 |
| National Aeronautics and Space Administration | 2.8 |
| National Science Foundation | 15.9 |
| All other agencies | 2.7 |
Note(s):
Detail may not add to total because of rounding.
Source(s):
National Center for Science and Engineering Statistics, Survey of Federal Science and Engineering Support to Universities, Colleges, and Nonprofit Institutions, FY 2019.
Historically Black Colleges and Universities
Sixty-six of the 105 HBCUs received federal obligations for S&E activities in FY 2019, totaling $341 million (table 2). FY 2019 marked the second consecutive year for increased federal S&E support to HBCUs. Despite these increases in the past 2 fiscal years, total federal obligations for S&E to HBCUs in FY 2019 constitute 0.9% of all federal obligations to all institutions of higher education for S&E. Although total S&E support to HBCUs has increased, support in the form of R&D obligations has declined. In FY 2019, total R&D support to all HBCUs was $233 million, a 6% decrease from the $247 million obligated in FY 2018.
Federal obligation for science and engineering to HBCUs, by total amount received, by type of activity: FY 2019
HBCUs = historically Black colleges and universities; S&E = science and engineering.
Note(s):
Detail may not add to total because of rounding. Institution order is based on total actual dollars received before amounts are rounded.
Source(s):
National Center for Science and Engineering Statistics, Survey of Federal Science and Engineering Support to Universities, Colleges, and Nonprofit Institutions, FY 2019.
The 20 HBCUs receiving the largest share of federal S&E support accounted for 71% of all S&E support obligations to HBCUs. These top 20 HBCUs also received 75% ($175 million) of all federal obligations for R&D to HBCUs, 59% ($42 million) of obligations for FTTGs, and 67% ($25 million) of other S&E activities.
In FY 2019, four federal agencies—USDA, NSF, HHS, and DOD—accounted for 94% of all federal obligations for S&E support to HBCUs (table 3). USDA provided the most S&E support, accounting for $105 million, or 31% of all federal S&E obligations to HBCUs. NSF obligated $101 million, or 29% of all federal S&E support to HBCUs, followed by HHS with $95 million (28%). Obligations by DOD accounted for $19 million (6%).
In total, the share of federal support for FTTGs was much larger in HBCUs (21%) than in all universities and colleges (5%). The relative emphasis on supporting research capacity reflects a longstanding approach by federal agencies to support research capacity to minority serving institutions as well as R&D itself.
Federal obligations for science and engineering to HBCUs, ranked by total amount received, by agency: FY 2019
DOC = Department of Commerce; DOD = Department of Defense; DOE = Department of Energy; DOT = Department of Transportation; ED = Department of Education; HBCUs = historically Black colleges and universities; HHS = Department of Health and Human Services; NASA = National Aeronautics and Space Administration; NSF = National Science Foundation; SSA = Social Security Administration; USDA = Department of Agriculture.
Note(s):
Detail may not add to total because of rounding. Institution order is based on total actual dollars received before amounts are rounded. Only those agencies that had obligations in the variables represented by this table appear in the table.
Source(s):
National Center for Science and Engineering Statistics, Survey of Federal Science and Engineering Support to Universities, Colleges, and Nonprofit Institutions, FY 2019.
High-Hispanic-Enrollment Institutions
HHEs received $4.8 billion in federal obligations for S&E support in FY 2019 (table 4). Federal support to HHEs for R&D amounted to $4.3 billion, or 91% of total federal S&E support to HHEs. By comparison, R&D accounted for 68% of the S&E total obligations to HBCUs and for 92% of federal S&E support to all higher education institutions. Although FTTG support to HHEs accounted for 5% of their S&E total (similar to the share of federal support for FTTGs among all universities and colleges), among “all other HHEs” that is, HHE’s other than the top 20 HHEs in terms of overall S&E support, their share of federal S&E support for FTTGs was 14%, which was greater than the share of federal support for FTTGs among all universities and colleges (5%).
Federal obligations for science and engineering to high-Hispanic-enrollment institutions, ranked by total amount received, by type of activity: FY 2019
HHEs = high-Hispanic-enrollment institutions; S&E = science and engineering.
a Excludes obligations for the university's foundation or auxiliary organization or some campuses/branches as those are not HHE institutions.
Note(s):
Detail may not add to total because of rounding. Institution order is based on total actual dollars received before amounts are rounded. Only those agencies that had obligations in the variables represented by this table appear in the table. This list of HHE institutions includes those institutions of higher education whose full-time equivalent (FTE) enrollment of undergraduate students is at least 25% Hispanic, according to fall 2018 enrollment data self-reported by the institutions in the Integrated Postsecondary Education Data System survey conducted by the National Center for Education Statistics (NCES). NCES determined FTE enrollment by calculating that approximately three part-time students are equivalent to one full-time student.
Source(s):
National Center for Science and Engineering Statistics, Survey of Federal Science and Engineering Support to Universities, Colleges, and Nonprofit Institutions, FY 2019.
When it comes to HHEs, some of the top recipient institutions for federal obligations are also among the largest recipient institutions among all institutions of higher education. For example, the University of California, San Diego and the University of California, Los Angeles are the top two recipients of federal obligations among all HHEs, respectively. These same institutions also rank fifth and thirteenth in total S&E support among all academic institutions.
The majority (61%) of the FY 2019 S&E support to HHEs came from HHS, with over $2.9 billion in obligations. NSF was the second-leading federal agency to obligate funding to support S&E at HHEs, with $887 million (19%).
Tribal Colleges and Universities
Federal agency obligations to tribal colleges and universities totaled $26.1 million in FY 2019 (table 5). Of the $26.1 million in federal obligations for S&E in FY 2019, R&D amounted to $11.0 million, or 42% of all S&E support, whereas FTTGs totaled $9.8 million, or 37% of total S&E support, and other S&E activities, totaled $4.7 million, or 18%. Similar to HBCUs, the distribution of types of S&E support illustrates how relatively larger shares of federal S&E obligations to tribal colleges and universities are for building research and training capacity within these institutions through FTTGs and other activities, compared with these obligations to all other institutions.
NSF continues to be the leading agency to support S&E activities within tribal colleges and universities with obligations of $13.8 million, or 53% of all S&E support. The USDA followed with $10.4 million, or 40% of all obligations.
Federal obligations for science and engineering to tribal colleges and universities, ranked by total amount received, by activity: FY 2019
Note(s):
Detail may not add to total because of rounding. Institution order is based on total actual dollars received before amounts are rounded; institutions receiving the same amount of actual dollars are listed alphabetically. Only those agencies that had obligations in the variables represented by this table appear in the table. The list of tribal colleges and universities is from the White House Initiative on American Indian and Alaska Native Education (see https://sites.ed.gov/whiaiane/tribes-tcus/tribal-colleges-and-universities/). In accordance with Executive Order No. 13270, “Tribal Colleges and Universities,” as extended by Executive Order No. 13316, the list includes all of the colleges cited in section 532 of the Equity in Educational Land-Grant Status Act of 1994 (7 U.S.C. 301 note), any other institution that qualifies for funding under the Tribally Controlled Community College Assistance Act of 1978 (25 U.S.C. 1801 et seq.), and Diné College, which is authorized in the Navajo Community College Assistance Act of 1978, Public Law 95-471, title II (25 U.S.C. 640a note). The statutory definition of American Indian tribally controlled colleges and universities, to which the Higher Education Act refers at §316(b)(3), 20 U.S.C. 1059c(b)(3), is in section 2(a)(4) of the Tribally Controlled College and University Assistance Act of 1978, 25 U.S.C. 1801(a)(4).
Source(s):
National Center for Science and Engineering Statistics, Survey of Federal Science and Engineering Support to Universities, Colleges, and Nonprofit Institutions, FY 2019.
Data Sources, Limitations, and Availability
Data were obtained from the 20 agencies (12 federal departments and 8 independent agencies) that made S&E obligations to academic and nonprofit institutions in FY 2019, as reported to the Federal S&E Support Survey. The survey collects federal S&E support data by funding agency, individually named institution, type of activity, type of institution, and geographic location.
The six funding categories of federal S&E support are defined as follows:
- Research and experimental development includes all direct, indirect, incidental, or related costs resulting from or necessary to perform R&D by private individuals and organizations under grant, contract, or cooperative agreement.
- R&D plant includes all projects whose principal purpose is to provide support for construction, acquisition, renovation, modification, repair, or rental of facilities, land, works, or fixed equipment for use in scientific or engineering R&D.
- Facilities and equipment for S&E instruction includes all programs whose principal purpose is to provide support for construction, acquisition, renovation, modification, repair, or rental of facilities, land, works, or equipment for use in instruction in S&E.
- Fellowships, traineeships, and training grants includes all fellowship, traineeship, and training grant programs that are directed primarily toward the development and maintenance of the scientific workforce.
- General support for S&E includes funds used for scientific projects and support for activities within a specified discipline; explicit purpose is not specified.
- Other S&E activities includes all academic S&E obligations that cannot be assigned elsewhere and activities in support of technical conferences, teacher institutes, and programs aimed at increasing precollege and undergraduate students' scientific knowledge.
The full set of data tables on the FY 2019 Federal S&E Support Survey are available at https://www.nsf.gov/statistics/srvyfedsupport/. Data for the survey are available in NCSES's interactive data tool (https://ncsesdata.nsf.gov/ids/fss). For more information, please contact the survey manager.
Notes
1Details available in table 8 in the full set of data tables.
2Details available in table 21 in the full set of data tables.
3Details available in table 26 in the full set of data tables.
4Details available in table 27 in the full set of data tables.
5The Higher Education Act of 1965, as amended, defines an HBCU as “any historically Black college or university that was established prior to 1964, whose principal mission was, and is, the education of Black Americans, and that is accredited by a nationally recognized accrediting agency or association determined by the Secretary (of Education) to be a reliable authority as to the quality of training offered or is, according to such an agency or association, making reasonable progress toward accreditation.”
6HHEs are those institutions whose full-time equivalent (FTE) enrollment of undergraduate students is at least 25% Hispanic, according to fall 2018 enrollment data self-reported by the institutions in the Integrated Postsecondary Education Data System survey conducted by the National Center for Education Statistics (NCES). NCES determined FTE enrollment by calculating that approximately three part-time students are equivalent to one full-time student. The list of HHEs are presented in table 26 in the full set of data tables.
7Details available in table 26 in the full set of data tables.
8The list of tribal colleges and universities is from the White House Initiative on American Indian and Alaska Native Education (see https://sites.ed.gov/whiaiane/tribes-tcus/tribal-colleges-and-universities/). In accordance with Executive Order No. 13270, “Tribal Colleges and Universities,” as extended by Executive Order No. 13316, the list includes all of the colleges cited in section 532 of the Equity in Educational Land-Grant Status Act of 1994 (7 U.S.C. 301 note), any other institution that qualifies for funding under the Tribally Controlled Community College Assistance Act of 1978 (25 U.S.C. 1801 et seq.), and Diné College, which is authorized in the Navajo Community College Assistance Act of 1978, Public Law 95-471, title II (25 U.S.C. 640a note). The statutory definition of American Indian tribally controlled colleges and universities, to which the Higher Education Act refers at §316(b)(3), 20 U.S.C. 1059c(b)(3), is in section 2(a)(4) of the Tribally Controlled College and University Assistance Act of 1978, 25 U.S.C. 1801(a)(4).
9Details available in table 27 in the full set of data tables.
Suggested Citation
National Center for Science and Engineering Statistics (NCSES). 2021. Growth in Federal S&E Support to HBCUs Continues to Lag Behind Increases to All Institutions in FY 2019. NSF 21-332. Alexandria, VA: National Science Foundation. Available at https://ncses.nsf.gov/pubs/nsf21332.
Contact Us
NCSES
National Center for Science and Engineering Statistics
Directorate for Social, Behavioral and Economic Sciences
National Science Foundation
2415 Eisenhower Avenue, Suite W14200
Alexandria, VA 22314
Tel: (703) 292-8780
FIRS: (800) 877-8339
TDD: (800) 281-8749
E-mail: ncsesweb@nsf.gov