 An official website of the United States government
First Comprehensive Innovation Survey for the United States: Data from the 2017 Annual Business Survey
More than two-fifths (43%) of the estimated 4.6 million for-profit companies with at least one employee introduced an innovation during the period of 2015–17 (table 1). Innovation is defined as the implementation of one or more new or significantly improved products or processes, a new marketing method, or a new organizational method. Eighteen percent of these companies introduced one or more product innovations, 16% introduced one or more process innovations, 23% introduced a marketing innovation, and 26% introduced an organizational innovation. Companies could report having more than one type of innovation.
Data from the 2017 Annual Business Survey (ABS) provide the first comprehensive view of the incidence of innovation by businesses located in the United States. These survey data represent an estimated 4.6 million for-profit companies publicly or privately held, with one or more employees, and active in the United States in 2017 (see “Survey Information and Data Availability”). The four distinct types of innovation in the ABS—product, process, marketing, and organizational—were based on guidance in the 2005 Oslo Manual, which was updated in 2018 after the inaugural Annual Business Survey was fielded.,
Innovation incidence in companies, by industry and type of innovation: 2015–17
NAICS = 2017 North American Industry Classification System.
Note(s):
Detail may not add to total because of rounding. Industry classification based on dominant establishment payroll. Statistics are representative of companies located in the United States. Companies may have multiple types of innovation.
Source(s):
National Center for Science and Engineering Statistics and Census Bureau, Annual Business Survey, 2017.
Distinctions must be made when discussing innovation incidence by industry, because substantial differences exist between manufacturing and nonmanufacturing industries as well as between R&D-active companies and non-R&D-active companies. Although rates of innovation generally are higher for manufacturing and R&D-active companies than for nonmanufacturing and non-R&D-active companies, the absolute number of companies reporting innovation is larger in nonmanufacturing industries and in companies that are not R&D funders or performers. Of the 4.6 million companies represented in the ABS, 221,000 (5%) were in manufacturing and 4.4 million companies (95%) were in nonmanufacturing (table 1).
Incidence of Innovation across the U.S. Economy
The innovation incidence rate was 43% during 2015–17 for all companies that introduced one or more of the following innovations (table 1):
- Product innovations are the introduction of a good or service that is new or significantly improved with respect to its characteristics or intended uses. Product innovation can utilize new knowledge or technologies or can be based on new uses or combinations of existing knowledge or technologies.
- Process innovations are the implementation of a new or significantly improved production or delivery method. This includes significant changes in techniques, equipment, or software. Process innovations can be intended to decrease unit costs of production or delivery, increase quality, or produce or deliver new or significantly improved products.
- Marketing innovations are the implementation of a new marketing method involving significant changes in product design or packaging, product placement, product promotion, or pricing.
- Organizational innovations are the implementation of a new organizational method in the firm’s business practices, workplace organization, or external relations.
In 2015–17, the incidence rate was 18% for product innovation among businesses located in the United States. For process innovation, it was 16%; for marketing, 23%; and for organizational innovation, 26% (table 1).
Manufacturing Industries
In 2015–17, 58% of the companies classified in manufacturing industries (North American Industry Classification System codes [NAICS] 31–33) reported any kind of innovation, compared with 43% of companies classified in nonmanufacturing industries (NAICS 11, 21–23, 42–81). More than one-quarter (28%) of manufacturing companies reported product innovations, compared with 17% of nonmanufacturing companies. For process innovations, the innovation rate for manufacturing industries was more twice that of nonmanufacturing industries (34% versus 15%).
Higher incidence rates of innovation were also evident in several more narrowly defined manufacturing subsectors. Product innovations were reported by about one-half each of companies in the communications equipment industry (NAICS 3342), navigational, measuring, electromedical, and control instruments industry (NAICS 3345), and other computer and electronic products industry (NAICS other 334) (56%, 53%, and 53%, respectively).
Several manufacturing subsectors exhibited product innovation rates well below the overall incidence rate for manufacturing as a whole. Notable in this respect are the companies in the following industries: wood products (NAICS 321), printing and related support (NAICS 323), nonmetallic mineral products (NAICS 327), and primary metals (NAICS 331), each of which reported product innovation rates of 23% or less.
By Sex and by Race and Ethnicity
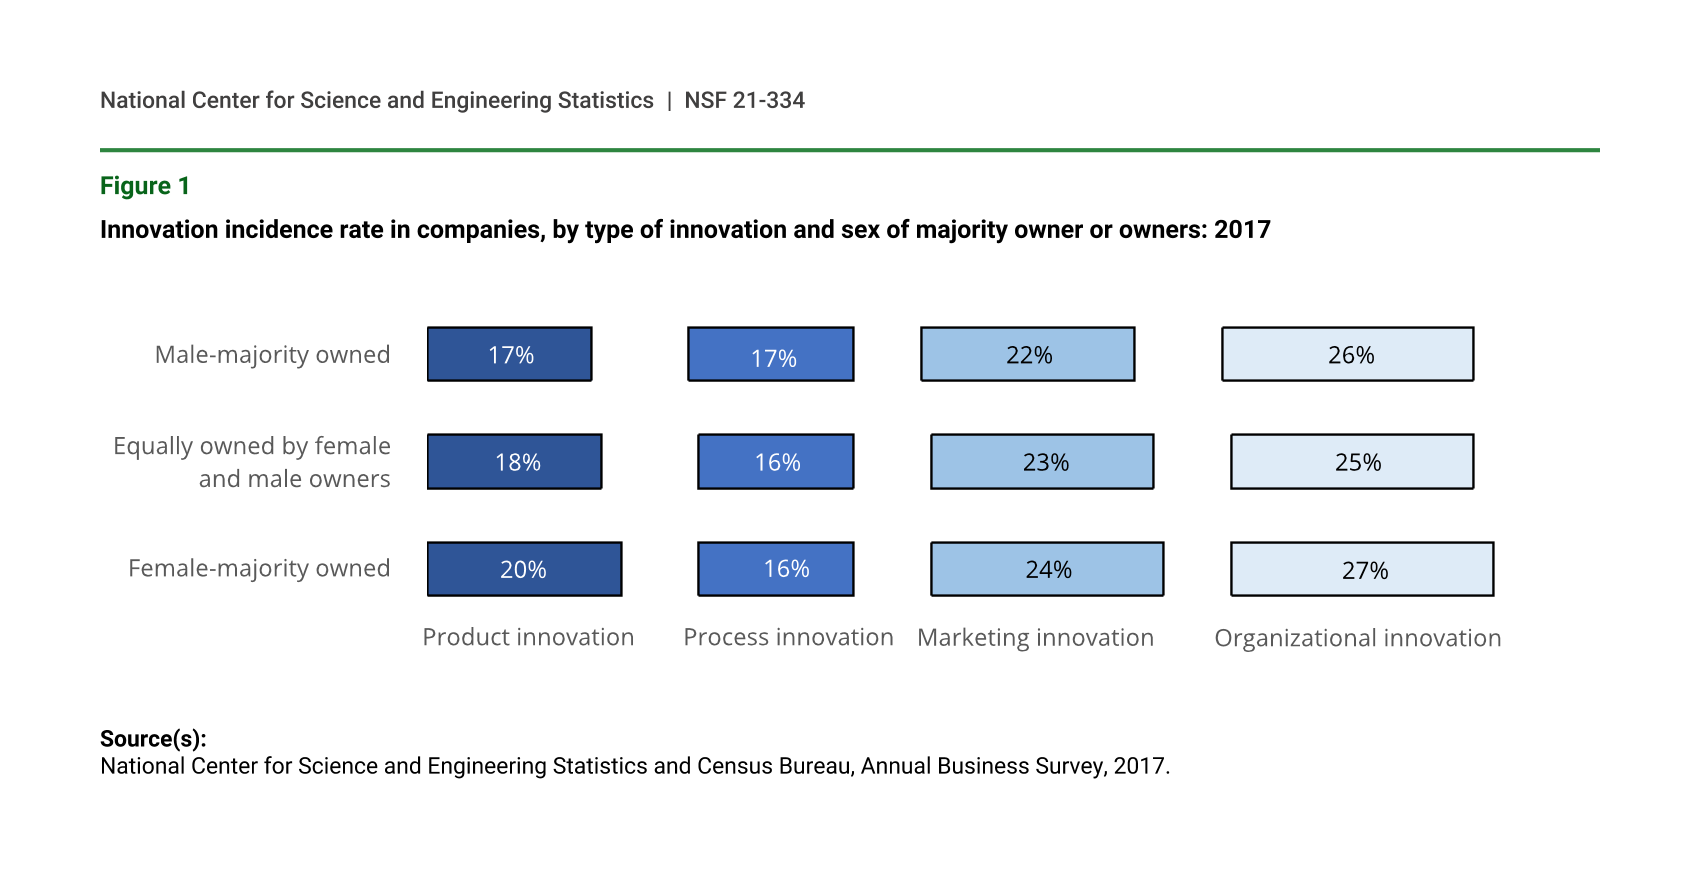
A slightly higher proportion of companies where females were the majority owner or owners (female-majority owned companies) (20%) were product innovators, compared with 17% of male-majority owned companies (figure 1). By contrast, for process innovations, the proportions were nearly identical for female- and male-majority owned companies (16% and 17%).
Innovation incidence rate in companies, by type of innovation and sex of majority owner or owners: 2017
Source(s):
National Center for Science and Engineering Statistics and Census Bureau, Annual Business Survey, 2017.
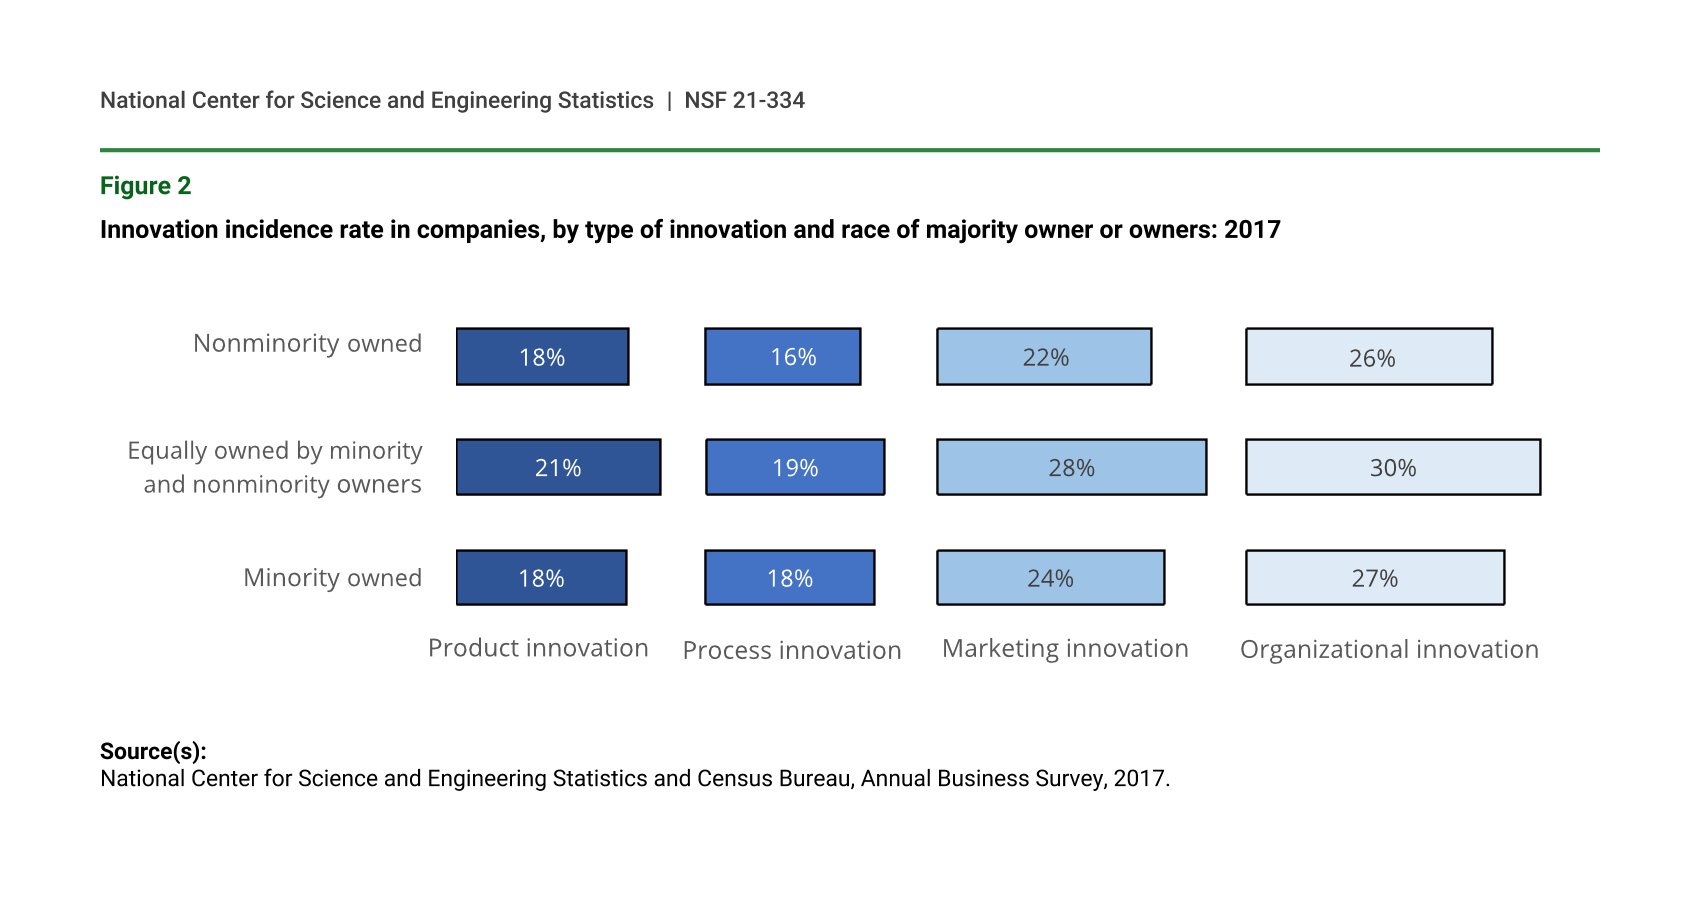
There were no significant differences between companies regarding innovation incidence across three out of four different types of innovation regardless of whether minorities or nonminorities were the majority owner or owners (minority- or nonminority-owned companies) (figure 2). However, there was a significant difference for marketing innovations. One-quarter (24%) of minority-owned companies were marketing innovators, compared with 22% of nonminority-owned companies. Eighteen percent each of minority- and nonminority-owned companies were product innovators, while 21% of companies owned equally by minority and nonminority owners were product innovators.
Innovation incidence rate in companies, by type of innovation and race of majority owner or owners: 2017
Source(s):
National Center for Science and Engineering Statistics and Census Bureau, Annual Business Survey, 2017.
By State
There were for the most part only small differences in the product innovation rates among companies located in the 50 states and the District of Columbia. Nine states and the District of Columbia each had a product innovation incidence rate measured 20% or higher during 2015–17 (table 2). The District of Columbia and 8 of these same 9 states also had the highest incidence of process innovation. Eighteen states and the District of Columbia had a measured process innovation incidence rate of 17% or higher during the 2015–17 period.
Incidence of product and process innovation in companies, by state: 2015–17
Note(s):
Detail may not add to total because of rounding. Statistics are representative of companies located in the United States.
Source(s):
National Center for Science and Engineering Statistics and Census Bureau, Annual Business Survey, 2017.
Product Innovation and R&D Activity
Innovative companies exhibit high rates of R&D activity (in-house or external R&D). One-third (33%) of innovative companies had R&D activity (table 3). For innovative manufacturing companies 65% had R&D activity, while 31% of innovative nonmanufacturing companies had R&D activity.
Product innovating companies, by industry and R&D activity: 2015–17
NAICS = 2017 North American Industry Classification System.
Note(s):
Detail may not add to total because of rounding. Industry classification based on dominant establishment payroll. R&D activity is based on unedited company responses to innovation questions, not R&D expenditures. Statistics are representative of companies located in the United States.
Source(s):
National Center for Science and Engineering Statistics and Census Bureau, Annual Business Survey, 2017.
Larger innovative businesses have high rates of R&D activity. For the smallest innovative companies, those with 1 to 4 employees, 30% have R&D activity, compared with more than three-quarters of innovative businesses with 5,000 or more employees (table 4).
Product innovating companies, by size of company and R&D activity: 2015–17
Note(s):
Detail may not add to total because of rounding. R&D activity is based on unedited company responses to innovation questions, not R&D expenditures. Statistics are representative of companies located in the United States.
Source(s):
National Center for Science and Engineering Statistics and Census Bureau, Annual Business Survey, 2017.
Novelty of Product Innovation
As defined in the Oslo Manual, innovation must contain a degree of novelty. Products that are new to the market are assumed to have a higher degree of novelty than are products that are new only to the business. Nine percent of all companies in the ABS introduced a new or significantly improved product during 2015–17 that was new to the market, whereas 17% of companies introduced product innovations that were new only to the firm (table 5). In the manufacturing sector, 18% said they introduced products new to the market and 24% introduced product innovations as new only to the firm. In the nonmanufacturing sector, these rates were 9% and 16%.
Companies with new to the business and new to the market product innovation, by industry: 2015–17
NAICS = 2017 North American Industry Classification System.
Note(s):
Detail may not add to total because of rounding. Industry classification based on dominant establishment payroll. Statistics are representative of companies located in the United States.
Source(s):
National Center for Science and Engineering Statistics and Census Bureau, Annual Business Survey, 2017.
Factors Interfering with Innovation
There are a number of factors—such as financing, availability of skilled employees, or market conditions—that can interfere with a company’s ability to innovate. About 58% each of innovating companies reported that lack of internal financing or lack of skilled employees within the business were very important barriers to innovation during 2015–17 (table 6). For innovating companies, the smaller the company, the more likely it was to report that a lack of internal financing was an important factor that could interfere with innovation. For innovating companies with 250 or more employees, 43% reported a lack of internal financing as a very important factor in their ability to innovate. By comparison, 59% of innovating microbusinesses, those with fewer than 10 employees, reported a lack of internal financing as a very important factor in their ability to innovate. The lack of skilled employees as a barrier to innovation was one of the most important factors, regardless of the size of the company.
Factors interfering with innovation among innovating companies, by company size: 2015–17
Note(s):
Detail may not add to total because of rounding. Statistics are representative of companies located in the United States. Innovating companies are defined here as those with product, process, marketing, or organizational innovation. Percent shares include companies indicating the factor is very important as well as companies indicating the factor is somewhat important.
Source(s):
National Center for Science and Engineering Statistics and Census Bureau, Annual Business Survey, 2017.
Companies that considered innovating but thought there were too many issues preventing them from doing so were also asked about the barriers to innovation. Not surprisingly, 83% reported innovation costs being too high and 80% reported the lack of internal financing as being very important factors preventing innovation (table 7).
Factors preventing innovation among non-innovating companies, by company size: 2015–17
Note(s):
Detail may not add to total because of rounding. Statistics are representative of companies located in the United States. Innovating companies are defined here as those with product, process, marketing, or organizational innovation. Percent shares include companies indicating the factor is very important as well as companies indicating the factor is somewhat important.
Source(s):
National Center for Science and Engineering Statistics and Census Bureau, Annual Business Survey, 2017.
Innovation Cooperation and Partnerships
The ABS also asked about innovation cooperation, defined as active participation with other companies or organizations on innovation activities, although both partners do not need to commercially benefit. A greater percentage of larger companies had innovation partners. About one-half (53%) of companies with 250 or more employees reported at least one innovation partner, compared with 41% of companies with fewer than 10 employees (table 8). A greater percentage of partners were in the United States than in other countries regardless of company size. A greater percentage of partners were customers or suppliers, rather than universities, governments, or private research institutes.
Innovating companies, by type and location of cooperation partner and size of company: 2015–17
Note(s):
Detail may not add to total because of rounding. Innovating companies are defined here as those with product, process, marketing, or organizational innovation. Statistics are representative of companies located in the United States.
Source(s):
National Center for Science and Engineering Statistics and Census Bureau, Annual Business Survey, 2017.
Survey Information and Data Availability
The ABS is designed to collect a wide range of data on business R&D, intellectual property, company and primary owner characteristics, and innovation activities in the United States. The ABS was developed and is cosponsored by the National Center for Science and Engineering Statistics within the National Science Foundation and by the Census Bureau. The statistics from the survey are based on a sample, and as such, they are subject to both sampling and nonsampling errors (see technical notes in the data tables report Annual Business Survey: 2017 that are available at https://ncses.nsf.gov/pubs/nsf21303).
For the 2017 ABS, 849,970 employer companies were sampled to represent the population of 5.3 million employer companies, 4.6 million of which were in scope for the innovation and technology modules. For the 2017 ABS, the unit response rate was 68%.
The full set of data tables on innovation, R&D, company demographics, technology, and patent and intellectual property protection from this survey are available in the report Annual Business Survey: Tables for Data Year 2017 (https://ncses.nsf.gov/pubs/nsf21303). Individual data tables and tables with relative standard errors and imputation rates from the 2017 survey are available upon request from the Survey Manager.
Measuring Business Innovation
The survey questions are based on the Oslo Manual (2005 edition), developed by the Organisation for Economic Co-operation and Development (OECD) and Eurostat (the Statistical Office of the European Union), which provides internationally recognized definitions and guidelines for measuring innovation.
In the 2005 Oslo framework, “innovation is the implementation of a new or significantly improved product (good or service), or process, a new marketing method, or a new organizational method in business practices, workplace organization or external relations.”, Further, “The minimum requirement for an innovation is that the product, process, marketing method or organizational method must be new or significantly improved to the firm. This includes products, processes, and methods that firms are the first to develop and those that have been adopted from other firms or organizations.”
Notes
1The 4.6 million for-profit companies were active in 2017 and not necessarily during the 2015–17 time period.
2Organisation for Economic Co-operation and Development (OECD) and Statistical Office of the European Communities (Eurostat). 2005. Oslo Manual: Guidelines for Collecting and Interpreting Innovation Data. 3rd ed. Paris.
3Organisation for Economic Co-operation and Development (OECD) and Statistical Office of the European Communities (Eurostat). 2018. Oslo Manual 2018: Guidelines for Collecting, Reporting and Using Data on Innovation. 4th ed. Paris.
4None of the product innovation rates for the states were significantly greater than 20%.
5R&D activity is based on unedited company responses to innovation questions, not R&D expenditures. R&D expenditures on the ABS are asked only of companies with one to nine employees and in certain industries. R&D activity is asked of all companies regardless of number of employees or industry. For a complete discussion of R&D expenditures see the following InfoBrief: Kindlon A; National Center for Science and Engineering Statistics (NCSES). 2020. Microbusinesses Had More Than $6.7 billion in R&D Costs in the United States in 2017, According to New Annual Business Survey. NSF 21-302. Alexandria, VA: National Science Foundation. Available at https://ncses.nsf.gov/pubs/nsf21302/.
6Organisation for Economic Co-operation and Development (OECD) and Statistical Office of the European Communities (Eurostat). 2005. Oslo Manual: Guidelines for Collecting and Interpreting Innovation Data. 3rd ed. Paris.
7Organisation for Economic Co-operation and Development (OECD) and Statistical Office of the European Communities (Eurostat). 2005. Oslo Manual: Guidelines for Collecting and Interpreting Innovation Data. 3rd ed., p. 46. Paris.
8After the ABS was launched, the Oslo Manual was updated and revised. It included a revised definition of business innovation. Specifically, in the updated 2018 Oslo framework, “A business innovation is a new or improved product or business process (or combination thereof) that differs significantly from the firm's previous products or business processes and that has been introduced on the market or brought into use by the firm.” Subsequent ABS surveys utilize the revised definition.
9Organisation for Economic Co-operation and Development (OECD) and Statistical Office of the European Communities (Eurostat). 2005. Oslo Manual: Guidelines for Collecting and Interpreting Innovation Data. 3rd ed., p. 46. Paris.
Suggested Citation
Kindlon A; National Center for Science and Engineering Statistics (NCSES). 2021. First Comprehensive Innovation Survey for the United States: Data from the 2017 Annual Business Survey. NSF 21-334. Alexandria, VA: National Science Foundation. Available at https://ncses.nsf.gov/pubs/nsf21334/.
Contact Us
NCSES
Directorate for Social, Behavioral and Economic Sciences
National Science Foundation
2415 Eisenhower Avenue, Suite W14200
Alexandria, VA 22314
Tel: (703) 292-8780
FIRS: (800) 877-8339
TDD: (800) 281-8749
E-mail: ncsesweb@nsf.gov