 An official website of the United States government
 Federally Funded R&D Centers Report 3% Increase in R&D Spending in FY 2020
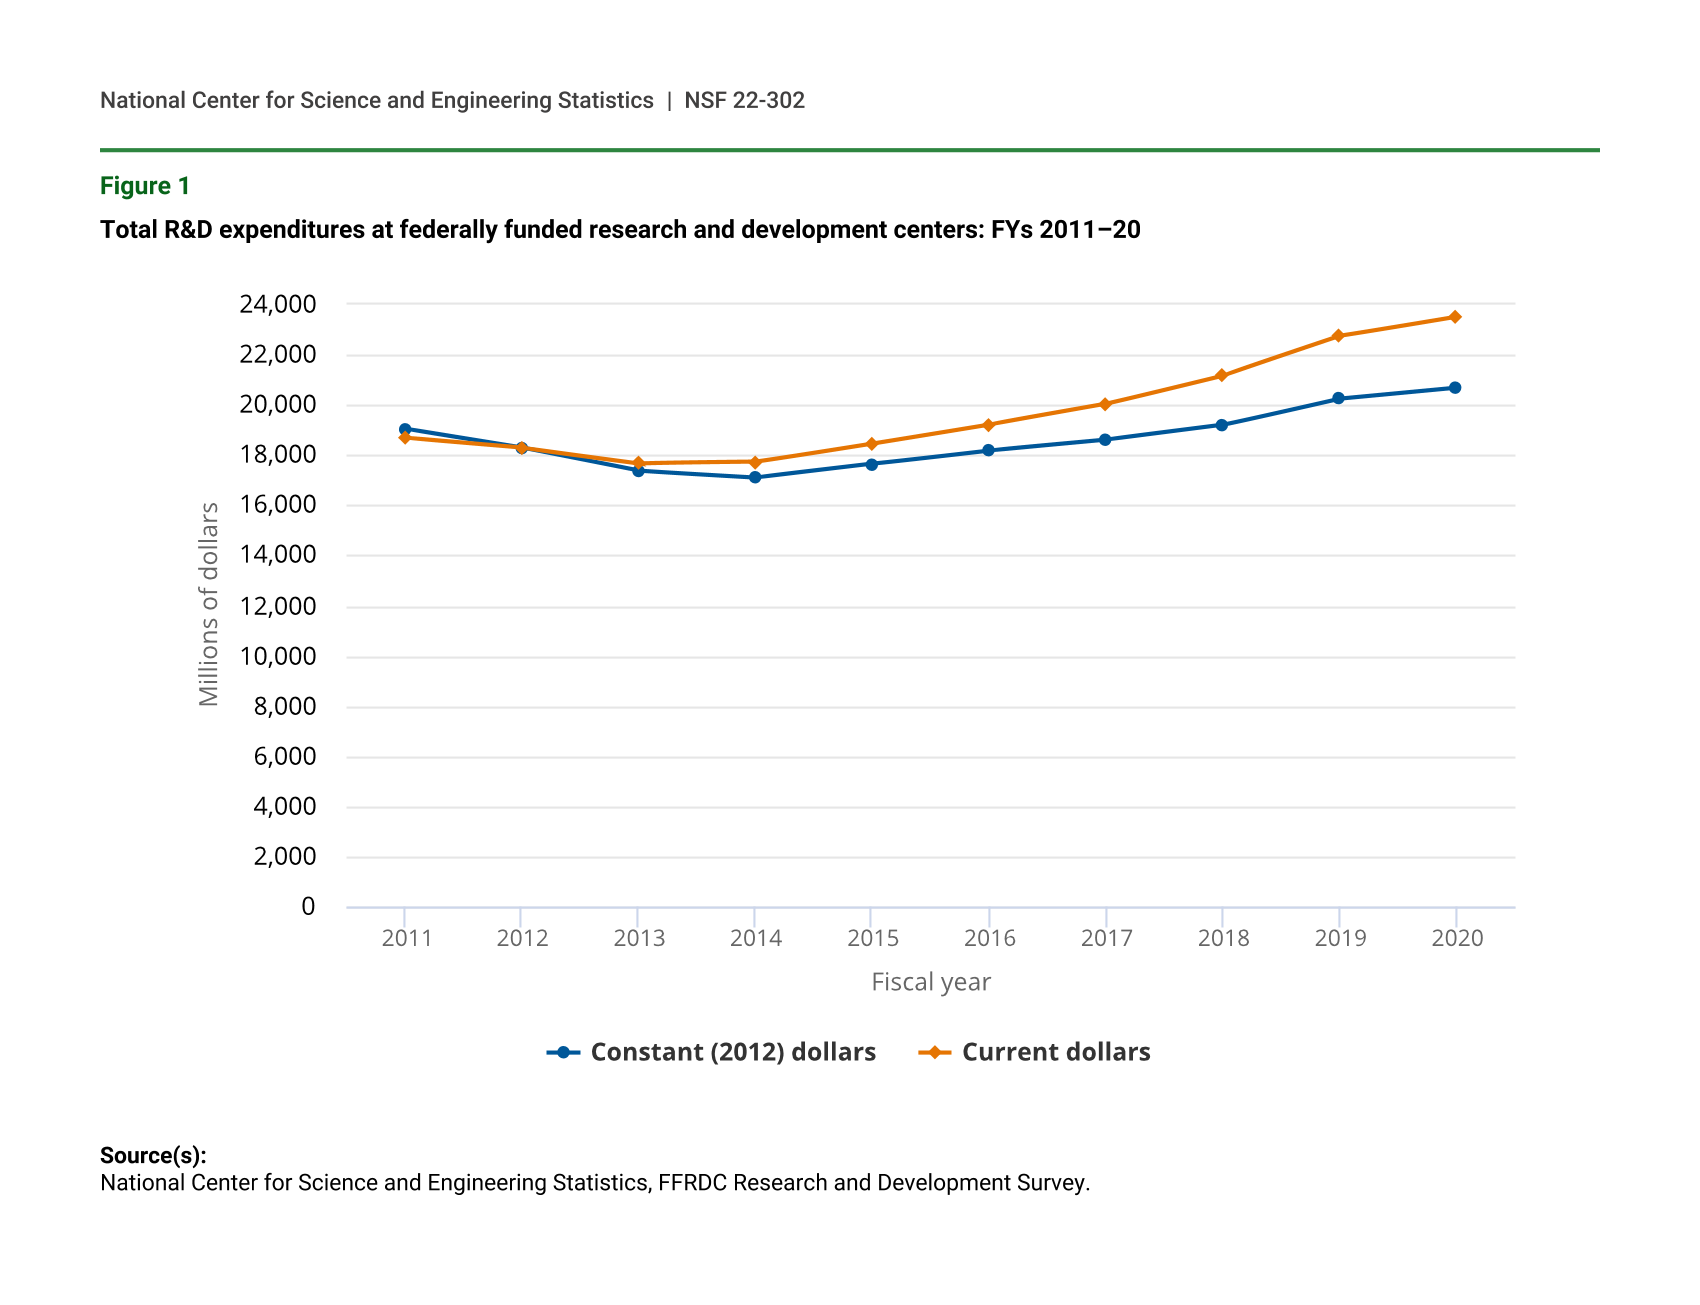
The nation’s 42 federally funded research and development centers (FFRDCs) spent $23.5 billion on research and development in FY 2020, an annual increase of 3.4% in current dollars (table 1). The federal government’s share of support reached $23.1 billion in FY 2020 and represented a 3.6% increase in federal R&D support to FFRDCs—the seventh consecutive year of nominal growth after performance declines in FYs 2011–13. In constant dollars, total FFRDC R&D expenditures rose an average of 0.9% annually from 2011 to 2020 (figure 1). These and the other statistics in this report come from the FY 2020 FFRDC Research and Development Survey, conducted by the National Center for Science and Engineering Statistics within the National Science Foundation.
R&D expenditures at federally funded research and development centers, by source of funds: FYs 2011–20
Source(s):
National Center for Science and Engineering Statistics, FFRDC Research and Development Survey.
Total R&D expenditures at federally funded research and development centers: FYs 2011–20
| Fiscal year | Constant (2012) dollars | Current dollars |
|---|---|---|
| 2011 | 19,029 | 18,671 |
| 2012 | 18,281 | 18,281 |
| 2013 | 17,361 | 17,667 |
| 2014 | 17,097 | 17,719 |
| 2015 | 17,643 | 18,458 |
| 2016 | 18,180 | 19,220 |
| 2017 | 18,604 | 20,038 |
| 2018 | 19,195 | 21,172 |
| 2019 | 20,255 | 22,738 |
| 2020 | 20,695 | 23,514 |
Source(s):
National Center for Science and Engineering Statistics, FFRDC Research and Development Survey.
R&D by Funding Source
FFRDCs are privately operated R&D organizations that are exclusively or substantially financed by the federal government. Over 98% ($23.1 billion) of FFRDC R&D expenditures were funded by the federal government in FY 2020 (table 1). Nonfederal sources funded the remaining R&D, totaling about $380.7 million, including businesses ($172.9 million); nonprofit organizations ($47.1 million); state and local governments ($44.0 million); and all other sources ($116.8 million), such as funds from foreign governments and foreign or U.S. universities.
Federal Agency Sources of R&D Funding
Almost 91% of federally funded R&D expenditures at FFRDCs came from four agencies (table 2). The Department of Energy (DOE) ($12.1 billion) accounted for 53% of federally funded R&D spending. The Department of Defense (DOD) ($5.1 billion, or 22%), National Aeronautics and Space Administration ($2.8 billion, or 12%), and the Department of Health and Human Services ($1.1 billion, or 4.6%), which includes the National Institutes of Health, were the only other agencies funding greater than $1 billion. Just under $2 billion of federally funded R&D came from agencies other than the largest four. FFRDCs identified 28 agencies as sources of federal funding.
Federally financed R&D expenditures at federally funded research and development centers, by federal agency: FY 2020
FFRDC = federally funded research and development center.
a Some funding sources were not identified for security reasons or because the original source was not known.
Source(s):
National Center for Science and Engineering Statistics, FFRDC Research and Development Survey, FY 2020.
Expenditure Trends at Specific FFRDCs
The majority of FFRDCs (26 centers) increased R&D spending in FY 2020 compared with FY 2019, with 6 centers reporting an increase greater than 10% (table 3). Nine FFRDCs reported more than $1 billion each (a combined $16.4 billion) in R&D expenditures for FY 2020: the National Aeronautics and Space Administration–sponsored Jet Propulsion Laboratory; five DOE-sponsored national laboratories specializing in energy and the environment, national security, and nuclear science (Lawrence Livermore, Los Alamos, Oak Ridge, Pacific Northwest, and Sandia); the DOD-sponsored National Security Engineering Center; Lincoln Laboratory (jointly sponsored by the DOD and the Office of the Secretary of Defense); and the Aerospace FFRDC, which is jointly sponsored by DOD and the Air Force. Sandia National Laboratories was the largest performer, with almost $3.4 billion in total R&D. Los Alamos National Laboratory and Oak Ridge National Laboratory reported the largest dollar increases in R&D of any centers, increasing by $261 million and $162 million, respectively, in FY 2020. Lower expenditures were recorded by 16 FFRDCs in FY 2020, with 2 centers declining more than 10%. Of the 41 FFRDCs listed continuously since 2016, 33 centers reported larger expenditures in FY 2020 compared to FY 2016.
R&D expenditures at federally funded research and development centers, by FFRDC: FYs 2016–20
na = not applicable.
FFRDC = federally funded research and development center; NSF = National Science Foundation.
Source(s):
National Center for Science and Engineering Statistics, FFRDC Research and Development Survey.
Expenditures, by Type of R&D
In FY 2020, basic research activities accounted for 20% of total FFRDC R&D expenditures, 2 percentage points lower than in FY 2016 (table 4). The remaining R&D expenditures were divided evenly between applied research and experimental development (at about 40% each). Overall, total basic research expenditures at FFRDCs increased by $488 million in current dollars from FY 2016 to FY 2020. Applied research expenditures and experimental development each increased by $1.9 billion during the same period.
R&D expenditures at federally funded research and development centers, by type of R&D: FYs 2016–20
Note(s):
Detail may not add to total because of rounding.
Source(s):
National Center for Science and Engineering Statistics, FFRDC Research and Development Survey.
Locations of FFRDCs
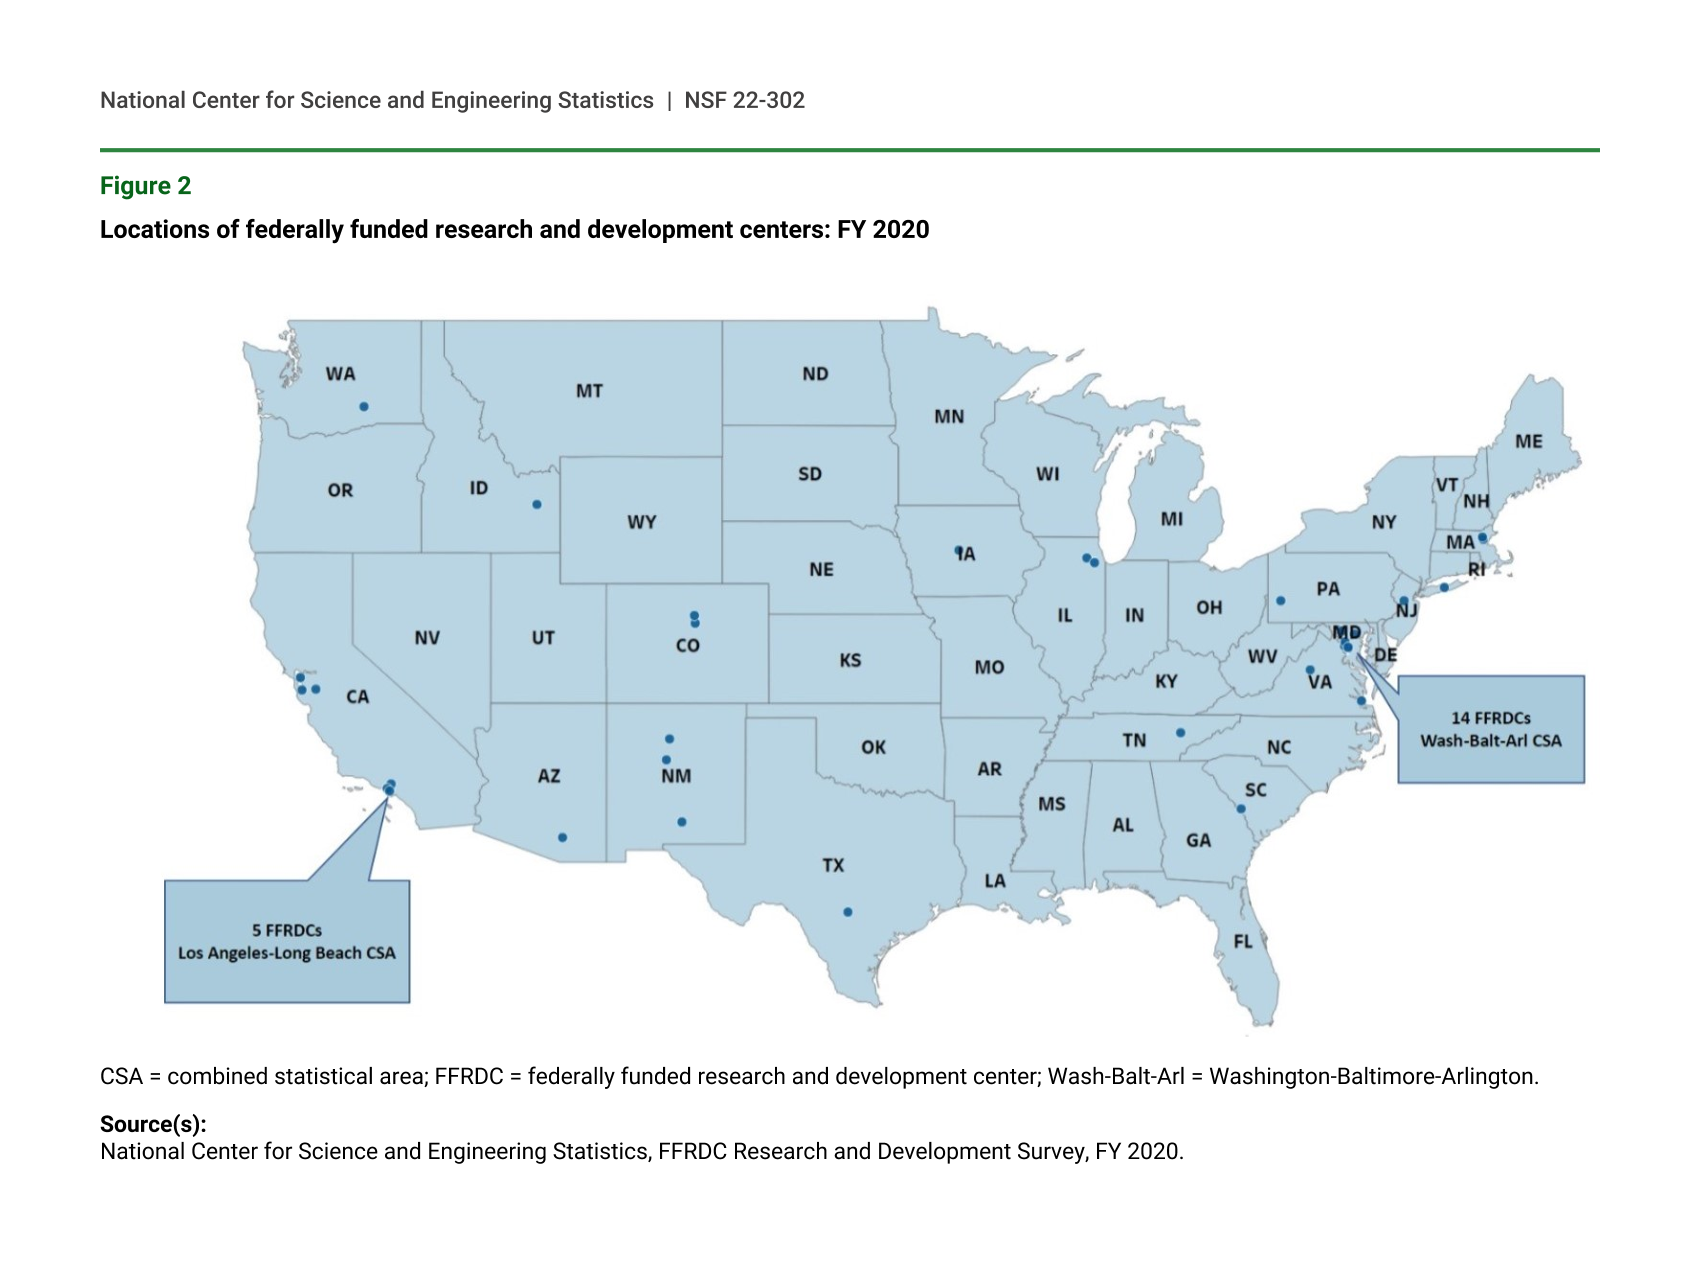
The 42 FFRDCs are located in 17 states and the District of Columbia (figure 2). Virginia, with 11 research centers, and California, with 8 research centers, have the most FFRDCs. Other states with several FFRDCs include Maryland (4), New Mexico (3), Colorado (2), Illinois (2), and Massachusetts (2). The National Security Engineering Center is the only FFRDC with locations in two states: Massachusetts and Virginia. The Washington-Baltimore-Arlington Combined Statistical Area (CSA) includes 14 FFRDCs due to the proximity of the federal government, although the R&D conducted by these FFRDCs totaled only $2.5 billion in FY 2020. The Los Angeles–Long Beach CSA included 5 FFRDCs with $3.9 billion in R&D, and the San Jose–San Francisco–Oakland CSA included 3 FFRDCs with R&D of $2.9 billion.
Locations of federally funded research and development centers: FY 2020
CSA = combined statistical area; FFRDC = federally funded research and development center; Wash-Balt-Arl = Washington-Baltimore-Arlington.
Source(s):
National Center for Science and Engineering Statistics, FFRDC Research and Development Survey, FY 2020.
Data Sources, Limitations, and Availability
The statistics on FFRDC R&D expenditures presented in this report come from the FY 2020 FFRDC Research and Development Survey. This annual survey is completed by FFRDC administrators and collects data from FFRDCs on R&D expenditures by source of funds (federal government, state and local governments, businesses, nonprofit organizations, or other); federal agency source; type of R&D (basic research, applied research, or experimental development); type of cost (salaries, software, equipment, subcontracts, other direct costs, and indirect costs); and total operating budget. This survey has been a census of the full population of FFRDCs since FY 2001. For a list of criteria used to define the set of FFRDCs, see the general guidelines of the Master Government List of FFRDCs at https://www.nsf.gov/statistics/ffrdclist/#guide&gennotes.
The full set of data tables from this survey and more information on the survey methodology are available at https://ncses.nsf.gov/pubs/nsf22304/.
Notes
1The National Center for Science and Engineering Statistics was informed in June 2021 that the Green Bank Observatory separated from the National Radio Astronomy Observatory in October 2016 to become an independent institution; both retained FFRDC status. The Master Government List of FFRDCs was subsequently updated to reflect this change.
2On 1 October 2019, the National Optical Astronomy Observatory was renamed NSF’s National Optical-Infrared Astronomy Research Laboratory. The new laboratory also incorporates operations of the International Gemini Observatory and the Vera C. Rubin Observatory. This new organization contributed to the 90% growth in R&D in FY 2020. See also https://noirlab.edu/public/about/history-of-noao/.
3Definitions of CSAs of the United States and Puerto Rico can be found at https://www.census.gov/geographies/reference-maps/2020/geo/csa.html.
Suggested Citation
Gibbons MT; National Center for Science and Engineering Statistics (NCSES). 2021. Federally Funded R&D Centers Report 3% Increase in R&D Spending in FY 2020. NSF 22-302. Alexandria, VA: National Science Foundation. Available at https://ncses.nsf.gov/pubs/nsf22302/.
Contact Us
NCSES
National Center for Science and Engineering Statistics
Directorate for Social, Behavioral and Economic Sciences
National Science Foundation
2415 Eisenhower Avenue, Suite W14200
Alexandria, VA 22314
Tel: (703) 292-8780
FIRS: (800) 877-8339
TDD: (800) 281-8749
E-mail: ncsesweb@nsf.gov