 An official website of the United States government
Higher Education R&D Increase of 3.3% in FY 2020 Is the Lowest since FY 2015
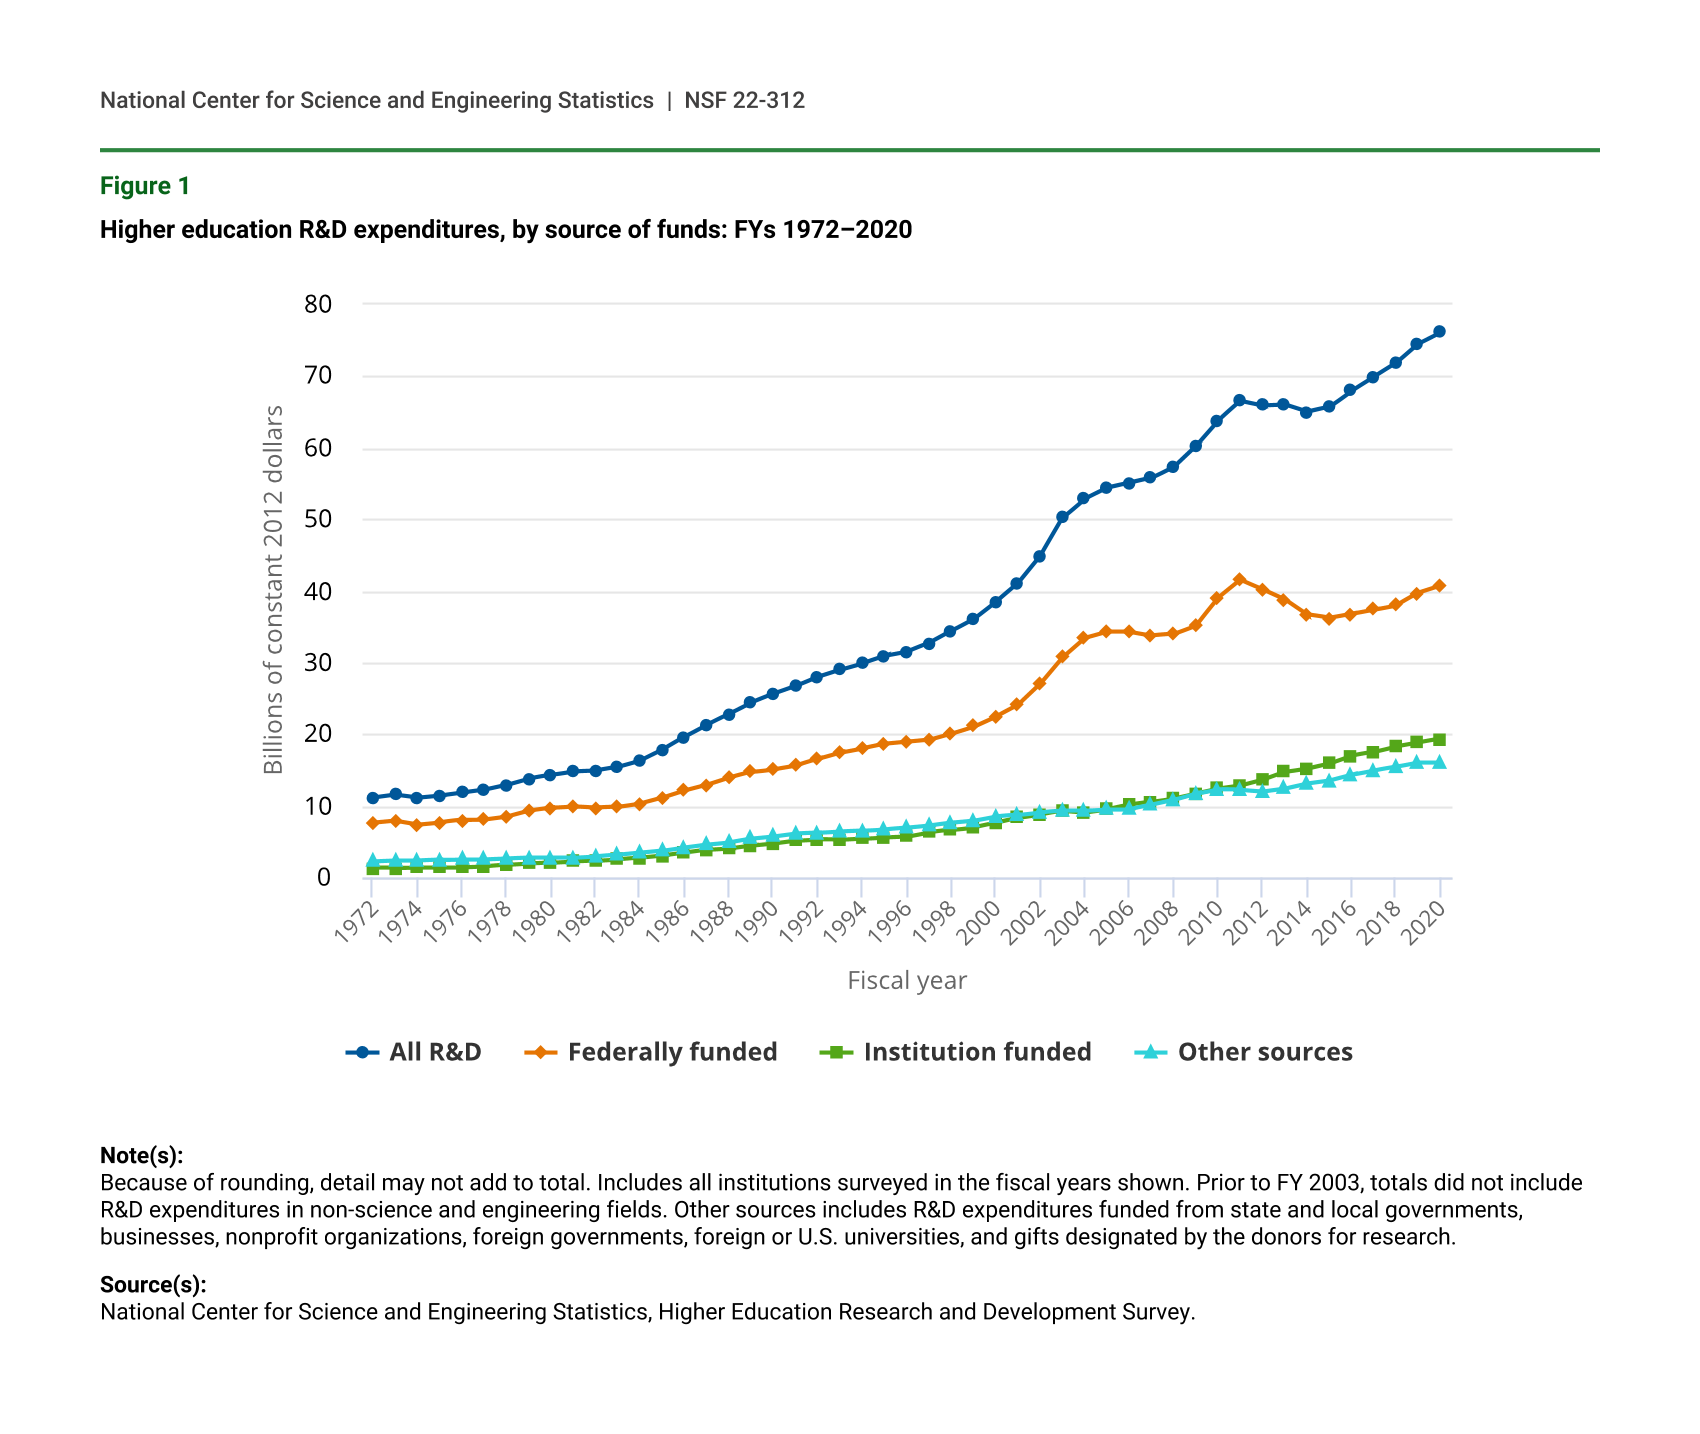
Research and development spending by academic institutions totaled $86.4 billion in FY 2020, an increase of $2.7 billion (3.3%) from FY 2019 (table 1). This was the slowest growth since the 4 years of decreasing federal funding from FY 2012 to FY 2015. Despite the recent year’s slower growth, due in part to the COVID-19 pandemic (see “R&D Disruptions Due to the Pandemic”), R&D expenditures funded from federal sources and institutions’ own funds rose annually in both current and constant dollars from FY 2016 to FY 2020 (figure 1 and table 1). R&D funded by all other nonfederal sources increased in current dollars from FY 2019 to FY 2020 but were unchanged in constant dollars. The data discussed in this report are from the Higher Education Research and Development (HERD) Survey, sponsored by the National Center for Science and Engineering Statistics (NCSES) within the National Science Foundation. For more information on the survey, see “Data Sources, Limitations, and Availability.”
Higher education R&D expenditures, by source of funds: FYs 2010–20
Note(s):
Because of rounding, detail may not add to total. Includes all institutions surveyed in the fiscal years shown.
Source(s):
National Center for Science and Engineering Statistics, Higher Education Research and Development Survey.
Higher education R&D expenditures, by source of funds: FYs 1972–2020
| Fiscal year | All R&D | Federally funded | Institution funded | Other sources |
|---|---|---|---|---|
| 1972 | 11.1 | 7.6 | 1.3 | 2.2 |
| 1973 | 11.5 | 7.9 | 1.3 | 2.3 |
| 1974 | 11.1 | 7.4 | 1.4 | 2.3 |
| 1975 | 11.4 | 7.7 | 1.4 | 2.4 |
| 1976 | 11.8 | 8.0 | 1.4 | 2.5 |
| 1977 | 12.2 | 8.1 | 1.5 | 2.5 |
| 1978 | 12.9 | 8.5 | 1.7 | 2.6 |
| 1979 | 13.8 | 9.3 | 1.9 | 2.7 |
| 1980 | 14.3 | 9.7 | 2.0 | 2.7 |
| 1981 | 14.8 | 9.9 | 2.2 | 2.7 |
| 1982 | 14.9 | 9.7 | 2.3 | 2.9 |
| 1983 | 15.4 | 9.8 | 2.5 | 3.1 |
| 1984 | 16.3 | 10.3 | 2.7 | 3.4 |
| 1985 | 17.8 | 11.1 | 3.0 | 3.7 |
| 1986 | 19.6 | 12.1 | 3.4 | 4.2 |
| 1987 | 21.3 | 12.9 | 3.8 | 4.6 |
| 1988 | 22.8 | 13.9 | 4.0 | 4.9 |
| 1989 | 24.4 | 14.7 | 4.4 | 5.4 |
| 1990 | 25.6 | 15.1 | 4.7 | 5.7 |
| 1991 | 26.7 | 15.6 | 5.1 | 6.1 |
| 1992 | 28.0 | 16.5 | 5.3 | 6.2 |
| 1993 | 29.0 | 17.4 | 5.2 | 6.4 |
| 1994 | 29.9 | 18.0 | 5.4 | 6.5 |
| 1995 | 30.9 | 18.6 | 5.6 | 6.7 |
| 1996 | 31.5 | 18.9 | 5.7 | 6.9 |
| 1997 | 32.7 | 19.2 | 6.3 | 7.2 |
| 1998 | 34.4 | 20.1 | 6.6 | 7.6 |
| 1999 | 36.1 | 21.1 | 7.0 | 7.9 |
| 2000 | 38.5 | 22.5 | 7.6 | 8.5 |
| 2001 | 41.1 | 24.1 | 8.3 | 8.7 |
| 2002 | 44.9 | 27.0 | 8.8 | 9.1 |
| 2003 | 50.2 | 30.7 | 9.3 | 9.3 |
| 2004 | 52.9 | 33.4 | 9.1 | 9.3 |
| 2005 | 54.4 | 34.3 | 9.5 | 9.5 |
| 2006 | 55.1 | 34.3 | 10.1 | 9.5 |
| 2007 | 55.8 | 33.8 | 10.5 | 10.1 |
| 2008 | 57.4 | 34.0 | 11.0 | 10.8 |
| 2009 | 60.3 | 35.2 | 11.7 | 11.7 |
| 2010 | 63.8 | 39.0 | 12.4 | 12.3 |
| 2011 | 66.5 | 41.5 | 12.8 | 12.2 |
| 2012 | 65.9 | 40.2 | 13.6 | 12.0 |
| 2013 | 66.0 | 38.8 | 14.7 | 12.4 |
| 2014 | 65.0 | 36.7 | 15.2 | 13.1 |
| 2015 | 65.7 | 36.2 | 15.9 | 13.5 |
| 2016 | 68.0 | 36.8 | 17.0 | 14.3 |
| 2017 | 69.9 | 37.4 | 17.5 | 14.9 |
| 2018 | 71.8 | 38.0 | 18.3 | 15.4 |
| 2019 | 74.5 | 39.7 | 18.8 | 16.0 |
| 2020 | 76.1 | 40.7 | 19.3 | 16.0 |
Note(s):
Because of rounding, detail may not add to total. Includes all institutions surveyed in the fiscal years shown. Prior to FY 2003, totals did not include R&D expenditures in non-science and engineering fields. Other sources includes R&D expenditures funded from state and local governments, businesses, nonprofit organizations, foreign governments, foreign or U.S. universities, and gifts designated by the donors for research.
Source(s):
National Center for Science and Engineering Statistics, Higher Education Research and Development Survey.
R&D Expenditures, by Source of Funding
Federally funded R&D at universities increased 3.7% to $46.2 billion in FY 2020 (table 1). This total was $1.7 billion greater than the FY 2019 total, but the increase was almost $1 billion less than the increase from FY 2018 to FY 2019. The share of higher education R&D supported by the federal government remained at about 53% for the fourth consecutive year after declining gradually from 62% in FY 2011. Fiscal year 2011 was the peak year for higher education R&D expenditures funded by the American Recovery and Reinvestment Act of 2009.
Institutions’ own funding, which rose $843 million (4.0%) from FY 2019 to FY 2020, has steadily accounted for 25% of R&D expenditures for the last 5 years. This is the second-largest share behind federally funded R&D expenditures. Also increased from FY 2019 were R&D expenditures funded by businesses ($123 million, or 2.4%), state and local governments ($85 million, or 1.9%), and nonprofit organizations ($56 million, or 1.0%). R&D expenditures funded from all other sources decreased by $20 million (-0.7%).
The largest federal source of R&D expenditures for higher education institutions was the Department of Health and Human Services (HHS)—which includes the National Institutes of Health—at $25.4 billion, up $973 million in FY 2020 (table 2). The growth in HHS-funded R&D was less than in FY 2019 ($1.6 billion) and FY 2018 ($1.2 billion). Yet, HHS accounted for 55% of FY 2020 federally funded R&D and 59% of the overall FY 2020 increase in federally funded R&D. The Department of Defense ($426 million increase), the National Aeronautics and Space Administration ($113 million increase), the Department of Energy ($98 million increase), and the National Science Foundation ($82 million increase) together accounted for most of the remaining federally funded expenditure increases. R&D expenditures funded by the Department of Agriculture ($21 million increase) also contributed to the growth. All other federal sources declined 1.5%, or $50 million.
Higher education R&D expenditures, by source of funds: FYs 2010–20
DOD = Department of Defense; DOE = Department of Energy; HHS = Department of Health and Human Services; NASA = National Aeronautics and Space Administration; NSF = National Science Foundation; USDA = Department of Agriculture.
Note(s):
Because of rounding, detail may not add to total. Beginning in FY 2012, institutions reporting less than $1 million in total R&D expenditures completed a shorter version of the survey questionnaire and those totals are not reflected here. Total expenditures from institutions reporting less than $1 million in R&D in FY 2020 was $139 million. Total federally funded R&D for these institutions was $76 million.
Source(s):
National Center for Science and Engineering Statistics, Higher Education Research and Development Survey.
R&D Expenditures, by Field
R&D expenditures in all science fields combined increased $2.1 billion (3.2%) in FY 2020, reaching $67.6 billion. Engineering R&D expenditures ($13.7 billion total) increased 3.6% and non-science and engineering ($5.0 billion total) increased 3.5% (table 3). R&D expenditures in the life sciences subfields of biological and biomedical sciences (up $369 million to $15.8 billion) and health sciences (up $734 million to $28.0 billion) accounted for 40% of the total growth in FY 2020. While this share is substantial, these two subfields accounted for a greater share of the total R&D increase between FYs 2018 and 2019 (53%) and between FYs 2017 and 2018 (66%). HHS funding, as would be expected, is a large contributor to the life sciences R&D trends.
R&D expenditures in computer and information sciences were also significantly greater in FY 2020, increasing 11% ($284 million) to $2.9 billion. Additionally, R&D in several subfields increased by more than $100 million from FY 2019 to FY 2020, including agricultural sciences (up $199 million, or 5.8%); aerospace, aeronautical, and astronautical engineering (up $126 million, or 11%); electrical, electronic, and communications engineering (up $110 million, or 3.7%); mechanical engineering (up $107 million, or 6.3%); physics (up $107 million, or 4.6%); and economics (up $102 million, or 22%).
Higher education R&D expenditures, by R&D field: FYs 2019–20
nec = not elsewhere classified; S&E = science and engineering.
Note(s):
This table includes only institutions reporting $1 million or more in total R&D expenditures in FY 2019. Institutions reporting less than $1 million in total R&D expenditures in FY 2019 completed a shorter version of the survey form in FY 2020 that did not include this question. Total expenditures from institutions reporting less than $1 million in R&D in FY 2020 was $138,876 thousand.
Source(s):
National Center for Science and Engineering Statistics, Higher Education Research and Development Survey.
R&D Personnel
The HERD Survey collected new data for R&D personnel for FY 2020 for the 655 institutions reporting at least $1 million in R&D. From FY 2010 to FY 2019, respondents provided R&D headcounts for two categories: principal investigators and all other personnel. Beginning in FY 2020, respondents provided headcounts and full-time equivalent (FTE) totals for three personnel functions: researchers, R&D technicians, and R&D support staff. This included all personnel and students paid from R&D accounts and excluded personnel that would be considered indirect research support such as research administration and other personnel not paid for work on specific research projects.
Across the three R&D functions, an estimated 956,000 university personnel accounted for 440,000 R&D-performing FTEs. The 348,000 researchers (176,000 FTEs) comprised the largest personnel category, slightly greater than the 343,000 R&D technicians (169,000 FTEs). R&D support staff totaled 265,000 personnel with an FTE estimate of 95,000.
R&D Disruptions Due to the Pandemic
As the worldwide COVID-19 pandemic expanded in early 2020, there was considerable concern regarding the potential disruption of R&D activities on our nation’s campuses. To address such concerns, several questions were included on the FY 2020 HERD Survey that specifically asked about the pandemic’s impact on the university research enterprise.
By June 2020, which is the end of the typical academic fiscal year, about a third of universities reporting at least $1 million in R&D could perform all or almost all of their R&D as expected. Slightly more than half (54%) could perform some R&D and the remaining 11% could perform very little or no R&D. As the pandemic impacted the conduct of R&D and forced universities to quickly identify essential activities, some R&D funds were diverted from their originally intended research focus. About a third of these institutions said that R&D funds were diverted from their original research focus. Twenty-seven percent of all respondents said that 20% or less of their R&D funds were diverted. Almost 4% said that 21%–40% of their funds were diverted. Less than 3% said that more than 40% of their R&D funds were diverted. In general, institutions in the top four deciles—those reporting about $26 million or more in R&D and accounting for 97% of total R&D—had fewer disruptions and were more likely to receive new R&D funds as a result of the pandemic than those reporting below this total.
When asked whether any new funds or supplemental funds for ongoing R&D were received because of the pandemic, including those related directly to COVID-19 R&D or ancillary impacts of the pandemic, 52% of academic institutions responded that such funds were received. Funders from all sectors provided new or supplemental funds to academic institutions, with the federal government being the most commonly cited source.
Top University Research Performers
The top 30 institutions in terms of R&D expenditures accounted for 42% of the total spent on R&D within the higher education sector in FY 2020, virtually the same share as in FY 2019 and FY 2018 (table 4). Twenty-one institutions reported at least $1 billion in R&D during FY 2020. Fourteen institutions crossed that reporting threshold in FY 2018. Seventeen of the top 30 were public institutions, accounting for $20.3 billion in total R&D expenditures, and 13 were private institutions accounting for $16.3 billion. Institutions with medical schools were well-represented in this group; 26 of the top 30 reported medical school R&D expenditures.
Texas A&M University, College Station and Health Science Center rose 8 positions to number 14 due in part to a substantial contract with HHS for its Center for Innovation in Advanced Development and Manufacturing (CIADM) to provide for delivery of a safe and effective vaccine for the COVID-19 pandemic. CIADM was part of Operation Warp Speed. In part due to these activities, Texas A&M University’s expenditures funded through received subawards increased $138 million in FY 2020. Their expenditures passed through to subrecipients also increased in FY 2020 by $150 million. The Massachusetts Institute of Technology moved down 5 positions to number 23 after reporting $21 million less in R&D, taking them to just under $1 billion in FY 2020.
Thirty institutions reporting the largest FY 2020 R&D expenditures in all fields: FYs 2018–20
na = not applicable; institution did not exist or did not exist as a separate entity.
a Johns Hopkins University includes the Applied Physics Laboratory, with $1,909 million in total R&D expenditures in FY 2020.
b University of Maryland includes expenditures from University of Maryland, Baltimore and University of Maryland, College Park campuses. In FY 2019, the two campuses began reporting as one research unit to reflect their new strategic partnership. This relationship was codified through the University of Maryland Strategic Partnership Act passed by the Maryland General Assembly in 2016. Prior to 2019, both campuses reported to the Higher Education Research and Development Survey as separate institutions.
Note(s):
Because of rounding, detail may not add to total. This table reflects the leading 30 institutions for FY 2020; the institutions listed may not be in the top 30 of prior fiscal years.
Source(s):
National Center for Science and Engineering Statistics, Higher Education Research and Development Survey.
Data Sources, Limitations, and Availability
The higher education R&D expenditures data were collected from a census of 915 universities and colleges that grant a bachelor’s degree or higher and expended at least $150,000 in R&D in FY 2019. To reduce respondent burden, the HERD Survey requests abbreviated data from institutions reporting less than $1 million in R&D expenditures during the previous fiscal year. Except for the totals reported in table 1 and figure 1, all other totals shown in this InfoBrief exclude expenditures from the 260 institutions that completed a short-form version of the survey. The institutions completing the short-form survey accounted for $139 million (0.2%) of total higher education R&D expenditures in FY 2020.
The fiscal year referred to throughout this report is the academic fiscal year. For most academic institutions, FY 2020 represents 1 July 2019 through 30 June 2020.
The amounts reported include all funds expended for activities specifically organized to produce research outcomes and sponsored by an outside organization or separately accounted for using institution funds. R&D expenditures at university-administered federally funded research and development centers (FFRDCs) are collected in a separate survey, the FFRDC Research and Development Survey, available at https://www.nsf.gov/statistics/ffrdc/.
The full set of data tables and technical information from this survey are available at https://ncses.nsf.gov/pubs/nsf22311/.Notes
1For more details on expenditures funded by the American Recovery and Reinvestment Act of 2009, see the following NCSES InfoBrief: Britt R. 2015; National Center for Science and Engineering (NCSES). Higher Education R&D Expenditures Resume Slow Growth in FY 2013. NSF 15-314. Alexandria, VA: National Science Foundation. Available at https://www.nsf.gov/statistics/2015/nsf15314/.
2All other sources include such sources as funds from foreign governments, foreign or other U.S. universities, and gifts designated by donors for research.
3See table 9 in the HERD FY 2020 data tables for expenditures by R&D field for FYs 2010–20.
4The three R&D functions are defined as follows:
Researchers: Professionals engaged in the conception or creation of new knowledge, products, processes, or methods and systems and also in the management of the projects concerned. R&D managers are included in this category.
R&D technicians: Persons whose main tasks require technical knowledge and experience in one or more fields of science or engineering but who contribute to R&D by performing technical tasks such as computer programming, data analysis, ensuring accurate testing, operating lab equipment, and preparing and processing samples under the supervision of researchers.
R&D support staff: Not directly involved with the conduct of a research project but support the researchers and technicians. These employees might include clerical staff, financial and personnel administrators, report writers, patent agents, safety trainers, equipment specialists, and other related employees.
The distinction between a researcher and an R&D technician is attributable to researchers contributing more to the creative aspects of R&D whereas technicians provide technical support. For example, a researcher (scientist or engineer) would design an experiment and a technician would run the experiment and assist in analyzing results.
5See Council on Governmental Relations (COGR). 2020. Research Impact Under COVID-19: Financial Crisis and the “Pandemic Normal.” Washington, DC: COGR. https://www.cogr.edu/sites/default/files/Research_COVID_August2020_COGR_FINAL.pdf. This paper presents a model for estimating research output loss and financial impact, describes the challenges of doing research under the new “Pandemic Normal,” and advocates for renewed commitment by federal leaders, research institutions, and all stakeholders to the longstanding Federal Government-Research Institution Partnership.
6Respondents to the HERD Survey were asked to respond to three qualitative questions on the impacts of the pandemic on R&D as of June 2020, which is the end of the typical academic fiscal year. About 97% of institutions responded to these questions. The data noted above include responses from HERD standard form institutions. Smaller institutions, reporting R&D between $150,000 and $1 million, were less able to perform all or almost all of their R&D as expected (26%) by June 2020. Fifteen percent had R&D funds diverted from their originally intended research focus due to the pandemic, although they had higher percentages diverted than the larger universities due to the lower overall totals. Compared to the 52% of larger institutions that received new or supplemental funds for ongoing R&D as a result of the pandemic, 17% of institutions with under $1 million in R&D reported receipt of such funds.
The percentages displayed for the COVID-19 impact questions do not include estimation for nonresponses. A total of 899 institutions submitted surveys: 640 for the standard form, and 259 for the short form. Total nonresponse for each question was as follows: Question A: 10 standard form nonresponses, 1 short form nonresponse; Question B: 12 standard form nonresponses, 1 short form nonresponse; Question C: 12 standard form nonresponses, 1 short form nonresponse.
Copies of the questionnaires are located at https://www.nsf.gov/statistics/srvyherd/#qs.
7See HERD FY 2020, table 71, for R&D expenditures at institutions with a medical school and by institutional control.
Suggested Citation
Gibbons, MT; National Center for Science and Engineering Statistics (NCSES). 2021. Higher Education R&D Increase of 3.3% Is the Lowest Since FY 2015. NSF 22-312. Alexandria, VA: National Science Foundation. Available at https://ncses.nsf.gov/pubs/nsf22312/.
Contact Us
NCSES
National Center for Science and Engineering Statistics
Directorate for Social, Behavioral and Economic Sciences
National Science Foundation
2415 Eisenhower Avenue, Suite W14200
Alexandria, VA 22314
Tel: (703) 292-8780
FIRS: (800) 877-8339
TDD: (800) 281-8749
E-mail: ncsesweb@nsf.gov