 An official website of the United States government
 Baccalaureate Origins of U.S. Research Doctorate Recipients
Baccalaureate education plays a key role in the educational pathways of research doctorate recipients. Most doctoral students earning research doctorates in the United States received their baccalaureate from institutions in the Carnegie Classification group R1: doctoral universities (very high research activity) or from foreign academic institutions. However, on a per capita basis, more graduates from Carnegie-classified baccalaureate colleges: arts and sciences focus earn a doctoral degree in science and engineering (S&E) than their peers at other types of Carnegie Classification of institutions. This InfoBrief examines the top producing baccalaureate-origin institutions of research doctorate recipients in S&E and non-S&E fields over the past decade, updating and augmenting the analysis reported in two earlier InfoBriefs.
Baccalaureate Origins by Institution Type
In 2020, just over 34.4% of the 55,283 U.S. research doctorate recipients earned their baccalaureate from a non-U.S. institution (table 1). This represented a 4.4% percentage-point increase in the number of doctorate recipients with foreign bachelor’s degrees since 2010 and parallels the growth of temporary visa holders earning doctorates in the United States. Foreign bachelor’s degrees were more common among doctorate recipients in S&E fields than non-S&E fields across all years, accounting for 38.0% of S&E doctorate recipients and 22.2% of non-S&E doctorates in 2020.
Among research doctorate recipients in 2020 with bachelor’s degrees from U.S. institutions, R1: doctoral universities were the most common baccalaureate-origin institutions, followed by other doctoral universities, master’s colleges and universities, and baccalaureate colleges in the Carnegie Classification. This pattern can be seen in each year from 2010 through 2020 for all research doctorate recipients, and similar patterns are observed within S&E and non-S&E fields. Overall, a higher percentage of non-S&E doctorate recipients earned their baccalaureate from other Carnegie-class doctoral institutions, master’s colleges and universities, and baccalaureate colleges than S&E doctorate recipients (table 1).
Doctorate recipients, by field of doctorate and type of baccalaureate-origin institution: 2010–20
a Science and engineering includes health fields.
Note(s):
Baccalaureate-origin institutions in the United States are classified using the 2018 Basic Carnegie Classification. R1: doctoral universities are a single category of institution in the Carnegie Classification with very high research activity. Other doctoral universities include the R2: doctoral universities with high research activity and doctoral/professional universities. Master's colleges and universities include smaller, medium, and larger programs. Baccalaureate colleges include baccalaureate colleges: arts and sciences focus, baccalaureate colleges: diverse fields, and baccalaureate/associate's colleges. All other institutions include special focus institutions, tribal colleges, and unclassified institutions.
Source(s):
National Center for Science and Engineering Statistics, Survey of Earned Doctorates.
Table 2 and table 3 list the top 50 U.S. baccalaureate-origin institutions for S&E and non-S&E doctorate recipients from 2010 to 2020, respectively. These top 50 baccalaureate-origin institutions produced about one-fifth of total U.S. doctorate recipients, and R1: doctoral universities accounted for a large majority of these institutions. For those with S&E doctorates, 49 of the top 50 baccalaureate institutions were R1: doctoral universities. Among non-S&E doctorate recipients, 46 of the top 50 baccalaureate institutions were R1: doctoral universities. Brigham Young University, notably, was the only institution from R2: doctoral universities (high research activity) among the top 50 U.S. baccalaureate institutions for doctorate recipients in S&E fields (table 2) and was the top ranked U.S. baccalaureate institution for those in non-S&E fields (table 3). Public institutions accounted for 32 of the top 50 baccalaureate-origin institutions for the doctorate recipients in S&E and 34 of the top 50 for those in non-S&E.
Top 50 U.S. baccalaureate-origin institutions of S&E doctorate recipients from 2010–20, by institutional control and 2018 Carnegie Classification
na = not applicable; S&E = science and engineering (includes health fields).
Note(s):
Institutions with the same number of doctorate recipients are listed alphabetically. R1: doctoral universities are those with very high research activity. R2: doctoral universities are institutions with high research activity.
Source(s):
National Center for Science and Engineering Statistics, Survey of Earned Doctorates.
Top 50 U.S. baccalaureate-origin institutions of non-S&E doctorate recipients from 2010–20, by institutional control and 2018 Carnegie Classification
na = not applicable; S&E = science and engineering.
Note(s):
Institutions with the same number of doctorate recipients are listed alphabetically. R1: doctoral universities are institutions with very high research activity and R2: doctoral universities are institutions with high research activity.
Source(s):
National Center for Science and Engineering Statistics, Survey of Earned Doctorates.
Table 4 presents the top 10 U.S. baccalaureate-origin institutions of doctoral recipients from 2010 to 2020 by eight broad fields of doctorate, spanning both S&E (life sciences, physical sciences and earth sciences, mathematics and computer sciences, psychology and social sciences, and engineering) and non-S&E (education, humanities and arts, and other) fields. As in table 2 and table 3, R1: doctoral universities predominate the list, with only 1 institution—Brigham Young University—from R2: doctoral universities. Only 29 institutions are represented in the top 10 baccalaureate-origin institution lists across eight broad fields of doctorate, and 16 appear in more than one list. The University of Michigan, Ann Arbor is ranked in the top 10 for all eight broad fields of doctorate, while Cornell University; the University of California, Berkeley; and the University of Illinois, Urbana-Champaign are ranked in the top 10 for six broad doctorate fields. Public institutions constitute the majority of the top 10 lists in all but two broad fields: mathematics and computer science (7 of the top 10 institutions are private) and humanities and arts (6 of the top 10 are private).
Top 10 U.S. baccalaureate-origin institutions of doctorate recipients from 2010–20, by broad field of doctorate, institutional control, and 2018 Carnegie Classification
a Includes agricultural sciences and natural resources, biological and biomedical sciences, and health sciences.
b Includes other non-science and engineering fields not shown separately.
Note(s):
Institutions with the same number of doctorate recipients are listed alphabetically. R1: doctoral universities are institutions with very high research activity and R2: doctoral universities are institutions with high research activity.
Source(s):
National Center for Science and Engineering Statistics, Survey of Earned Doctorates.
Institutional-Yield Ratio for the Baccalaureate Origins of Doctorate Recipients
While the number of undergraduates at a particular institution or group of institutions who go on to earn their doctorate is a valuable statistic, it may underestimate the role of smaller institutions in the preparation of future doctoral researchers. Of the 2,414 institutions conferring 2,059,095 bachelor’s degrees in 2020, 131 R1: doctoral universities awarded 673,485 of those degrees (table 5). In other words, about 5.0% of the U.S. bachelor’s-granting institutions were responsible for more than 30.0% of bachelor’s degrees conferred. In comparison, baccalaureate colleges are far larger in number but confer far fewer bachelor’s degrees. For example, the 230 institutions described in the 2018 Carnegie Classification as baccalaureate colleges: arts and sciences focus were 9.5% of all U.S. bachelor’s degree–granting institutions but conferred only 3.8% of all bachelor’s degrees in 2020. Other Carnegie-class baccalaureate colleges represented 15.7% of all U.S. bachelor’s degree–granting institutions in 2020 and conferred 4.6% of all bachelor’s degrees (table 5).
Bachelor's degrees conferred by U.S. postsecondary institutions, by 2018 Carnegie Classification: 2020
Note(s):
Data include all postsecondary institutions in the United States (including outlying areas) participating in Title IV federal financial aid programs. Carnegie Classification is based on the 2018 Basic Classification. R1: doctoral universities are a single category of institution in the Carnegie Classification with very high research activity. Other doctoral universities include the R2: doctoral universities with high research activity and doctoral/professional universities. Master's colleges and universities include smaller, medium, and larger programs. Baccalaureate colleges include baccalaureate colleges: arts and sciences focus, baccalaureate colleges: diverse fields, and baccalaureate/associate's colleges. All other institutions include special focus institutions, tribal colleges, and unclassified institutions. Associate's and 2-year colleges include all high transfer, mixed transfer, and high career and technical associate's colleges, special focus 2-year institutions, and associate's dominant colleges.
Source(s):
Department of Education, National Center for Education Statistics, Integrated Postsecondary Education Data System (IPEDS), IPEDS Fall 2020 Completions Survey.
Because R1: doctoral universities confer so many bachelor’s degrees, rankings of baccalaureate-origins based solely on the absolute number of doctorate recipients reporting their undergraduate institutions overemphasize the role of larger institutions and understate the contributions of smaller baccalaureate colleges or master’s colleges and universities in the production of doctorate recipients. The institutional-yield ratio (IYR) metric was created to address this disparity. The IYR for a baccalaureate-origin institution is calculated as the number of baccalaureate graduates who earned a research doctorate in a given time period (2010–20 in this analysis), divided by the number of baccalaureate graduates from that institution for the time period 9 years prior to the doctorate award (2001–11). This figure is then multiplied by 100 to express the term as a percentage, or ratio. For example, if an institution has an IYR of 5.0 from 2010 to 2020, it is estimated that 5.0% of that institution’s baccalaureate recipients (5 out of every 100) went on to earn a research doctorate 9 years later.
Once the data are normalized in this way, a different picture emerges. Table 6 and table 7 present the top 50 baccalaureate-origin institutions for S&E and non-S&E doctorate recipients, respectively, by IYR. When ranked this way, both Carnegie-class baccalaureate colleges (arts and sciences focus as well as diverse fields) represent 25 of the top 50 baccalaureate-origin institutions for S&E doctorate recipients, including five women’s colleges (Bryn Mawr, Wellesley, Mount Holyoke, Smith, and Scripps), and R1: doctoral universities constitute 21 of the top 50 institutions (table 6). For non-S&E doctorate recipients, nearly three-quarters of the top 50 institutions were Carnegie-class baccalaureate colleges, including nine women’s colleges (Bryn Mawr, Barnard, Wellesley, Spelman, Smith, Scripps, Mount Holyoke, Agnes Scott, and Mills), whereas R1: doctoral universities represent only 8 of the top 50 institutions (table 7).
Top 50 U.S. baccalaureate-origin institutions of S&E doctorate recipients from 2010–20, by institutional-yield ratio, institutional control, and 2018 Carnegie Classification
S&E = science and engineering (includes health fields).
Note(s):
Institutional-yield ratio is the number of S&E doctorate recipients per 100 bachelor's degrees awarded in all fields 9 years earlier. Only institutions from which 50 or more baccalaureate recipients received S&E doctorate degrees between 2010 and 2020 were included in the analysis. Institutions are ranked on unrounded ratios. Institutions with the same number of doctorate recipients are listed alphabetically. R1: doctoral universities are institutions with very high research activity and R2: doctoral universities are institutions with high research activity.
Source(s):
National Center for Science and Engineering Statistics, Survey of Earned Doctorates; Department of Education, National Center for Education Statistics, Integrated Postsecondary Education Data System, Completions Survey.
Top 50 U.S. baccalaureate-origin institutions of non-S&E doctorate recipients, by institutional-yield ratio, institutional control, and 2018 Carnegie Classification: 2010–20
S&E = science and engineering.
Note(s):
Institutional-yield ratio is the number of S&E doctorate recipients per 100 bachelor's degrees awarded in all fields 9 years earlier. Only institutions from which 50 or more baccalaureate recipients received S&E doctorate degrees between 2010 and 2020 were included in the analysis. Institutions are ranked on unrounded ratios. Institutions with the same number of doctorate recipients are listed alphabetically. R1: doctoral universities are institutions with very high research activity and R2: doctoral universities are institutions with high research activity.
Source(s):
National Center for Science and Engineering Statistics, Survey of Earned Doctorates; Department of Education, National Center for Education Statistics, Integrated Postsecondary Education Data System, Completions Survey.
In the top baccalaureate-origin institutions ranked by IYR, public institutions nearly disappear from the table: for S&E doctorate recipients, public institutions represent only 3 of the top 50 institutions (table 6), while for non-S&E doctorate recipients, only 1 public institution—the College of William and Mary—made the top 50 (table 7).
Like table 4, table 8 presents the top 10 baccalaureate-origin institutions by broad field of doctorate but ranked by IYR rather than total number of doctorate recipients. Now the Carnegie-class baccalaureate colleges are considerably more prominent in the top baccalaureate-origin institution rankings, representing 47 of the 80 ranked institutions across eight broad fields of doctorate. Carnegie-class baccalaureate colleges represent 9 of the top 10 institutions in psychology and social sciences, 7 of the top 10 in life sciences, and 6 of the top 10 in physical sciences and earth sciences. R1: doctoral universities continue to constitute a substantial number of the top 10 baccalaureate-origin institutions in mathematics and computer sciences, engineering, and other non-S&E fields, representing half of the top 10 institutions.
Top 10 U.S. baccalaureate-origin institutions of doctorate recipients from 2010–20, by broad field of doctorate, institutional-yield ratio, institutional control, and 2018 Carnegie Classification
b Includes other non-science and engineering fields not shown separately.
Note(s):
Only institutions from which 25 or more baccalaureate recipients received doctorate degrees between 2010 and 2020 were included in the analysis. Institutions are ranked on unrounded ratios. Institutions with the same number of doctorate recipients are listed alphabetically. R1: doctoral universities are institutions with very high research activity and R2: doctoral universities are institutions with high research activity.
Source(s):
National Center for Science and Engineering Statistics, Survey of Earned Doctorates; Department of Education, National Center for Education Statistics, Integrated Postsecondary Education Data System, Completions Survey.
Swarthmore College is ranked in the top 10 for all the broad fields of doctorate except engineering, while Massachusetts Institute of Technology, Reed College, and the University of Chicago are ranked in the top 10 for five broad doctorate fields. Public institutions are much less prominent in the top 10 baccalaureate-origin institutions ranked by IYR, with only 5 of the 80 institutions across eight broad fields of doctorate. Private institutions accounted for all the top 10 institutions in five of eight broad doctorate fields: life sciences, mathematics and computer sciences, psychology and social sciences, humanities and arts, and other non-S&E fields.
Doctorate-Yield Ratios of Baccalaureate-Origin Institutions by Carnegie Classification
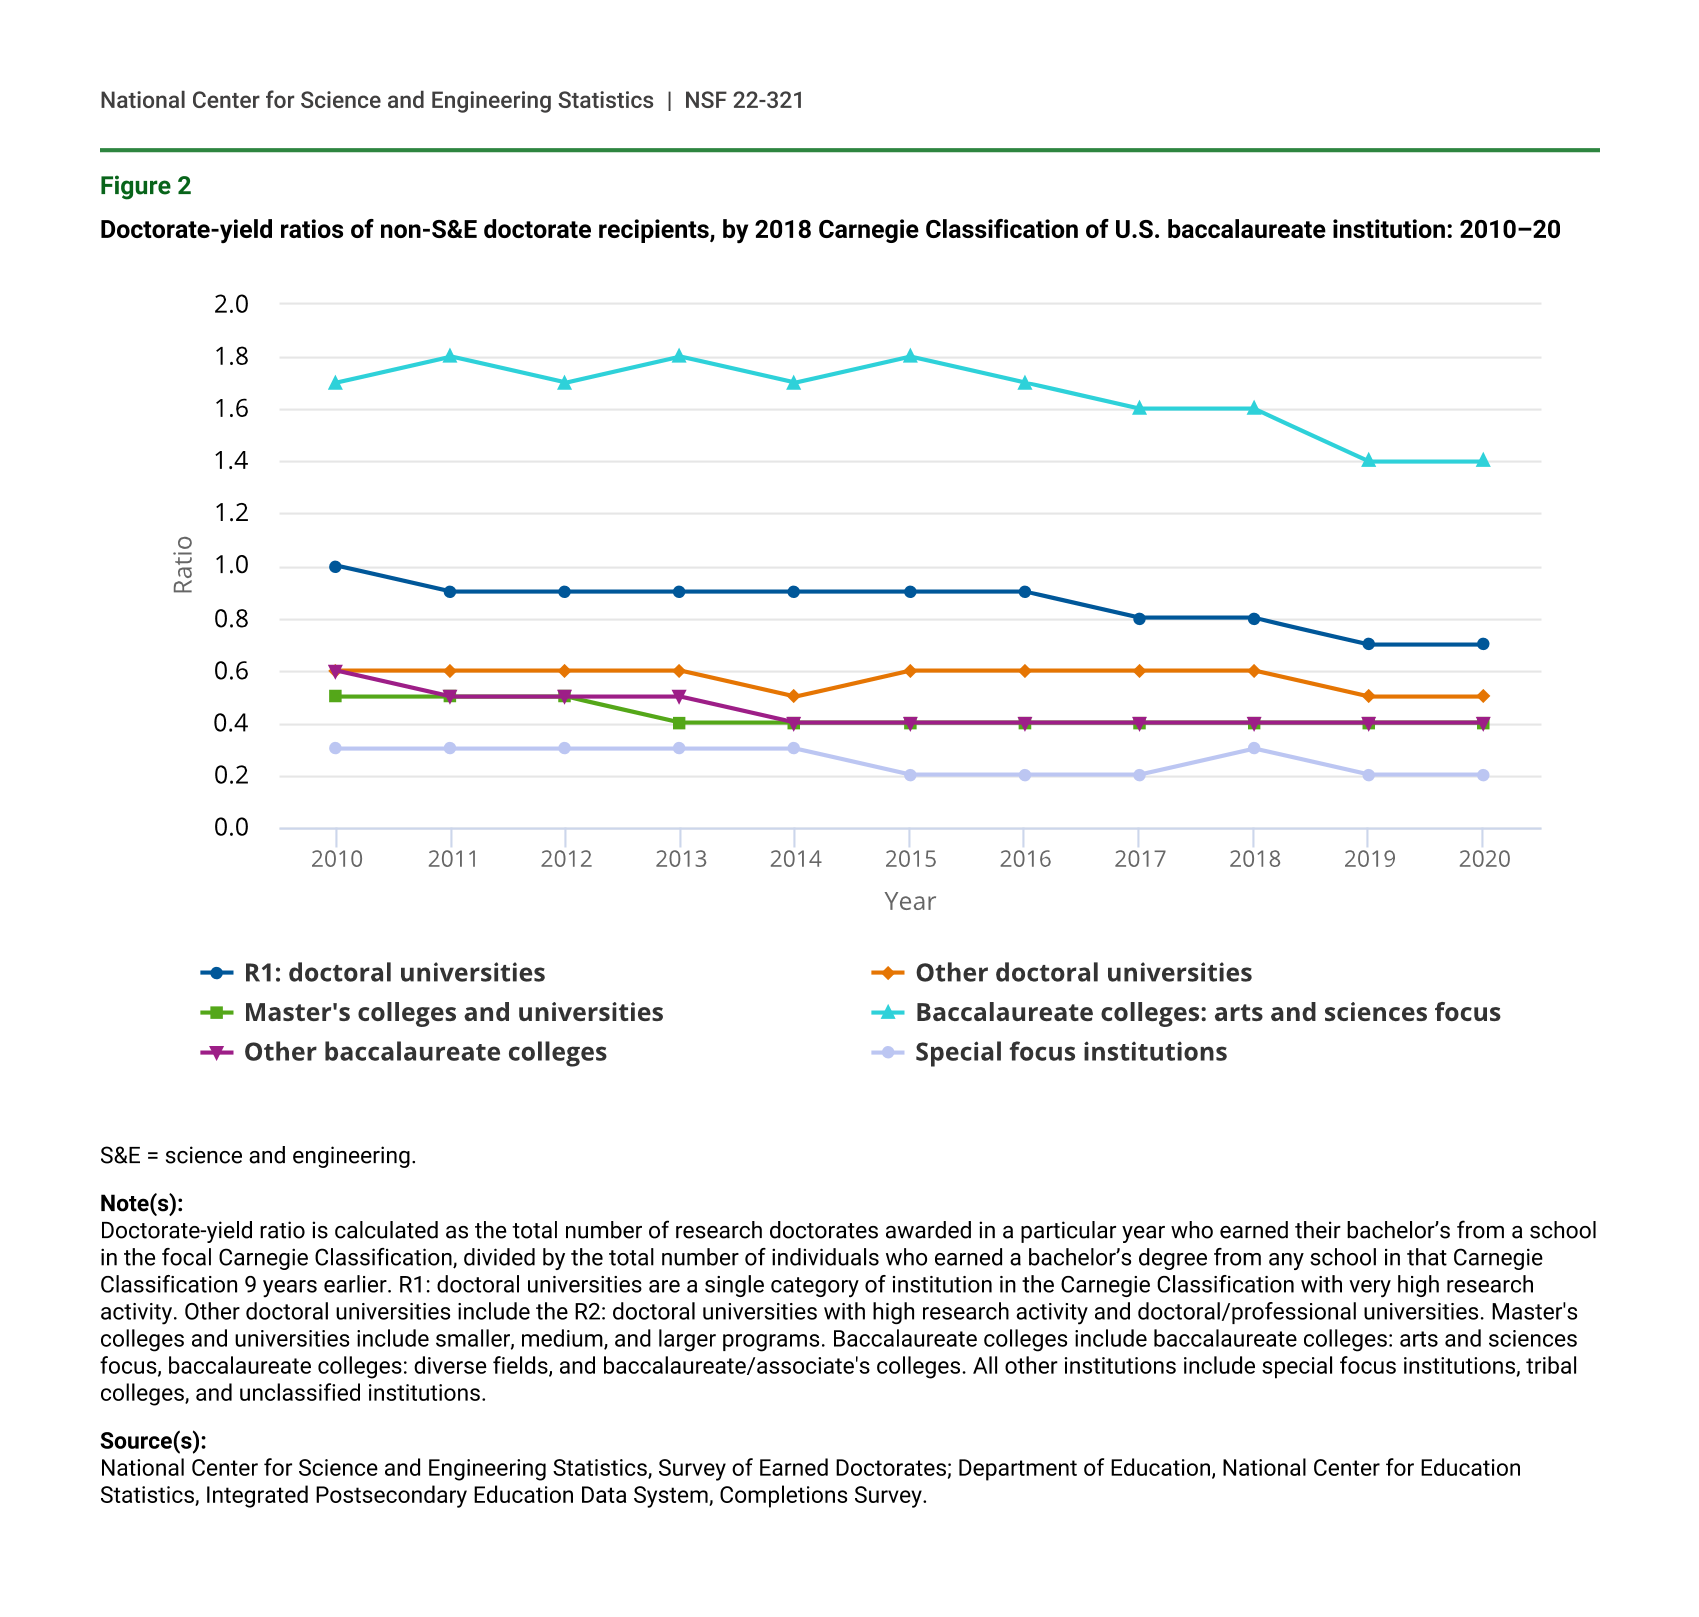
Figure 1 and figure 2 show the estimated doctorate-yield ratio (DYR) for baccalaureate-origin institutions by year and Carnegie Classification for S&E and non-S&E doctorate recipients, respectively. Like the IYR, the DYR is based on pooled data and is calculated as the total number of research doctorates awarded in a particular year who earned their bachelor’s from a school in the focal Carnegie Classification, divided by the total number of individuals who earned a bachelor’s degree from any school in that Carnegie Classification 9 years earlier.
These figures show that graduates of Carnegie-class baccalaureate colleges: arts and sciences focus more often earned a research doctorate in the decade following receipt of their bachelor’s degree than their peers who graduated from institutions in another type of Carnegie Classification group. On average for baccalaureate colleges: arts and sciences focus, 4 of every 100 graduates went on to earn a research doctorate in S&E and 2 of every 100 graduates went on to earn a research doctorate in non-S&E fields from a U.S. university in the decade after earning a bachelor’s degree.
These figures demonstrate a clear stratification on the type of institutions with baccalaureate colleges: arts and sciences focus yielding research doctorates at a higher rate than R1: doctoral universities across the 2010–20 time frame. The DYR for all Carnegie classes of institutions are generally stable across the decade, although slight declines can be seen for R1: doctoral universities, other Carnegie-class baccalaureate colleges, and special focus institutions over the past decade.
The DYR for non-S&E doctorate recipients are lower for all Carnegie class of institutions than for S&E doctorate recipients due to fewer people pursuing doctorates in these fields. Among non-S&E doctorate recipients, baccalaureate colleges: arts and sciences focus have the highest DYR, but there is a slight decline in the ratio among all of the Carnegie Classification groups over the past decade.
Doctorate-yield ratios of S&E doctorate recipients, by 2018 Carnegie Classification of U.S. baccalaureate institution: 2010–20
| Year | R1: doctoral universities | Other doctoral universities | Master's colleges and universities | Baccalaureate colleges: arts and sciences focus | Other baccalaureate colleges | Special focus institutions |
|---|---|---|---|---|---|---|
| 2010 | 2.7 | 1.1 | 0.7 | 3.5 | 0.8 | 0.4 |
| 2011 | 2.7 | 1.1 | 0.7 | 3.7 | 0.7 | 0.5 |
| 2012 | 2.6 | 1.1 | 0.7 | 3.8 | 0.7 | 0.5 |
| 2013 | 2.7 | 1.1 | 0.7 | 3.8 | 0.8 | 0.4 |
| 2014 | 2.6 | 1.2 | 0.7 | 3.7 | 0.7 | 0.5 |
| 2015 | 2.7 | 1.1 | 0.7 | 3.7 | 0.7 | 0.4 |
| 2016 | 2.7 | 1.2 | 0.7 | 3.9 | 0.7 | 0.4 |
| 2017 | 2.6 | 1.1 | 0.7 | 3.6 | 0.7 | 0.4 |
| 2018 | 2.6 | 1.2 | 0.7 | 3.8 | 0.6 | 0.3 |
| 2019 | 2.6 | 1.1 | 0.7 | 3.8 | 0.6 | 0.4 |
| 2020 | 2.4 | 1.1 | 0.7 | 3.5 | 0.6 | 0.3 |
S&E = science and engineering.
Note(s):
Doctorate-yield ratio is calculated as the total number of research doctorates awarded in a particular year who earned their bachelor’s from a school in the focal Carnegie Classification, divided by the total number of individuals who earned a bachelor’s degree from any school in that Carnegie Classification 9 years earlier. R1: doctoral universities are a single category of institution in the Carnegie Classification with very high research activity. Other doctoral universities include the R2: doctoral universities with high research activity and doctoral/professional universities. Master's colleges and universities include smaller, medium, and larger programs. Baccalaureate colleges include baccalaureate colleges: arts and sciences focus, baccalaureate colleges: diverse fields, and baccalaureate/associate's colleges. All other institutions include special focus institutions, tribal colleges, and unclassified institutions.
Source(s):
National Center for Science and Engineering Statistics, Survey of Earned Doctorates; Department of Education, National Center for Education Statistics, Integrated Postsecondary Education Data System, Completions Survey.
Doctorate-yield ratios of non-S&E doctorate recipients, by 2018 Carnegie Classification of U.S. baccalaureate institution: 2010–20
| Year | R1: doctoral universities | Other doctoral universities | Master's colleges and universities | Baccalaureate colleges: arts and sciences focus | Other baccalaureate colleges | Special focus institutions |
|---|---|---|---|---|---|---|
| 2010 | 1.0 | 0.6 | 0.5 | 1.7 | 0.6 | 0.3 |
| 2011 | 0.9 | 0.6 | 0.5 | 1.8 | 0.5 | 0.3 |
| 2012 | 0.9 | 0.6 | 0.5 | 1.7 | 0.5 | 0.3 |
| 2013 | 0.9 | 0.6 | 0.4 | 1.8 | 0.5 | 0.3 |
| 2014 | 0.9 | 0.5 | 0.4 | 1.7 | 0.4 | 0.3 |
| 2015 | 0.9 | 0.6 | 0.4 | 1.8 | 0.4 | 0.2 |
| 2016 | 0.9 | 0.6 | 0.4 | 1.7 | 0.4 | 0.2 |
| 2017 | 0.8 | 0.6 | 0.4 | 1.6 | 0.4 | 0.2 |
| 2018 | 0.8 | 0.6 | 0.4 | 1.6 | 0.4 | 0.3 |
| 2019 | 0.7 | 0.5 | 0.4 | 1.4 | 0.4 | 0.2 |
| 2020 | 0.7 | 0.5 | 0.4 | 1.4 | 0.4 | 0.2 |
S&E = science and engineering.
Note(s):
Doctorate-yield ratio is calculated as the total number of research doctorates awarded in a particular year who earned their bachelor’s from a school in the focal Carnegie Classification, divided by the total number of individuals who earned a bachelor’s degree from any school in that Carnegie Classification 9 years earlier. R1: doctoral universities are a single category of institution in the Carnegie Classification with very high research activity. Other doctoral universities include the R2: doctoral universities with high research activity and doctoral/professional universities. Master's colleges and universities include smaller, medium, and larger programs. Baccalaureate colleges include baccalaureate colleges: arts and sciences focus, baccalaureate colleges: diverse fields, and baccalaureate/associate's colleges. All other institutions include special focus institutions, tribal colleges, and unclassified institutions.
Source(s):
National Center for Science and Engineering Statistics, Survey of Earned Doctorates; Department of Education, National Center for Education Statistics, Integrated Postsecondary Education Data System, Completions Survey.
Data Sources, Limitations, and Availability
The Survey of Earned Doctorates (SED) data are used to report the numbers of S&E and non-S&E research doctorate recipients between 2010 and 2020. Data from the Department of Education’s Integrated Postsecondary Education Data System (IPEDS) Completions Survey provide the numbers of bachelor's degrees awarded between 2001 and 2011 and were downloaded from the IPEDS Data Center. As seen in 2020 SED: Table 31, the median time from receipt of bachelor’s degree to doctorate for all doctorate recipients between 2010 and 2020 was approximately 9 years (9.3 in 2010 and 8.7 in 2020). Among broad fields in 2020, time to degree was the shortest in physical and earth sciences (7.0 years) and in engineering (7.5 years), and the longest in education (15.0 years).
The 2018 version of the Carnegie Basic Classification for the colleges and universities categorizes academic institutions on the basis of highest degree conferred, level of degree production, and research activity. Institutions that award at least 20 research or scholarship doctoral degrees per year are called doctorate universities and are distributed among three subgroups based on the level of research activity—R1: doctoral universities (very high research activity), R2: doctoral universities (high research activity), and doctoral/professional universities. In this InfoBrief, the latter two subgroups are combined into a single category called “Other doctoral universities.” Master’s colleges and universities are institutions that award at least 50 master’s degrees and fewer than 20 doctoral degrees per year. Baccalaureate colleges are non-tribal colleges that award fewer than 50 master’s degrees or 20 doctoral degrees per year and at which baccalaureate or higher degrees represent at least 50.0% of all degrees. See https://carnegieclassifications.iu.edu/classification_descriptions/basic.php for more information on Carnegie Basic Classification.
Notes
1Fiegener MK, Proudfoot SL; National Center for Science and Engineering Statistics (NCSES). 2013. Baccalaureate Origins of U.S.-trained S&E Doctorate Recipients. InfoBrief NSF 13-323. Arlington, VA: National Center for Science and Engineering Statistics. Available at https://www.nsf.gov/statistics/infbrief/nsf13323/. Burrelli J, Rapoport A, Lehming R. 2008. Baccalaureate Origins of S&E; Doctorate Recipients. InfoBrief NSF 08-311. Arlington, VA: Division of Science Resources Statistics. Available at http:/www.nsf.gov/statistics/infbrief/nsf08311/.
2The proportion of U.S. research doctorates holding temporary visas increased from 28.4% in 2010 to 33.4% in 2020. For more information on doctorate recipients by field of study and citizenship status during this time frame, see 2020 SED: Table 18 (https://ncses.nsf.gov/pubs/nsf22300/data-tables).
3The denominator for the DYR is based on the completions data for all institutions in IPEDS in each Carnegie class. The numerator is the total number of research doctorates awarded in a particular year who earned their bachelor’s from a school in the focal Carnegie class. Other doctoral universities include the R2: doctoral universities. Other baccalaureate colleges include baccalaureate colleges: diverse fields and baccalaureate/associate’s colleges. Special focus institutions include all special focus institutions and tribal colleges.
Suggested Citation
Contact Us
NCSES
Directorate for Social, Behavioral and Economic Sciences
National Science Foundation
2415 Eisenhower Avenue, Suite W14200
Alexandria, VA 22314
Tel: (703) 292-8780
FIRS: (800) 877-8339
TDD: (800) 281-8749
E-mail: ncsesweb@nsf.gov