 An official website of the United States government
 Total of R&D and R&D Plant
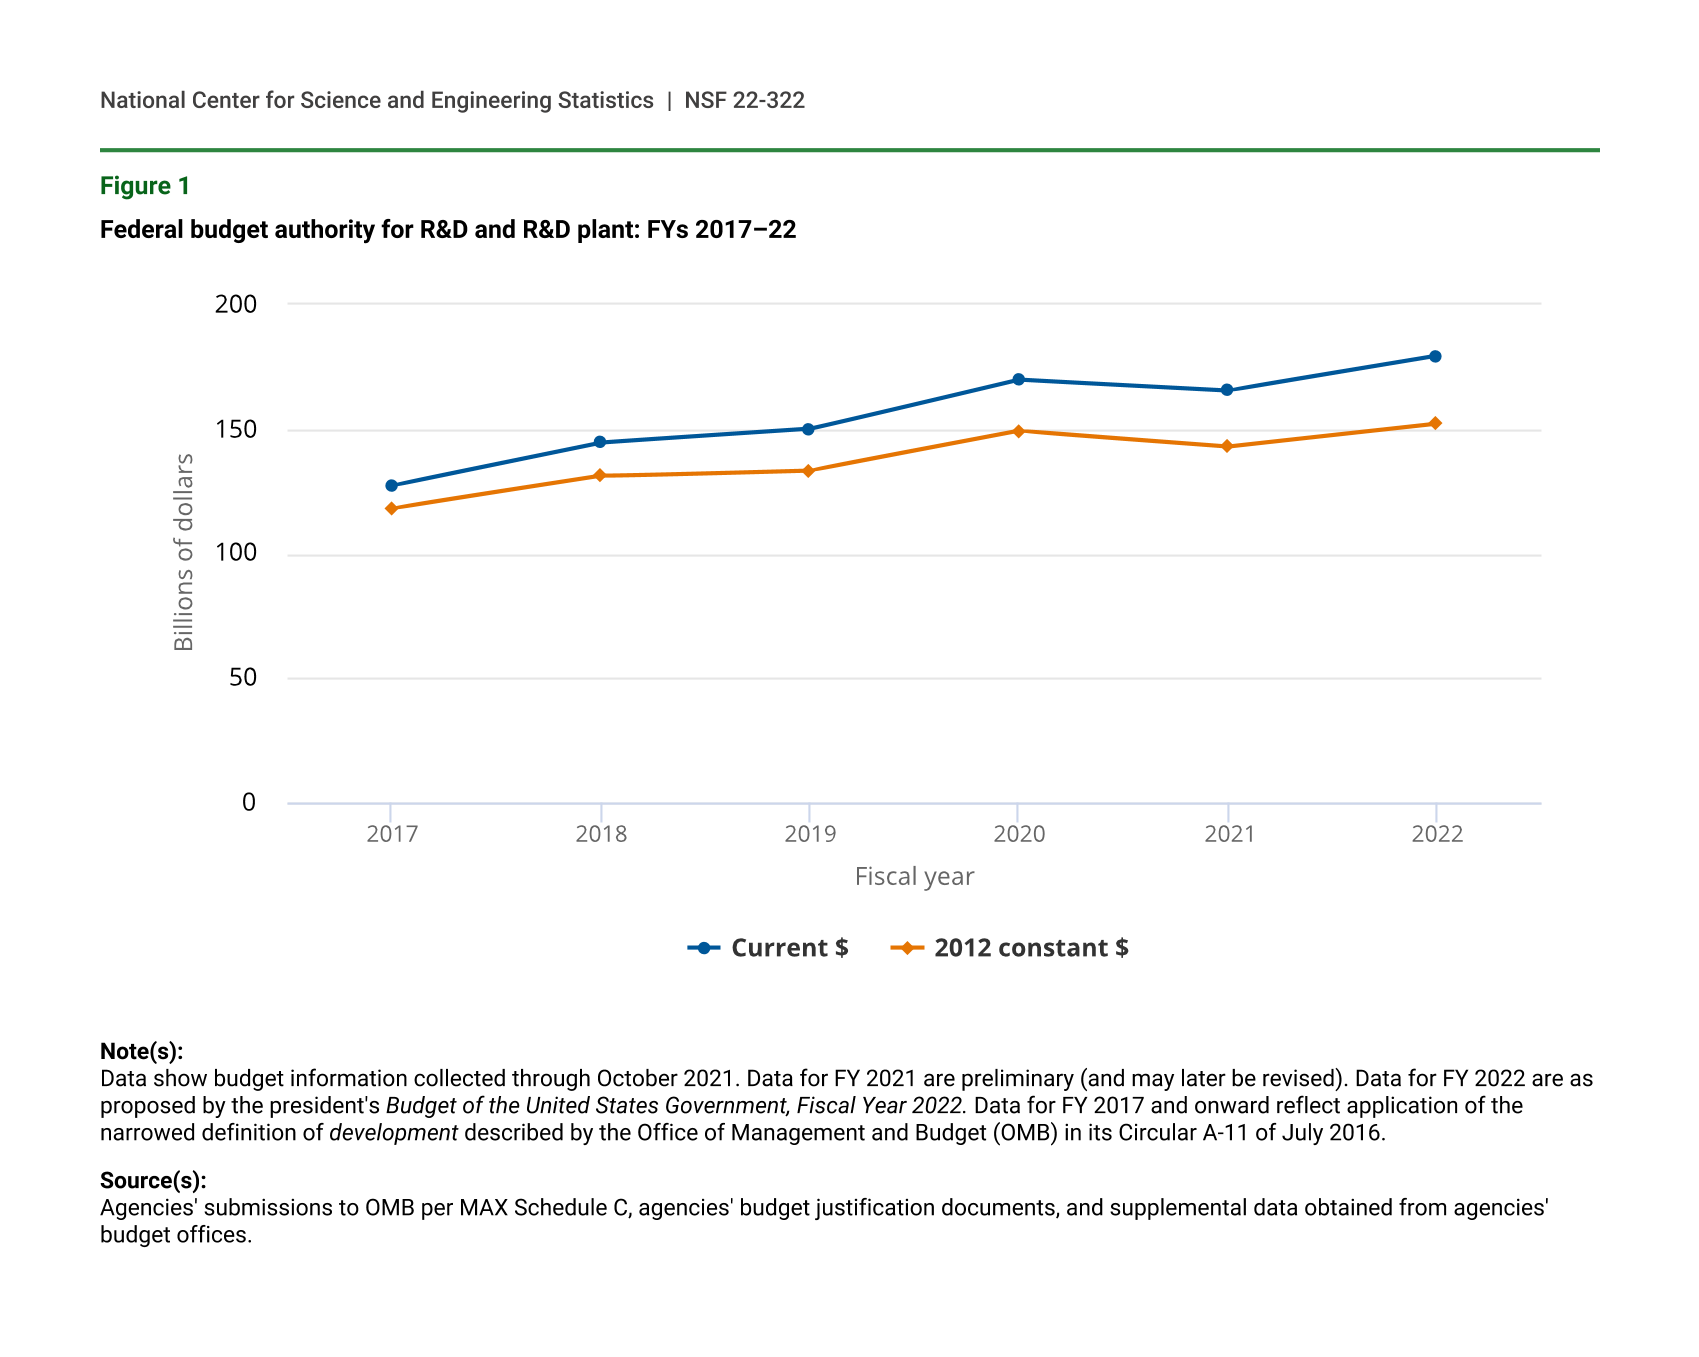
In FY 2017, the total of federal budget authority for both R&D and R&D plant stood at $127.3 billion (table 1). Four years later, in FY 2021, the total reached $165.6 billion (preliminary data). The broad trend prevailing over these several years—as apparent in figure 1, in both current dollar and inflation-adjusted terms—has been sizable annual increases for most of the period. The FY 2019 total was a $5.5 billion increase over the FY 2018 total, and FY 2020 was up $19.9 billion over FY 2019. The FY 2021 total does presently appear to be a drop of $4.3 billion over the prior year—but these are preliminary numbers, and the total (in both current and inflation adjusted terms) is, nonetheless, considerably above the FY 2017 total. The average annual increase over FYs 2017–21 has been 6.8%—or 4.9% adjusted for inflation. As proposed, the FY 2022 funding level would be a $13.9 billion increase (8.4%) over the previous year (table 1).
Federal budget authority for R&D and R&D plant: FYs 2017–22
| Fiscal year | Current $ | 2012 constant $ |
|---|---|---|
| 2017 | 127.31 | 118.13 |
| 2018 | 144.46 | 131.02 |
| 2019 | 149.97 | 133.38 |
| 2020 | 169.90 | 149.23 |
| 2021 | 165.56 | 143.00 |
| 2022 | 179.42 | 152.17 |
Note(s):
Data show budget information collected through October 2021. Data for FY 2021 are preliminary (and may later be revised). Data for FY 2022 are as proposed by the president's Budget of the United States Government, Fiscal Year 2022. Data for FY 2017 and onward reflect application of the narrowed definition of development described by the Office of Management and Budget (OMB) in its Circular A-11 of July 2016.
Source(s):
Agencies' submissions to OMB per MAX Schedule C, agencies' budget justification documents, and supplemental data obtained from agencies' budget offices.
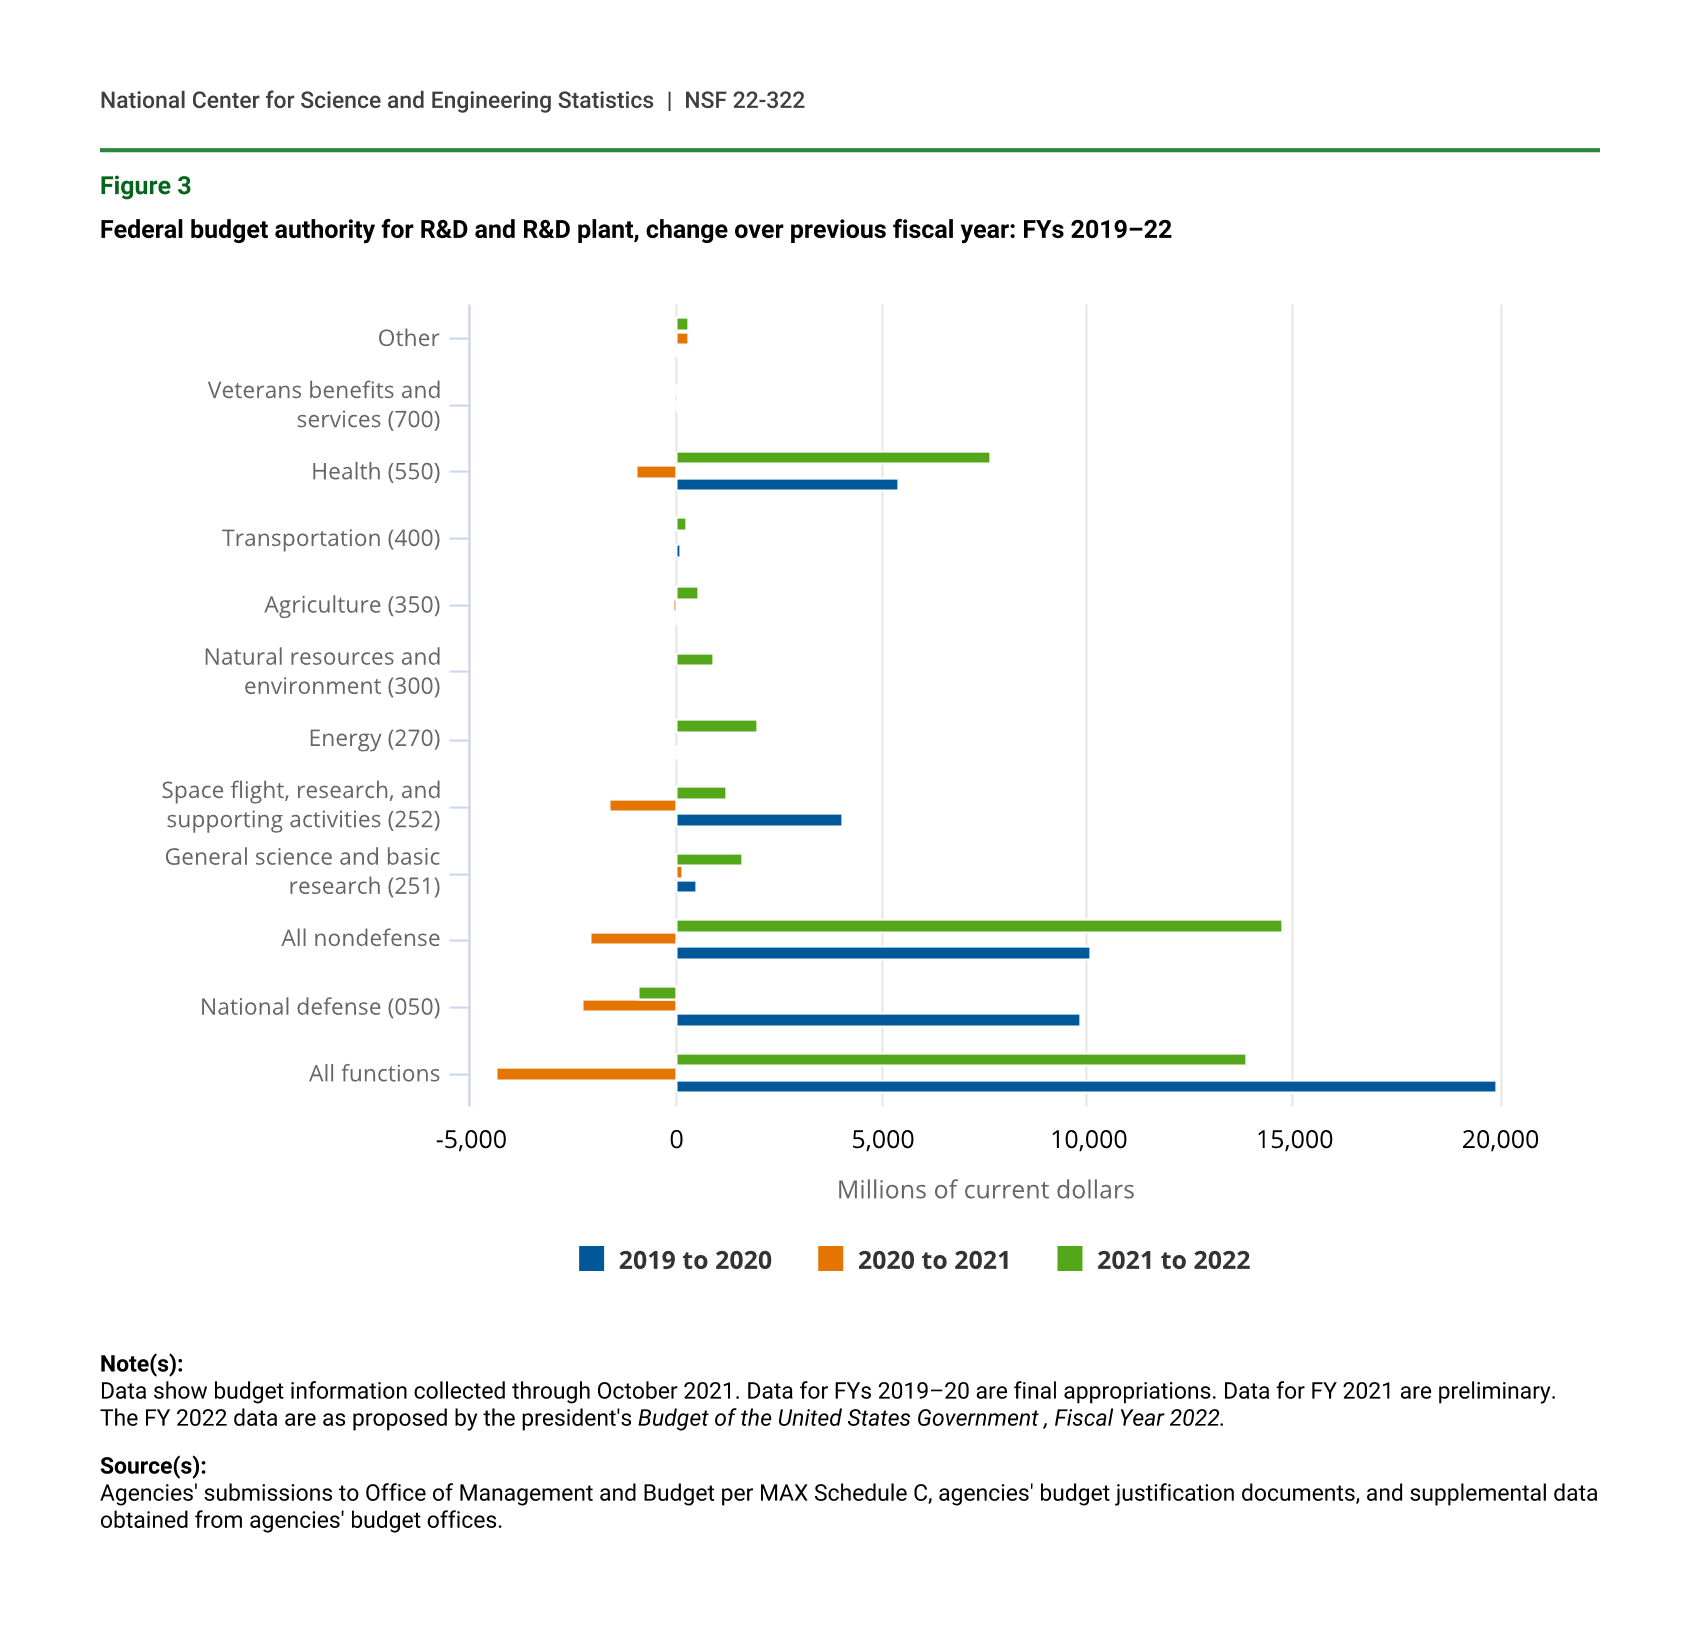
The main contributors to these year-over-year changes in the total have been large, multi-billion dollar increases in the National defense and Health budget functions, as well as Space flight research in FY 2020. Another relevant trend occurring over these fiscal years has been that, generally, the funding levels for R&D in federal government budgets as proposed by the administration were often significantly increased by Congress in its subsequent debate and finalization of the annual spending legislation. For FY 2018, the president’s proposed R&D plus R&D plant funding level was $117.8 billion, but Congress enacted $144.5 billion; for FY 2019, the proposed level was $123.8 billion, but the eventual spending legislation called for was $150.0 billion; for FY 2020, $142.4 billion was proposed, but $164.8 billion was enacted; and for FY 2021, $150.9 billion was proposed, but $165.6 billion (preliminary) was enacted.
R&D plant is typically a small portion of the R&D and R&D plant total but is nonetheless an essential input for R&D activity. In FY 2017, the $2.6 billion of budget authority classified as R&D plant amounted to 2.0% of the R&D and R&D plant total (table 2). The yearly R&D plant amounts over the remainder of the FYs 2017–21 period were in the range of $4 billion to $6 billion. The amount proposed for FY 2022 is $4.6 billion.
Over the FYs 2017–21 period, the most sizable budget authority amounts for R&D plant arise in the General science and basic research function (near or above $2 billion, annually) and to a lesser degree, but still relatively large (from $600 million to nearly $1 billion annually) in the National defense category (table 2). The amount for the National defense category in FY 2020 ($2.5 billion) is exceptionally large by comparison to amounts from other years in the time period. R&D plant funding in the General science and basic research function mainly reflect investment in new or upgraded facilities and large-scale equipment for basic research in various fields—by agencies such as the Department of Energy’s (DOE’s) Office of Science and NSF.
Federal budget authority for R&D and R&D plant, by funding category: FYs 2017–22
a Other functions include International affairs (150); Commerce and housing credit (300); Community and regional development (450); Education, training, employment, and social services (500); Medicare (570); Income security (600); Administration of justice (750); and General government (800). Most all of the dollar amounts for these budget functions are well below $1 billion annually.
b The data for 2017 and onward reflect application of the narrowed definition of development described by the Office of Management and Budget (OMB) in its Circular A-11 of July 2016.
Note(s):
Data show budget information collected through October 2021.
Source(s):
Agencies' submissions to OMB per MAX Schedule C, agencies' budget justification documents, and supplemental data obtained from agencies' budget offices.
Relative Roles of Defense and Nondefense Budget Functions
National defense is annually the largest single budget function in the total of R&D and R&D plant funding (table 1 and table 3). The remainder of the budget authority total falls among 15 (or on occasion 16) nondefense functional categories—of which Health is the largest (but with substantially fewer dollars annually than National defense).
Distribution of federal budget authority for R&D and R&D plant budget, by budget function: FYs 2017–22
* = less than 0.05%.
a The rankings in this table are based on the budget authority totals for FY 2020 by budget function category.
b The data for 2017 and onward reflect application of the narrowed definition of development described by the Office of Management and Budget (OMB) in its Circular A-11 of July 2016.
Note(s):
Detail may not add to total because of rounding. Data show budget information collected through October 2021
Source(s):
Agencies' submissions to OMB per MAX Schedule C, agencies' budget justification documents, and supplemental data obtained from agencies' budget offices.
Since FY 2017, the National defense share has, for the most part, increased gradually, from 45.2% in FY 2017 to 48.1% in FY 2021 (table 3 and figure 2). Concomitantly, the nondefense subtotal declined over the same period, from 54.8% in FY 2017 to 51.9% in FY 2021 (figure 2).
As proposed for FY 2022, the National defense share would drop significantly, from 48.1% in FY 2021 to 43.9% in FY 2022 . The nondefense subtotal would rise from 51.9% in FY 2021 to 56.1% in FY 2022. The most sizable changes in the shares of the nondefense budget functions as proposed are the Health budget function moving higher by more than 2 percentage points and the Energy budget function moving up by nearly 1 percentage point.
Federal budget authority for R&D and R&D plant, defense and nondefense: FYs 2017–22
| Fiscal year | Total | Defense | Nondefense |
|---|---|---|---|
| 2017 | 118.13 | 53.38 | 64.75 |
| 2018 | 131.02 | 62.50 | 68.51 |
| 2019 | 133.38 | 64.06 | 69.32 |
| 2020 | 149.23 | 71.91 | 77.32 |
| 2021 | 143.00 | 68.74 | 74.26 |
| 2022 | 152.17 | 66.75 | 85.42 |
Note(s):
Data show budget information collected through October 2021. Data for FY 2021 are preliminary (and may later be revised). Data for FY 2022 are as proposed by the president's Budget of the United States Government, Fiscal Year 2022. Data for FY 2017 and onward reflect application of the narrowed definition of development described by the Office of Management and Budget (OMB) in its Circular A-11 of July 2016.
Source(s):
Agencies' submissions to OMB per MAX Schedule C, agencies' budget justification documents, and supplemental data obtained from agencies' budget offices.
Federal Funding Trends Across the Largest Budget Functions: FYs 2019–22
National Defense
Budget authority for R&D and R&D plant directed at National defense in FY 2020 totaled $81.87 billion, a 13.7% increase over the FY 2019 level of $72.03 billion (table 1, figure 3). The FY 2021 level (preliminary data) of $79.58 billion is a decline of 2.8% over the previous year. The president’s proposed level for FY 2022 is a modest further decline (-1.1%) to $78.70 billion. This category’s share of the federal R&D and R&D plant total was 48.0% in FY 2019, 48.2% in FY 2020, and 48.1% in FY 2021 (table 3).
Most of the R&D dollars in the National defense category arise in the military research, development, test, and evaluation (RDT&E) programs at the Department of Defense (DOD). RDT&E encompasses a broad spectrum of activities ranging from basic research to operational system development. DOD funding for R&D is a subset of the full spectrum of these RDT&E activities. In FY 2020, total budget authority for RDT&E amounted to $104.96 billion, with R&D given $68.68 billion of the RDT&E total. In FY 2021, RDT&E budget authority totaled $106.45 billion, with R&D totaling $68.19 billion.
R&D on atomic energy defense in DOE is a smaller but still sizable component of the defense category ($7.75 billion in FY 2020, $7.91 billion in FY 2021). The two largest elements were weapons activities ($5.95 billion in FY 2020, $5.92 billion in FY 2021) and development of naval reactors ($1.37 billion in FY 2020, $1.47 billion in FY 2021).
Federal budget authority for R&D and R&D plant, change over previous fiscal year: FYs 2019–22
| Categories | 2019 to 2020 | 2020 to 2021 | 2021 to 2022 |
|---|---|---|---|
| All functions | 19,930 | -4,341 | 13,858 |
| National defense (050) | 9,847 | -2,290 | -880 |
| All nondefense | 10,083 | -2,051 | 14,738 |
| General science and basic research (251) | 494 | 141 | 1,645 |
| Space flight, research, and supporting activities (252) | 4,073 | -1,612 | 1,248 |
| Energy (270) | 66 | -2 | 1,996 |
| Natural resources and environment (300) | 34 | 20 | 931 |
| Agriculture (350) | 45 | -19 | 590 |
| Transportation (400) | 91 | -8 | 285 |
| Health (550) | 5,433 | -960 | 7,667 |
| Veterans benefits and services (700) | 4 | 54 | 78 |
| Other | 59 | 335 | 298 |
Note(s):
Data show budget information collected through October 2021. Data for FYs 2019–20 are final appropriations. Data for FY 2021 are preliminary. The FY 2022 data are as proposed by the president's Budget of the United States Government , Fiscal Year 2022.
Source(s):
Agencies' submissions to Office of Management and Budget per MAX Schedule C, agencies' budget justification documents, and supplemental data obtained from agencies' budget offices.
Health
Budget authority for R&D and R&D plant in this functional category was $44.43 billion in FY 2020, a 13.9% increase over the $39.00 billion total in 2019. The estimated FY 2021 level, however, is a 2.2% decrease to $43.47 billion. The proposed level for FY 2022 is a 17.6% increase to $51.14 billion. This category’s share of the R&D and R&D plant total was 26.0% in FY 2019, 26.2% in FY 2020, and 26.3% in FY 2021.
The National Institutes of Health (NIH) is the predominant recipient in this category: $43.12 billion in FY 2020 and an estimated $41.96 billion in FY 2021. This NIH funding is spread across multiple disease categories, with its National Cancer Institute and National Institutes of Allergy and Infectious Diseases receiving the largest shares of the total. The Health category also includes the R&D programs of several other Health and Human Services (HHS) agencies (Food and Drug Administration, Agency for Healthcare Research and Quality, Centers for Disease Control and Prevention [CDC]) and the Consumer Product Safety Commission.
Space Flight, Research, and Supporting Activities
Budget authority for R&D and R&D plant in this functional category was $14.21 billion in FY 2020, a 40.2% increase over the $10.13 billion total in FY 2019. The estimated FY 2021 level, however, is a large drop (-11.3%) to $12.59 billion. The proposed level for FY 2022 is a 9.9% increase to $13.84 billion. This category’s share of the R&D and R&D plant total was 6.8% in FY 2019, 8.4% in FY 2020, and 7.6% in FY 2021 (table 1 and table 3). The National Aeronautics and Space Administration (NASA) programs account for the entirety of these amounts.
General Science and Basic Research
Budget authority for R&D and R&D plant in this functional category was $13.66 billion in FY 2020, a 3.8% increase over the $13.17 billion total in 2019. The estimated FY 2021 level, however, is a smaller 1.0% increase to $13.80 billion. The proposed level for FY 2022 is a far larger increase of 11.9% to $15.45 billion. This category’s share of the R&D and R&D plant total was 8.8% in FY 2019, 8.0% in FY 2020, and 8.3% in FY 2021 (table 1 and table 3).
This category includes mainly the R&D programs of the NSF and the DOE’s Office of Science. NSF programs accounted for $6.74 billion in FY 2020 and an estimated $6.88 billion in FY 2021—that is, nearly half of the category’s budget authority total throughout. DOE’s Office of Science was allotted $6.92 billion in FY 2020 and $6.92 billion in FY 2021.
Energy
Budget authority for R&D and R&D plant in this functional category was $4.54 billion in FY 2020, a 1.5% increase over the $4.47 billion total in FY 2019. The estimated FY 2021 level of $4.54 billion is a negligible decline. The proposed level for FY 2022 is a large increase (44.0%) to $6.53 billion. This category’s share of the R&D and R&D plant total was 3.0% in FY 2019, 2.7% in FY 2020, and 2.7% in FY 2021 (table 1 and table 3).
DOE’s various energy programs (particularly Energy Efficiency and Renewable Energy, Fossil Energy, Nuclear Energy) and the Advanced Research Projects Agency–Energy account for the vast majority of this category total across all these budget years. This category also includes small R&D funding levels for the Nuclear Regulatory Commission and the Tennessee Valley Authority.
Natural Resources and Environment
Budget authority for R&D and R&D plant in this category was $2.88 billion in FY 2020, a 1.2% increase over the $2.85 billion total in FY 2019. The estimated FY 2021 level of $2.90 billion is an also small increase of 0.7%. The proposed level for FY 2022 is a large increase (32.1%) to $3.83 billion. This category’s share of the R&D and R&D plant total was 1.9% in FY 2019, 1.7% in FY 2020, and 1.8% in FY 2021 (table 1 and table 3).
This functional category includes R&D across a range of purposes: conservation and land management, pollution control and abatement, recreational resources, water resources, and other natural resources. The majority of the funding is associated with R&D programs in the Department of Commerce (chiefly, the National Oceanic and Atmospheric Administration [NOAA]); the Environmental Protection Agency (EPA); the Department of the Interior (mainly, the U.S. Geological Survey, but also the Bureau of Reclamation and National Park Service); and the U.S. Department of Agriculture (USDA) (notably, the Forest Service). The category total also includes R&D activities in the Army Corps of Engineers and the U.S. Coast Guard within the Department of Homeland Security.
Agriculture
Budget authority for R&D and R&D plant in this category was $2.67 billion in FY 2020, a 1.7% decline over a slightly higher $2.72 billion total in FY 2019. The estimated FY 2021 level of $2.66 billion is a further decline of 0.7%. However, the proposed level for FY 2022 is a large increase (22.2%) to $3.25 billion. This category’s share of the R&D and R&D plant total was 1.8% in FY 2019, 1.6% in FY 2020, and 1.6% in FY 2021 (table 1 and table 3).
This category is composed entirely of USDA R&D programs—in particular, the R&D conducted by the Agricultural Research Service and the National Institute of Food and Agriculture.
Federal R&D Funding and the COVID-19 Pandemic
There is widespread interest in information on the extent to which federal funding has been increased or redirected in support of R&D relevant to public health issues posed by the COVID-19 pandemic emerging in the United States and globally in early 2020. Some information on this topic is documented in the statistics collected for FYs 2020–21 in this present edition of the Federal R&D Funding by Budget Function series and is briefly summarized below. Nevertheless, the story provided is incomplete in many respects. The scientific advances from past federal funding of R&D addressing the biology of coronaviruses and the development of the technologies enabling the rapid development and clinical testing of the innovative m-RNA vaccines have been important factors in the nation’s responses to the challenges of pandemic in 2020, 2021, and ongoing.
Congress took a number of legislative steps from March 2020 through March 2021 to provide added appropriations in response to the COVID-19 pandemic, some of which provided increased funding for related R&D.
The largest amounts of federal funding appear to reside in the Health function category and in key HHS agencies. The NIH received $4.7 billion of funding across FYs 2020–21 for “emergency COVID-19 R&D”—amounts that are included in the budget authority totals of this report. The department’s Biomedical Advanced Research and Development Authority and CDC received substantially larger budget authorities for “emergency COVID-19 response” in FY 2020 and FY 2021 ($25 billion and $28 billion, respectively). But it is presently unclear what portions of these amounts have been directed specifically at R&D (in contrast to other public health activities).
Under the Veterans benefits and services heading, the Department of Veterans Affairs received $9 million for R&D in FY 2021 (an amount reflected in the budget category and overall totals described in this report).
In the National defense category, DOD received $415 million for “COVID-19 related RDT&E in FY 2020”—an amount included in this report’s budget authority total. In the General science and basic research category, NSF received $75 million for “COVID-19 R&D” in FY 2020. It also received $600 million in “emergency spending for COVID-19 response” in FY 2021, but the extent to which this amount is specifically R&D is presently unclear.
In the Space flight, research, and supporting activities category, NASA received $100 million in FY 2020 for “mission services and operational adjustments in response to COVID-19.” But it is presently unclear what portion of that amount may have been directed to R&D.
And in the Natural resources and environment category, NOAA, Forest Service, and EPA received, respectively, $20 million, $3 million, and $2 million for “emergency COVID-19 response” in FY 2020. The shares of these agencies’ COVID-19–related funding levels directed specifically toward R&D are presently unclear.
Definitions
Budget authority is the primary source of legal authorization for a federal agency to enter into obligations that will result in outlays.
Budget functions are categories defined by the Office of Management and Budget (OMB) into which all activities funded by the federal budget are classified.
R&D refers to basic research, applied research, and experimental development in the sciences and engineering.
R&D plant includes facilities and major equipment necessary for the execution of an R&D program. It includes the purchase, construction, manufacture, rehabilitation, or major improvement of physical assets such as land, major fixed equipment, and supporting infrastructure like a sewer line or housing at a remote location. It also includes the acquisition, design, or production of major movable equipment, such as mass spectrometers, research vessels, DNA sequencers, and other movable major instruments for use in R&D activities.
Data Sources and Availability
The statistics described in this InfoBrief account for nearly all federally sponsored R&D activities and are based mainly on the budget information that federal agencies provide to OMB for the federal budget-making process. The data are compiled for NSF by the American Association for the Advancement of Science (R&D Budget and Policy Project, under NCSES contract with SRI International), from federal budget information collected and analyzed through October 2021.
The data for FY 2020 mainly reflect the final appropriations levels, although it is presently unclear if all R&D funding increases arising from supplementary budget legislation in calendar year 2020 in response to the COVID-19 pandemic have yet been fully incorporated into the agency reported totals. The statistics for FY 2021 draw on the federal budget as enacted by the Consolidated Appropriations Act, 2021 (H.R. 133, 27 December 2020) and on agencies subsequent estimates of their spending plans—accordingly, these budget numbers are marked “preliminary.” Again, it is unclear at this time if increased funding appropriated in either FY 2020 or FY 2021 to support COVID-19 related R&D have been fully included in the agency totals. The data for FY 2022 draw mainly from the president’s proposed budget for the U.S. government in FY 2022 (publicly released 28 May 2021), but also include subsequent information from the executive branch and agency budget offices. As a result, the budget numbers for individual activities, programs, or agencies may differ from those published in the president’s proposed budget or agency budget documents.
Currently, there are 20 broad budget function categories and most have a number of identified subfunctions. (For a list, see table 5-1 in the Historical Tables section of the president’s Budget of the United States Government, Fiscal Year 2022, available at https://www.whitehouse.gov/omb/historical-tables /.) In this report, R&D funding is present in 16 functional categories: 14 at the broad functional category level and 2 at subcategory levels. These 2 subcategories are salient in that OMB’s broad category of General science, space, and technology (250) and includes a pair of subfunctions: General science and basic research (251) and Space flight, research, and supporting activities (252). Given the differences across these two R&D endeavors and the significant public interest in each, these subfunctions are treated separately in this InfoBrief. For a further discussion of the recognition of R&D in these budget functions, see OMB’s guidance in Circular A-11, Section 84. Character Classification (Schedule C), available at https://www.whitehouse.gov/wp-content/uploads/2018/06/s84.pdf.
A fuller set of statistical tables on federal budget authority for R&D in FY 2020 and FY 2021 and the president’s proposed levels for FY 2022, with agency and program details, are available in a companion statistical report: Federal R&D Funding, by Budget Function: Fiscal Years 2020–22, accessible at https://ncses.nsf.gov/pubs/nsf22316/.
For more information, contact the author.
Notes
1Previous editions of this Federal R&D Funding by Budget Function report series provide data by fiscal year on past administration proposals for federal government R&D funding compared to the budget authority subsequently enacted by Congress. These reports are accessible on the NCSES website at https://www.nsf.gov/statistics/fedbudget/.
2Data and facts mentioned, but not evident in this InfoBrief’s tables and figures, come from a companion statistical report cited in this InfoBrief’s Data Sources and Availability section (https://ncses.nsf.gov/pubs/nsf22316/).
3DOD’s regulations for financial management specify a number of budget activity categories that in turn reflect differing types of RDT&E efforts: Budget activity (BA)-1: Basic Research; BA-2: Applied Research; BA-3: Advanced Technology Development; BA-4: Advanced Component Development and Prototypes; BA-5: Systems Development and Demonstration; BA-6: RDT&E Management Support; BA-7: Operational System Development; and, quite recently, BA-8: Software and Digital Technology Pilot Programs. The most comprehensive DOD data in this report do not include funds in this newly identified BA-8 category.
4In recognition of the Office of Management and Budget’s implementation of a narrowed definition of “development” described in its Circular A-11 (Section 84) of July 2016, the R&D data cited in this statistical series for DOD, starting with FY 2017, exclude funding classified as BA-7 from the RDT&E total. Previously, DOD R&D was construed to include the total of RDT&E.
5Despite the General science and basic research title, not all basic research funded by the federal government is classified in this single category. Federal funding for basic research arises in other functional categories—such as National defense or Health—and is included in the category funding totals there.
6This section draws principally from the explanatory bottom notes in the detailed statistical tables for the six mentioned budget function categories of this InfoBrief’s aforementioned companion report.
7Included here are the Coronavirus Preparedness and Response Supplemental Appropriations Act, 2020 (H.R. 6074, 6 March 2020); the Families First Coronavirus Response Act (H.R. 6201, 18 March 2020); the Coronavirus Aid, Relief, and Economic Security Act (H.R. 748, 27 March 2020); and the Paycheck Protection Program and Health Care Enhancement Act (H.R. 266, 24 April 2020). Additional funding for COVID-19–related R&D were also provided by the Consolidated Appropriations Act, 2021 (H.R. 133, 27 December 2021) and by the American Rescue Plan Act of 2021 (H.R. 1319, 11 March 2021).
Suggested Citation
Contact Us
NCSES
National Center for Science and Engineering Statistics
Directorate for Social, Behavioral and Economic Sciences
National Science Foundation
2415 Eisenhower Avenue, Suite W14200
Alexandria, VA 22314
Tel: (703) 292-8780
FIRS: (800) 877-8339
TDD: (800) 281-8749
E-mail: ncsesweb@nsf.gov