 An official website of the United States government
 Driven by Stimulus Funding, Federal R&D Obligations Increased 18% in 2020; Largest Year-to-Year Change since 1963
FY 2020 federal obligations for research and experimental development (R&D) totaled $167.4 billion, an increase of nearly 18% from FY 2019 obligations of $142.4 billion (figure 1). FY 2021 R&D obligations are estimated to increase an additional 7% to $179.5 billion. When adjusted for inflation, the FY 2020 amount of $147.0 billion is slightly below the 2009 adjusted total of $147.9 billion, when many agencies received additional funds through the American Recovery and Reinvestment Act (ARRA). Just as federal obligations for R&D were buoyed by the addition of ARRA funds in FYs 2009 and 2010, so too has additional stimulus funding contributed to increases in FYs 2020 and 2021 federal R&D obligations.
With a nearly 18% year-to-year change in federal R&D obligations, FY 2020 saw the largest increase since 1963 when federal R&D obligations rose 21.4% and was driven by major increases (97.0% between 1962 and 1963) in R&D obligations from the National Aeronautics and Space Administration (NASA) to support its burgeoning space program (figure 1). In FY 2020, the Department of Health and Human Services (HHS) accounted for most of the $25.0 billion increase in R&D from FY 2019, and these increases were mostly for COVID-19 R&D support under Operation Warp Speed (OWS) (table 1). Specifically, the Biomedical Advanced Research and Development Authority (BARDA) within HHS saw increased obligations from $736.0 million in FY 2019 to $15.7 billion in FY 2020. Alone, BARDA accounts for 63% of the $25.0 billion increase in total federal R&D between FY 2019 and FY 2020 while the Department of Defense (DOD) accounts for 32% of the overall increase. This InfoBrief will provide details on the impact these and other agencies have had on the increase in federal R&D obligations in FY 2020.
Data are from the latest edition of the Survey of Federal Funds for Research and Development (or Federal Funds Survey), sponsored by the National Center for Science and Engineering Statistics (NCSES) within the National Science Foundation (NSF). Data for FY 2020 are actual amounts; FY 2021 data are preliminary and subject to revision.
Federal R&D obligations: FYs 1951–2021
| Fiscal year | Total R&D current dollars | Total R&D 2012 constant dollars |
|---|---|---|
| 1951 | 1,522 | 11,163 |
| 1952 | 1,910 | 13,467 |
| 1953 | 1,920 | 13,293 |
| 1954 | 1,762 | 12,059 |
| 1955 | 2,045 | 13,890 |
| 1956 | 2,988 | 19,789 |
| 1957 | 3,932 | 25,109 |
| 1958 | 4,570 | 28,331 |
| 1959 | 6,694 | 40,864 |
| 1960 | 7,552 | 45,465 |
| 1961 | 9,059 | 53,824 |
| 1962 | 10,290 | 60,529 |
| 1963 | 12,495 | 72,643 |
| 1964 | 14,225 | 81,661 |
| 1965 | 14,614 | 82,473 |
| 1966 | 15,320 | 84,643 |
| 1967 | 16,529 | 88,628 |
| 1968 | 15,921 | 82,493 |
| 1969 | 15,641 | 77,507 |
| 1970 | 15,339 | 72,149 |
| 1971 | 15,543 | 69,573 |
| 1972 | 16,496 | 70,495 |
| 1973 | 16,800 | 68,797 |
| 1974 | 17,410 | 66,552 |
| 1975 | 19,039 | 65,970 |
| 1976 | 20,780 | 67,313 |
| 1977 | 23,450 | 70,847 |
| 1978 | 25,845 | 73,154 |
| 1979 | 28,145 | 73,717 |
| 1980 | 29,830 | 71,863 |
| 1981 | 33,104 | 72,612 |
| 1982 | 36,433 | 74,718 |
| 1983 | 38,712 | 76,069 |
| 1984 | 42,225 | 80,108 |
| 1985 | 48,360 | 88,782 |
| 1986 | 51,412 | 92,319 |
| 1987 | 55,254 | 97,038 |
| 1988 | 56,769 | 96,579 |
| 1989 | 61,406 | 100,403 |
| 1990 | 63,559 | 100,252 |
| 1991 | 61,295 | 93,352 |
| 1992 | 65,593 | 97,463 |
| 1993 | 67,314 | 97,727 |
| 1994 | 67,235 | 95,532 |
| 1995 | 68,187 | 94,862 |
| 1996 | 67,653 | 92,384 |
| 1997 | 69,827 | 93,689 |
| 1998 | 72,101 | 95,548 |
| 1999 | 75,341 | 98,575 |
| 2000 | 75,910 | 97,321 |
| 2001 | 84,493 | 105,827 |
| 2002 | 93,709 | 115,518 |
| 2003 | 103,528 | 125,336 |
| 2004 | 112,074 | 132,507 |
| 2005 | 118,848 | 136,357 |
| 2006 | 121,730 | 135,331 |
| 2007 | 127,263 | 137,730 |
| 2008 | 127,106 | 134,775 |
| 2009 | 141,090 | 147,893 |
| 2010 | 140,355 | 145,868 |
| 2011 | 135,533 | 138,101 |
| 2012 | 138,525 | 138,525 |
| 2013 | 125,720 | 123,449 |
| 2014 | 130,561 | 125,782 |
| 2015 | 128,753 | 122,669 |
| 2016 | 115,833 | 109,390 |
| 2017 | 118,975 | 110,397 |
| 2018 | 129,425 | 117,381 |
| 2019 | 142,424 | 126,667 |
| 2020 | 167,403 | 147,038 |
| 2021 | 179,465 | 155,005 |
| Fiscal year | Change in total annual R&D (%) |
|---|---|
| 1951 | NA |
| 1952 | 25.5 |
| 1953 | 0.5 |
| 1954 | -8.2 |
| 1955 | 16.0 |
| 1956 | 46.2 |
| 1957 | 31.6 |
| 1958 | 16.2 |
| 1959 | 46.5 |
| 1960 | 12.8 |
| 1961 | 20.0 |
| 1962 | 13.6 |
| 1963 | 21.4 |
| 1964 | 13.9 |
| 1965 | 2.7 |
| 1966 | 4.8 |
| 1967 | 7.9 |
| 1968 | -3.7 |
| 1969 | -1.8 |
| 1970 | -1.9 |
| 1971 | 1.3 |
| 1972 | 6.1 |
| 1973 | 1.8 |
| 1974 | 3.6 |
| 1975 | 9.4 |
| 1976 | 9.1 |
| 1977 | 12.9 |
| 1978 | 10.2 |
| 1979 | 8.9 |
| 1980 | 6.0 |
| 1981 | 11.0 |
| 1982 | 10.1 |
| 1983 | 6.3 |
| 1984 | 9.1 |
| 1985 | 14.5 |
| 1986 | 6.3 |
| 1987 | 7.5 |
| 1988 | 2.7 |
| 1989 | 8.2 |
| 1990 | 3.5 |
| 1991 | -3.6 |
| 1992 | 7.0 |
| 1993 | 2.6 |
| 1994 | -0.1 |
| 1995 | 1.4 |
| 1996 | -0.8 |
| 1997 | 3.2 |
| 1998 | 3.3 |
| 1999 | 4.5 |
| 2000 | 0.8 |
| 2001 | 11.3 |
| 2002 | 10.9 |
| 2003 | 10.5 |
| 2004 | 8.3 |
| 2005 | 6.0 |
| 2006 | 2.4 |
| 2007 | 4.5 |
| 2008 | -0.1 |
| 2009 | 11.0 |
| 2010 | -0.5 |
| 2011 | -3.4 |
| 2012 | 2.2 |
| 2013 | -9.2 |
| 2014 | 3.9 |
| 2015 | -1.4 |
| 2016 | -10.0 |
| 2017 | 2.7 |
| 2018 | 8.8 |
| 2019 | 10.0 |
| 2020 | 17.5 |
| 2021 | 7.2 |
Note(s):
Because of rounding, details may not add to total. FYs 2009 and 2010 obligations include additional funding provided by the American Recovery and Reinvestment Act of 2009. Percent change data were not available for 1951, because data were not collected in 1950. Beginning with FY 2016, the totals reported for development obligations represent a refinement to this category by more narrowly defining it to be "experimental development." Most notably, totals for development do not include the Department of Defense (DOD) Budget Activity 7 (Operational Systems Development) obligations. Those funds, previously included in DOD's development obligation totals, support the development efforts to upgrade systems that have been fielded or have received approval for full-rate production and anticipate production funding in the current or subsequent fiscal year. Therefore, the data are not directly comparable with totals reported in previous years. FYs 2020 and 2021 obligations include additional funding provided by supplemental COVID-19–related appropriations (e.g., Coronavirus Aid, Relief, and Economic Security [CARES] Act). FY 2021 data are preliminary.
Source(s):
National Center for Science and Engineering Statistics, Survey of Federal Funds for Research and Development.
Summary of federal obligations for research and experimental development, by type of R&D and type of performer, for selected agencies: FYs 2019–21
na = not applicable.
BARDA = Biomedical Advanced Research and Development Authority; DOD = Department of Defense; DOE = Department of Energy; HHS = Department of Health and Human Services; NASA = National Aeronautics and Space Administration; ; NIH = National Institutes of Health; NSF = National Science Foundation.
a Intramural activities cover costs associated with the administration of intramural R&D programs and extramural R&D procurements by federal personnel as well as actual intramural performance.
b Extramural performers include business, federally funded research and development centers, universities and colleges, nonprofits, state and local governments, and foreign.
Note(s):
Because of rounding, details may not add to total. Percentages are computed using actual dollars reported. FYs 2020 and 2021 data include obligations from supplemental COVID-19–related appropriations (e.g., Coronavirus Aid, Relief, and Economic Security [CARES] Act). Federal intramural amounts for the Biomedical Advanced Research and Development Authority are transfers to the other agencies in support of Operation Warp Speed. FY 2021 data are preliminary.
Source(s):
National Center for Science and Engineering Statistics, Survey of Federal Funds for Research and Development.
Federal Funding for R&D
Of the $25.0 billion increase in FY 2020 federal R&D obligations, $19.5 billion came from stimulus funding (table 2). While the additional stimulus funds accounted for 78% of the total increase in federal R&D, these funds were highly concentrated within two Departments, namely HHS and DOD. Specifically, 91% ($17.8 billion) of stimulus funds obligated for R&D came from HHS, while DOD accounted for 8% ($1.5 billion) of total stimulus funds for R&D.
Summary of stimulus and non-stimulus obligations for R&D, by agency: FY 2020
Note(s):
Because of rounding, details may not add to total. FY 2020 obligations include additional funding provided by supplemental COVID-19–related appropriations (e.g., Coronavirus Aid, Relief, and Economic Security [CARES] Act).
Source(s):
National Center for Science and Engineering Statistics, Survey of Federal Funds for Research and Development, FYs 2020–21.
Within HHS, 81% ($14.3 billion) of stimulus funds obligated for R&D came from BARDA, with another 19% ($3.4 billion) of the HHS total coming from the National Institutes of Health (NIH). Within DOD, 65% ($998 million) of the DOD stimulus funding came from the Defense Health Agency (table 2). Although several other agencies received stimulus funds that were used for R&D, 99% of stimulus funding were obligated by HHS and DOD due to their roles in OWS. OWS was a partnership between the DOD and HHS—including from within HHS: BARDA, the Centers for Disease Control and Prevention (CDC), and NIH—for the purpose of accelerating the development and distribution of COVID-19 vaccines, therapeutics, and diagnostics. OWS was transitioned to the White House COVID-19 Response Team in early 2021.
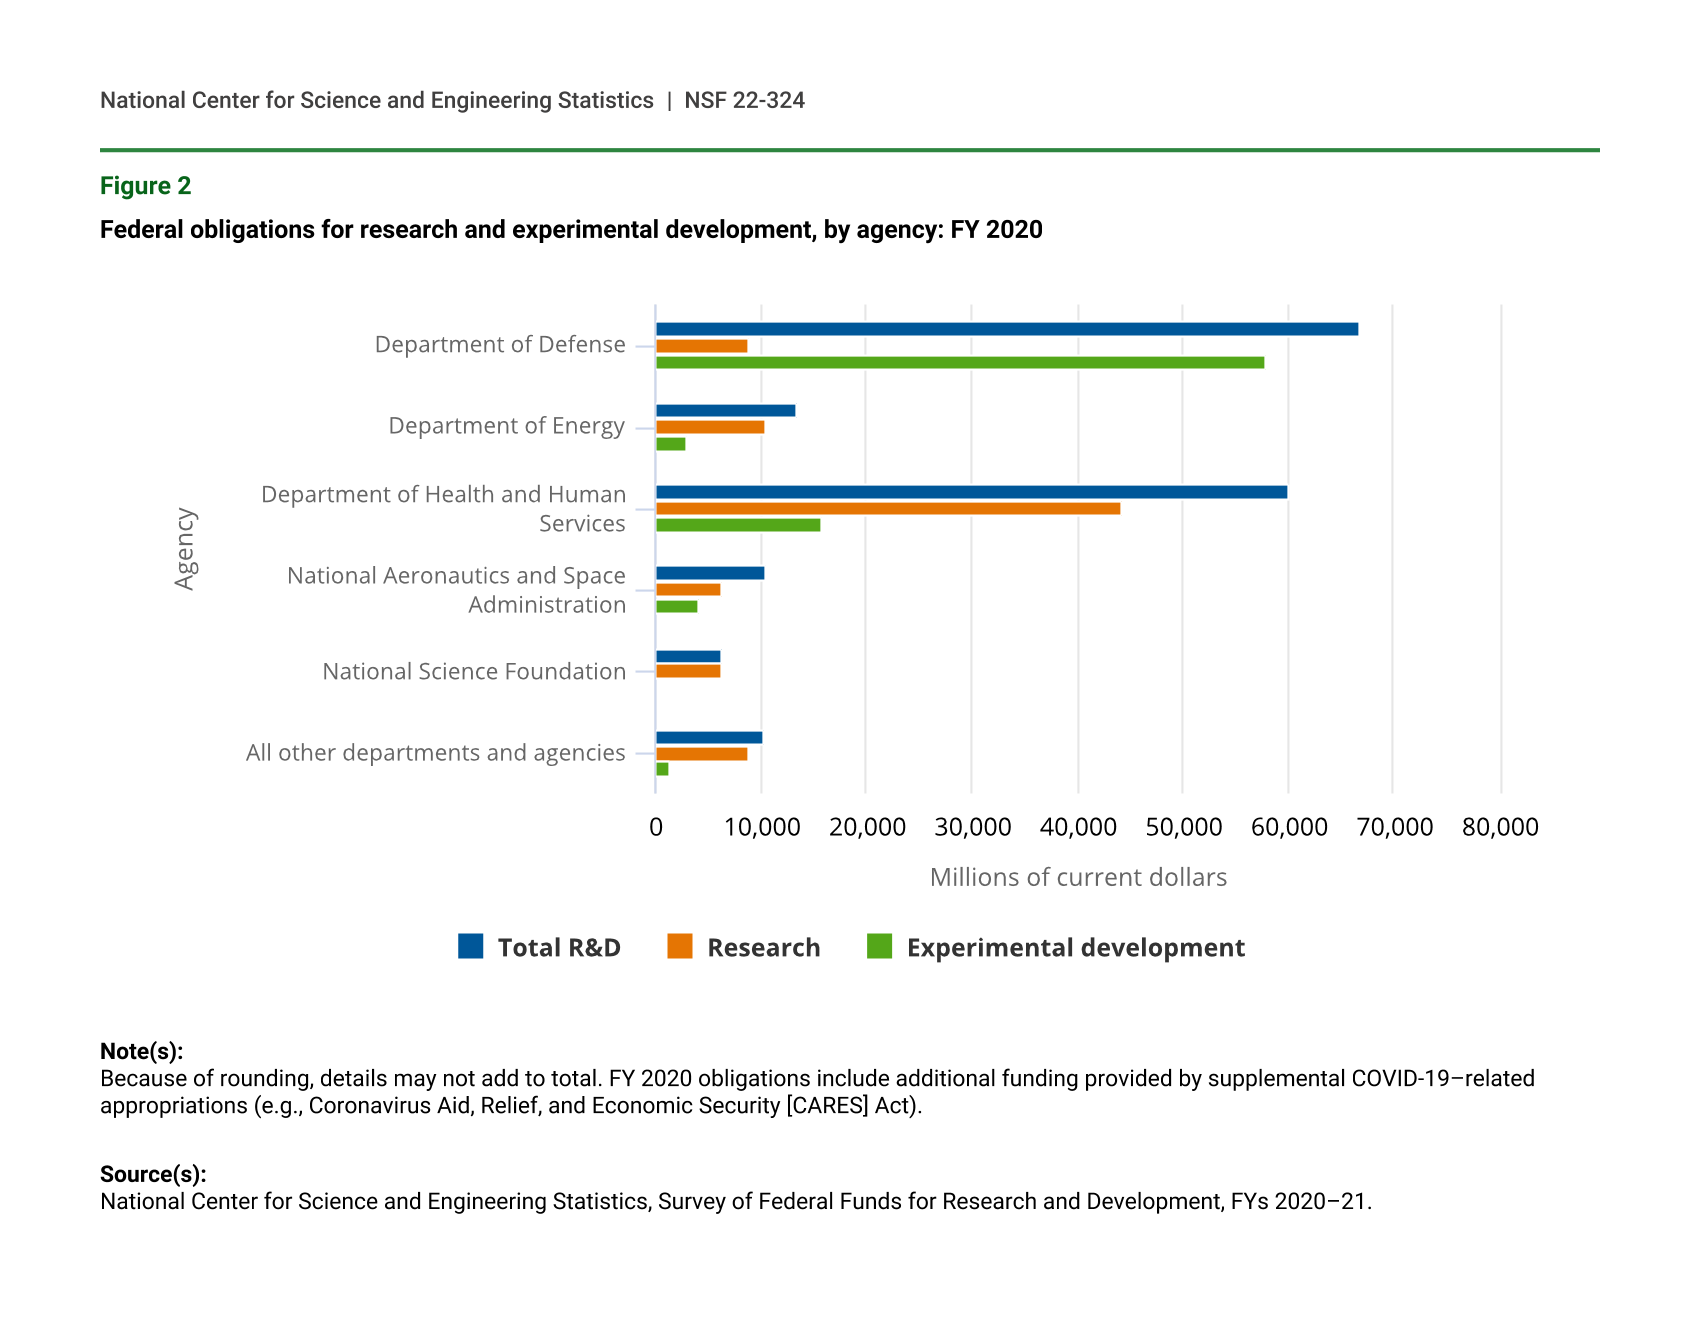
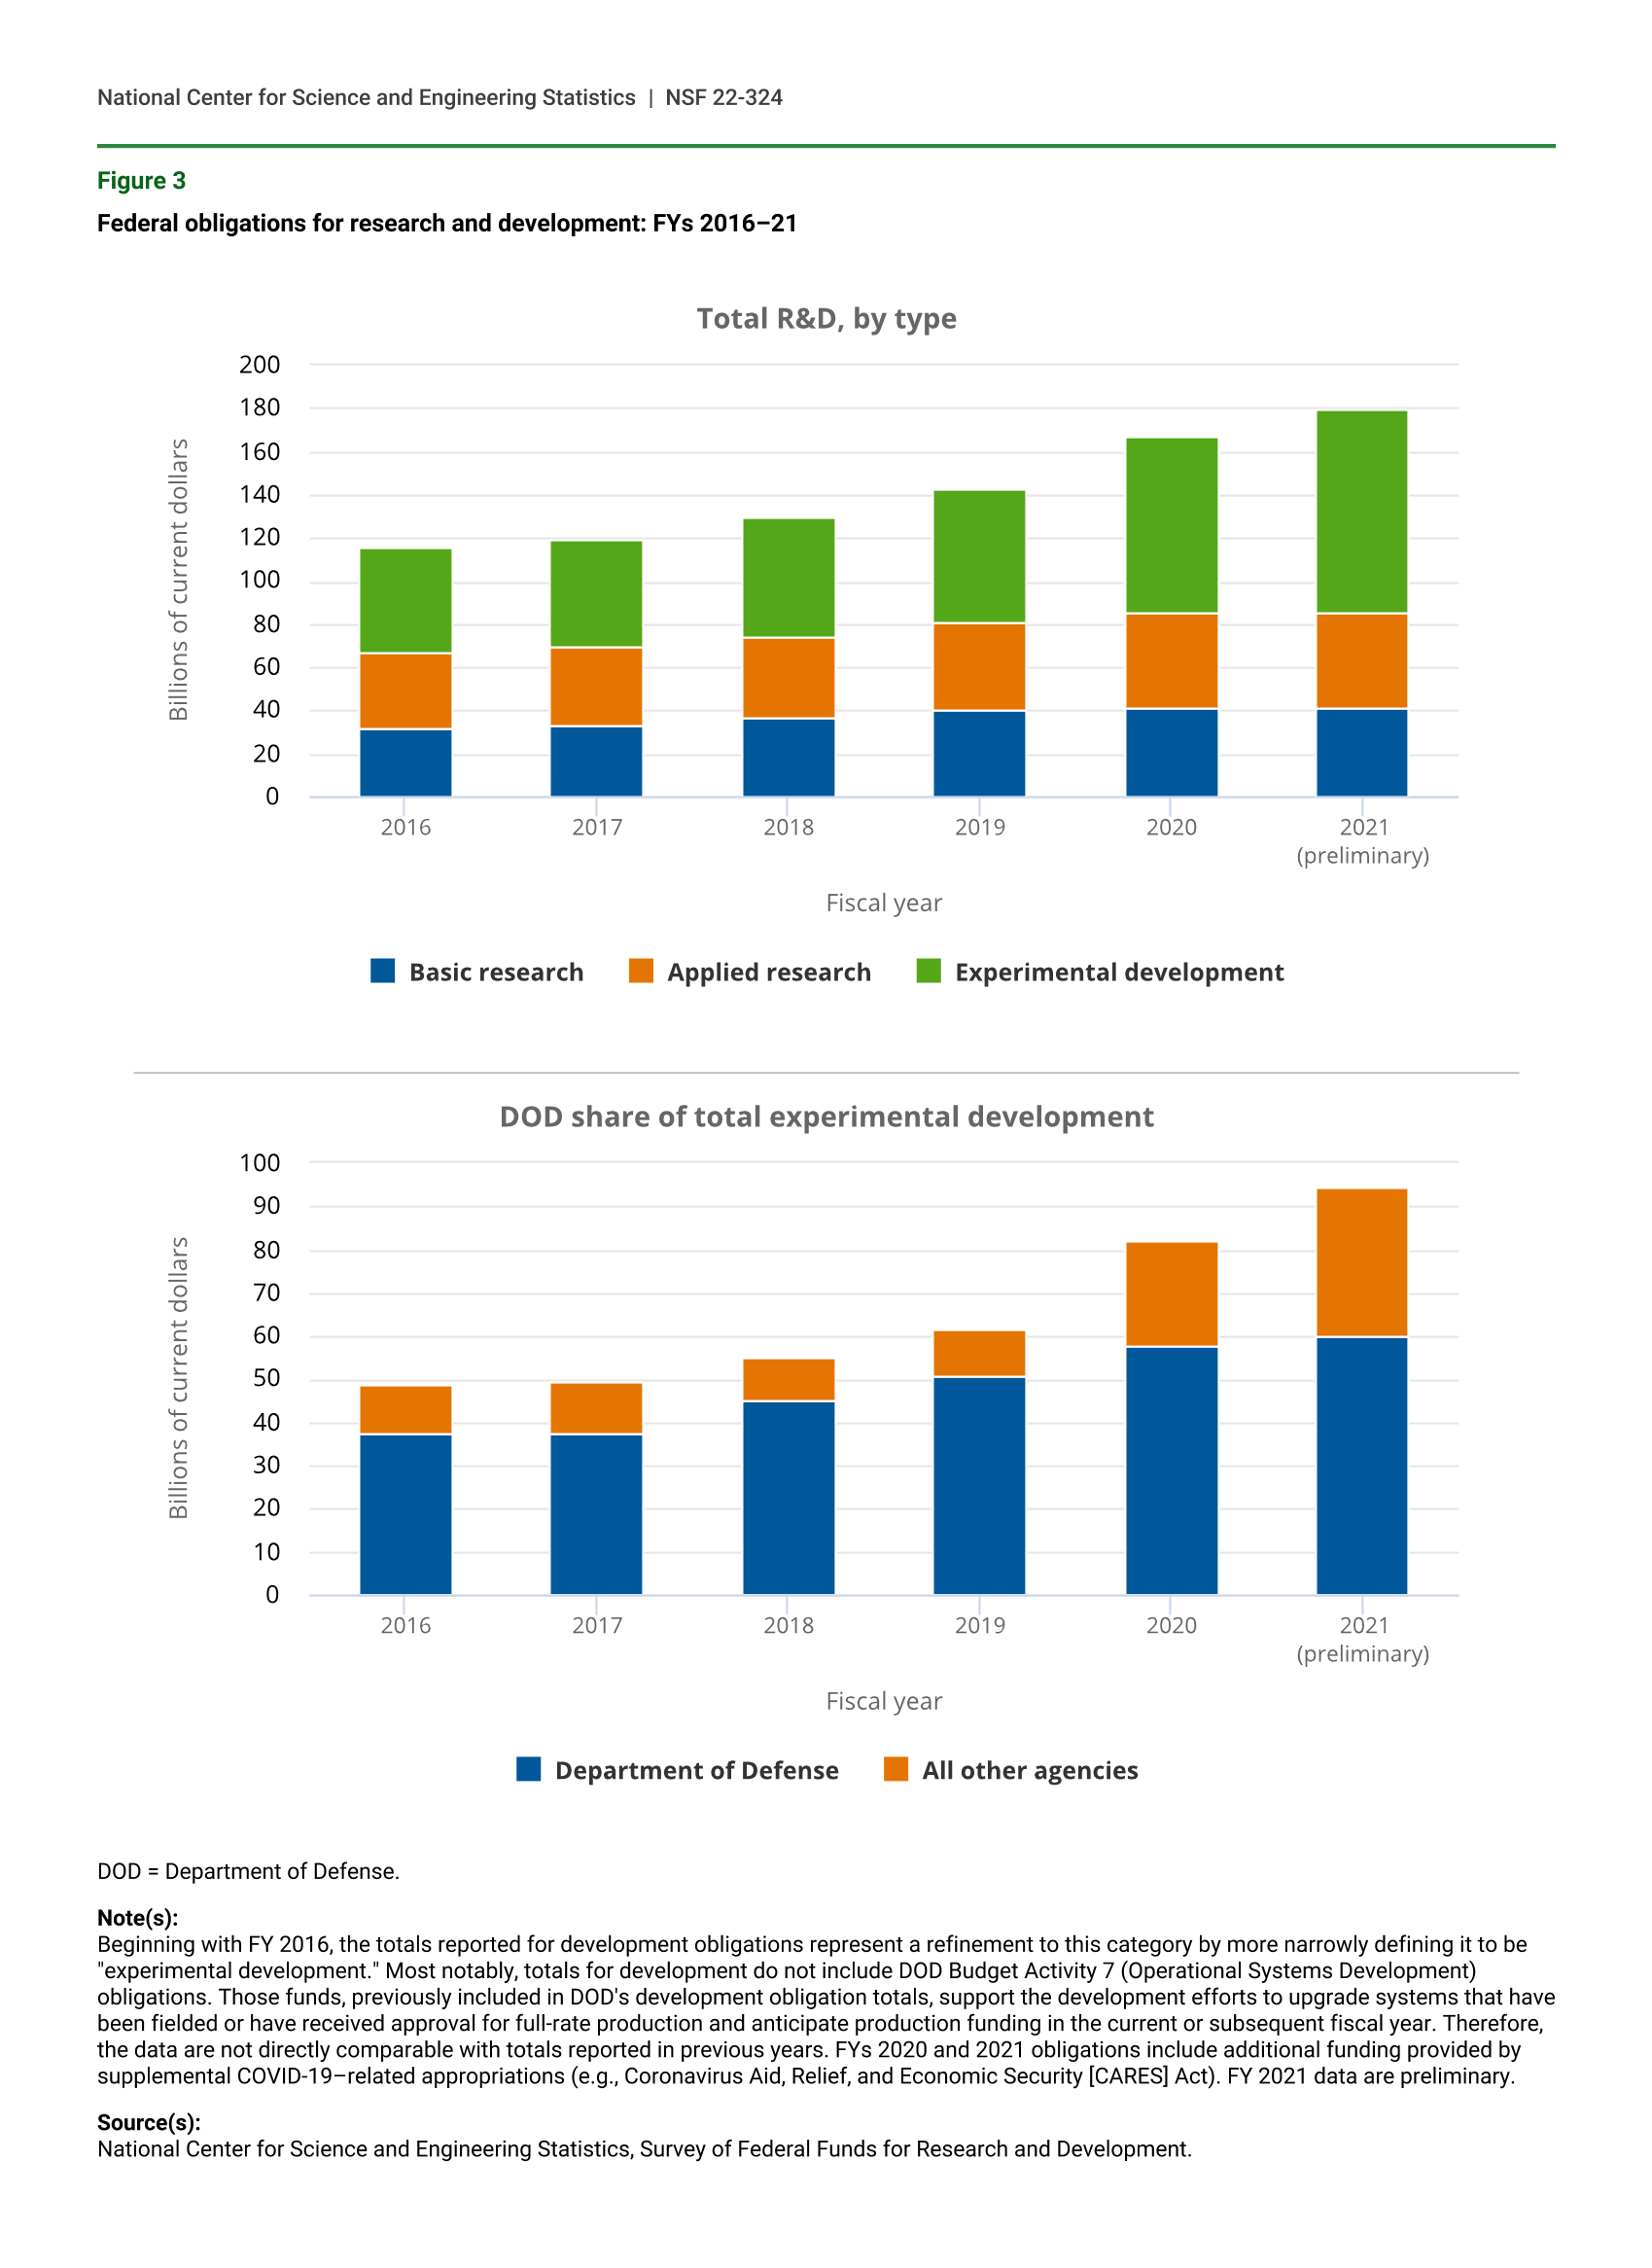
Federal agency obligations for research, including both basic research and applied research, accounted for 51% ($85.3 billion) of all federal R&D obligations ($167.4 billion), while obligations for experimental development accounted for 49% ($82.1 billion) in FY 2020. Although over half (52%, or $44.2 billion) of all research obligations are from HHS, the department’s share of experimental development is only 19% ($15.8 billion) (figure 2). Those shares contrast with DOD’s 10% share of research ($8.9 billion) and 70% share ($57.8 billion) of all federal experimental development. While federal obligations for research increased 5% from FY 2019, most of the growth in total R&D between FYs 2019 and 2020 came from experimental development, which increased 34% year to year (figure 3).
Federal obligations for research and experimental development, by agency: FY 2020
| Agency | Total R&D | Research | Experimental development |
|---|---|---|---|
| Department of Defense | 66,695 | 8,915 | 57,780 |
| Department of Energy | 13,453 | 10,525 | 2,928 |
| Department of Health and Human Services | 60,006 | 44,234 | 15,772 |
| National Aeronautics and Space Administration | 10,538 | 6,394 | 4,144 |
| National Science Foundation | 6,351 | 6,351 | 0 |
| All other departments and agencies | 10,360 | 8,885 | 1,475 |
Note(s):
Because of rounding, details may not add to total. FY 2020 obligations include additional funding provided by supplemental COVID-19–related appropriations (e.g., Coronavirus Aid, Relief, and Economic Security [CARES] Act).
Source(s):
National Center for Science and Engineering Statistics, Survey of Federal Funds for Research and Development, FYs 2020–21.
Federal obligations for research and development: FYs 2016–21
| Fiscal year | Basic research | Applied research | Experimental development |
|---|---|---|---|
| 2016 | 32.3 | 34.8 | 48.7 |
| 2017 | 33.3 | 36.6 | 49.1 |
| 2018 | 36.2 | 38.4 | 54.8 |
| 2019 | 40.0 | 41.1 | 61.3 |
| 2020 | 41.5 | 43.8 | 82.1 |
| 2021 (preliminary) | 41.2 | 43.9 | 94.3 |
| Fiscal year | Department of Defense | All other agencies |
|---|---|---|
| 2016 | 37.6 | 11.1 |
| 2017 | 37.7 | 11.4 |
| 2018 | 45.3 | 9.5 |
| 2019 | 50.5 | 10.8 |
| 2020 | 57.8 | 24.3 |
| 2021 (preliminary) | 60.0 | 34.3 |
DOD = Department of Defense.
Note(s):
Beginning with FY 2016, the totals reported for development obligations represent a refinement to this category by more narrowly defining it to be "experimental development." Most notably, totals for development do not include DOD Budget Activity 7 (Operational Systems Development) obligations. Those funds, previously included in DOD's development obligation totals, support the development efforts to upgrade systems that have been fielded or have received approval for full-rate production and anticipate production funding in the current or subsequent fiscal year. Therefore, the data are not directly comparable with totals reported in previous years. FYs 2020 and 2021 obligations include additional funding provided by supplemental COVID-19–related appropriations (e.g., Coronavirus Aid, Relief, and Economic Security [CARES] Act). FY 2021 data are preliminary.
Source(s):
National Center for Science and Engineering Statistics, Survey of Federal Funds for Research and Development.
Federal Funding for Experimental Development
In FY 2020, federal obligations for experimental development increased $20.8 billion (34%), nearly five times that of research obligations ($4.8 billion, 5%). Total FY 2020 obligations for experimental development totaled $82.1 billion, up from $61.3 billion in FY 2019 (figure 3). While DOD’s obligations for experimental development increased $7.3 billion between FYs 2019 and 2020, BARDA’s obligations for experimental development rose from $736 million in FY 2019 to $15.7 billion in FY 2020. These increases were largely the result of stimulus funds for COVID-19 vaccine development under OWS (table 3). As a result, HHS became the second-largest funder of experimental development in FY 2020 with $15.8 billion. NASA obligated the third-largest amount of experimental development at $4.1 billion in FY 2020, down from $5.5 billion in FY 2019. The Department of Energy’s (DOE’s) obligations for experimental development remained stable at $3.0 billion in FY 2020.
Federal obligations for experimental development, by agency: FYs 2019–20
na = not applicable; data were not collected at this level of detail for this agency or subagency. NA = not available; data were not collected for this agency or subagency.
Note(s):
Because of rounding, details may not add to total. FY 2020 obligations include additional funding provided by supplemental COVID-19–related appropriations (e.g., Coronavirus Aid, Relief, and Economic Security [CARES] Act).
Source(s):
National Center for Science and Engineering Statistics, Survey of Federal Funds for Research and Development.
Federal Funding to R&D Performers
Federal R&D funds are obligated to a variety of different performers (table 4). Most (69%, or $115.9 billion) of the federally funded R&D in FY 2020 was obligated to extramural performers, of which the industry sector accounted for 31% ($51.4 billion) of total federal R&D obligations. Universities and colleges accounted for 23% ($38.5 billion), federally funded research and development centers (FFRDCs) were 8% ($13.2 billion), and nonprofits at 6% ($10.7 billion) of total federal R&D obligations. However, specific agencies fund different sectors disproportionately. For example, while the industry sector was the largest recipient of extramural federal R&D, nearly 69% ($35.2 billion) of all obligations to industry were from DOD. Similarly, 62% ($23.9 billion) of obligations to universities and colleges come from HHS, with most funds ($23.2 billion) obligated by NIH.
Federal obligations for research and experimental development, by selected departments, agencies, and performer: FY 2020
FFRDC = federally funded research and development center.
a Intramural activities cover costs associated with the administration of intramural R&D programs and extramural R&D procurements by federal personnel as well as actual intramural performance.
Note(s):
Because of rounding, details may not add to total. FY 2020 obligations include additional funding provided by supplemental COVID-19–related appropriations (e.g., Coronavirus Aid, Relief, and Economic Security [CARES] Act).
Source(s):
National Center for Science and Engineering Statistics, Survey of Federal Funds for Research and Development, FYs 2020–21.
The federal sector itself (intramural R&D) received the largest amount of FY 2020 federal R&D obligations, with $51.5 billion (table 4). However, data users should note this amount includes not only obligations for the conduct of R&D within federal labs and facilities but also includes the transfer of R&D funds within the federal government from one federal agency to another. Specifically, agencies are instructed to include funds transferred to other agencies as federal intramural while agencies receiving funds are instructed to exclude those funds from their survey submission. This practice is consistent with guidance provided to federal agencies by the Office of Management and Budget (OMB), Circular A-11, Section 20. Following this guidance, BARDA reported $9.9 billion in intramural R&D obligations, but most of this was a transfer to DOD under OWS to fund vaccine development, which DOD would later issue to extramural performers in the form of grants and contracts. As such, although the final disposition of these funds is determined by DOD, they are reported by the originating agency, BARDA, as federal intramural.
Some federal agencies’ R&D obligations are almost exclusively for activities within their own labs and facilities; for example, in FY 2020, 96% ($1.5 billion) of the U.S. Department of Veteran Affairs’ R&D was intramural and 100% of the Smithsonian’s R&D ($210 million) was intramural (table 4).
Sources of obligations to FFRDCs are highly concentrated, with 58% ($7.6 billion) from DOE in FY 2020. The second largest funder of FFRDCs in FY 2020 was NASA with a 17% share ($2.3 billion), followed by DOD at 14% ($1.8 billion). Universities and colleges received 62% ($23.9 billion) of R&D obligations from HHS, 14% ($5.2 billion) from NSF, and 12% ($4.5 billion) from DOD.
Federal Funding for COVID-19 R&D
In FY 2020, federal obligations for COVID-19 R&D totaled $23.3 billion, or 14%, of total federal R&D obligations (table 5). With $21.5 billion in obligations for COVID-19 R&D, HHS accounted for nearly 93% of all COVID-19 R&D funding, which included $15.4 billion in obligations from BARDA, $6.0 billion from NIH, and $93 million from CDC. DOD contributed just under 6% with $1.4 billion directed toward COVID-19 R&D. NSF’s COVID-related obligations totaled $192 million compared to all other agencies’ combined COVID-19–related R&D obligations of $108 million.
Federal obligations for COVID-19 R&D and all other R&D, by selected departments and agencies: FY 2020
Note(s):
Because of rounding, details may not add to total. Only those agencies and subdivisions that had obligations or outlays in variables represented by this table appear in the table. Agencies were requested to report their FY 2020 obligations for COVID-19–related R&D that were from their agency's initial appropriations as well as from any stimulus funds received from the Coronavirus Aid, Relief, and Economic Security [CARES] Act plus any other pandemic-related supplemental appropriations.
Source(s):
National Center for Science and Engineering Statistics, Survey of Federal Funds for Research and Development.
Data Sources, Limitations, and Availability
The survey is a census of all federal agencies that fund R&D programs, as identified from information in the president’s budget submission to Congress, excluding the Central Intelligence Agency. Federal agencies that fund R&D are identified in the Analytical Perspectives, Budget of the United States Government, Fiscal Year 2022. Data were obtained from 33 federal agencies (14 federal departments and 19 independent agencies) that had obligations for R&D during FY 2020 or FY 2021. Because multiple subdivisions of some federal departments completed the survey, there were 77 agency-level responses: 5 federal departments, 53 agencies (within another 9 federal departments), and 19 independent agencies. However, lower offices could also be authorized to enter data: in Federal Funds Survey nomenclature, agency-level offices could authorize program offices, program offices could authorize field offices, and field offices could authorize branch offices. When these sub-offices are included, there were 737 total respondents: 77 agencies, 170 program offices, 105 field offices, and 385 branch offices.
The survey collects data by department and agency on outlays for total R&D and R&D plant: obligations by type of R&D, type of R&D by type of performer, type of performer by state-area and country, and fields of science and engineering by basic and applied research.
Volume 70 of the Survey of Federal Funds for Research and Development collected final FY 2020 data and preliminary FY 2021 totals. FY 2021 data are subject to revision when collected under next year’s survey, volume 71 (FY 2021 data and preliminary FY 2022 totals).
Beginning with volume 66 of the survey (FYs 2016 and 2017), the totals reported for development obligations and outlays represent a refinement to this category by more narrowly defining it to be “experimental development” to align with federal R&D budget formulation as per the OMB’s Circular A-11, Section 84. As a result, totals for experimental development from FY 2016 and on do not include the DOD Budget Activity 7 (Operational Systems Development) obligations and outlays. Those funds, previously included in DOD’s development totals, support the development efforts to upgrade systems that have been fielded or have received approval for full-rate production and anticipate production funding in the current or subsequent fiscal year. Therefore, the development data and total R&D data are not directly comparable with totals reported prior to FY 2016.
The full set of data tables for FYs 2020 and 2021 will be available at https://www.nsf.gov/statistics/srvyfedfunds/#tabs-2. Individual tables may be available in advance of the full report. For more information, please contact the author.
Notes
1Obligations represent the amount for orders placed, contracts awarded, services received, and similar transactions during a given period, regardless of when the funds were appropriated or when future payment of money is required.
2Gross domestic product implicit price deflators were used to convert current to constant 2012 dollars. Data on federal fiscal year historical figures, 1951–2021, can be found in: Office of Management and Budget (OMB). 2022. Budget of the U.S. Government, Fiscal Year 2022. Historical Tables. Table 10.1. Gross Domestic Product and Deflators Used in the Historical Tables: 1940–2026. Available at https://www.whitehouse.gov/omb/historical-tables/.
3In FYs 2020 and 2021, a series of supplemental appropriations bills were passed, starting in March 2020, in response to the COVID-19 pandemic: the Coronavirus Preparedness and Response Supplemental Appropriations Act, 2020 (H.R. 6074, 6 March 2020); the Families First Coronavirus Response Act (H.R. 6201, 18 March 2020); the Coronavirus Aid, Relief, and Economic Security Act (H.R. 748, 27 March 2020); the Paycheck Protection Program and Health Care Enhancement Act (H.R. 266, 24 April 2020); the added stimulus component of the Consolidated Appropriations Act, 2021 (H.R. 133 27 December 2020); and the American Rescue Plan Act (H.R. 1319, 11 March 2021). R&D funded through these Acts are collectively termed here as stimulus funding.
4See National Science Foundation (NSF). 1964. Federal Funds for Research, Development, and Other Scientific Activities: Fiscal Years 1962, 1963, and 1964. Vol. XII. NSF 64-11. Table C-4. See National Science Foundation (NSF). 1965. Federal Funds for Research, Development, and Other Scientific Activities: Fiscal Years 1963, 1964, and 1965. Vol. XIII. NSF 65-13. Table C-4.
5See U.S. Government Accountability Office (GAO). 2021. Operation Warp Speed: Accelerated COVID-19 Vaccine Development Status and Efforts to Address Manufacturing Challenges. Report GAO-21-319. Washington, DC: GAO. Available at https://www.gao.gov/assets/gao-21-319.pdf.
6See U.S. Department of Health and Human Services (HHS). 2020. Fact Sheet: Explaining Operation Warp Speed. Available at https://web.archive.org/web/20201219231756/https://www.hhs.gov/coronavirus/explaining-operation-warp-speed/index.html.
7See Congressional Research Service (CRS). 2021. Operation Warp Speed Contracts for COVID-19 Vaccines and Ancillary Vaccination Materials. CRS Insight IN11560. Available at https://crsreports.congress.gov/product/pdf/IN/IN11560.
8Experimental development is creative and systematic work, drawing on knowledge gained from research and practical experience, which is directed at producing new products or processes or improving existing products or processes. Like research, experimental development will result in gaining additional knowledge.
9Survey instructions to federal departments and agencies specifically instruct: Include the full cost of R&D, both specific project costs and overhead costs. Include both intramural and extramural R&D programs: cost of planning and administering of R&D, laboratory overhead, pay of military personnel, and departmental administration, and include funds your agency transferred to other agencies for R&D. Do not include funds your agency received from another federal agency. The transferring agency will report those funds. See Non-DOD questionnaire, page vi at https://nsf.gov/statistics/srvyfedfunds/surveys/srvyfedfunds-2020-2021-non-dod.pdf and the DOD questionnaire page vi at https://nsf.gov/statistics/srvyfedfunds/surveys/srvyfedfunds-2020-2021-dod.pdf.
10For additional information, see Office of Management and Budget (OMB). 2021. Preparation, Submission, and Execution of the Budget, Section 20(j)(4): Recording Transfers in the Budget: Expenditure Transfers. OMB Circular No. A-11. Washington, DC: OMB. Available at https://www.whitehouse.gov/wp-content/uploads/2018/06/a11.pdf.
11Not all stimulus funds were obligated for COVID-19 R&D in FY 2020, and some agencies obligated R&D related to COVID-19 from FY 2020 initial appropriations.
12The chapter on R&D in Analytical Perspectives, Budget of the United States Government, Fiscal Year 2022 available at https://www.whitehouse.gov/wp-content/uploads/2021/05/ap_14_research_fy22.pdf.
13For additional information see: Pece C, Jankowski J; National Center for Science and Engineering Statistics (NCSES). 2021. Statistical Definition of Development Clarified: Effect on R&D Totals. NSF 21-326. Alexandria, VA: National Science Foundation. Available at https://ncses.nsf.gov/pubs/nsf21326/.
Suggested Citation
Pece CV; National Center for Science and Engineering Statistics (NCSES). 2022. Driven by Stimulus Funding, Federal R&D Obligations Increased 18% in 2020; Largest Year-to-Year Change since 1963. NSF 22-324. Alexandria, VA: National Science Foundation. Available at https://ncses.nsf.gov/pubs/nsf22324.
Contact Us
NCSES
National Center for Science and Engineering Statistics
Directorate for Social, Behavioral and Economic Sciences
National Science Foundation
2415 Eisenhower Avenue, Suite W14200
Alexandria, VA 22314
Tel: (703) 292-8780
FIRS: (800) 877-8339
TDD: (800) 281-8749
E-mail: ncsesweb@nsf.gov