 An official website of the United States government
 Innovation Data from the 2019 Annual Business Survey
Nearly a third (30%) of the estimated 4.8 million for-profit companies with at least one employee introduced an innovation during 2016–18 (table 1). Business innovation is defined as a new or improved product or business process that differs significantly from a firm’s previous products or business processes. To be an innovation, the product must have been introduced to the market or the business process must have been implemented by the firm. This definition of innovation is based on guidance in Oslo Manual 2018, a joint publication of the Organisation for Economic Co-operation and Development (OECD) (of which the United States is a member) and the Statistical Office of the European Communities (Eurostat) and provides a common framework for measuring innovation. The Annual Business Survey (ABS) provides a comprehensive view of the incidences of innovation in the United States.
This InfoBrief provides a brief discussion of the evolution of the innovation definition, how the change in the definition impacted the results from the first two years of the ABS, and findings from the second year of the ABS.
Companies with product or business process innovation, by industry: 2016–18
NAICS = 2017 North American Industry Classification System.
Note(s):
Detail may not add to total because of rounding. Statistics are representative of companies located in the United States.
Source(s):
National Center for Science and Engineering Statistics and Census Bureau, 2019 Annual Business Survey: Data Year 2018.
Changes in Definition and Types of Innovation
Research and survey revisions have made the concept of innovation measurement much clearer for respondents to report in a meaningful way. The Oslo Manual sets forth a framework to develop a statistical approach to support the measurement of innovation in firms. Changes were made in Oslo Manual 2018 to both the definition of innovation and the types of innovation. These changes were informed by work conducted by OECD and Eurostat and the National Center for Science and Engineering Statistics (NCSES) in collaboration with methodologists at the Census Bureau. Effectively, the Oslo Manual 2018 defines business innovation as the following:
a new or improved product (goods or services) or business process (or combination thereof) that differed significantly from the business’s previous products or processes and that has been introduced on the market or brought into use
This was changed from the description of innovation set forth in the 2005 Oslo Manual:
the implementation of a new or significantly improved product (good or service), or process, a new marketing method, or a new organizational method
Beginning in 2012, OECD started a review of the 2005 Oslo Manual definition and concept of innovation by conducting cognitive interviews of business respondents. These interviews were conducted in multiple countries, and in the United States the work was led by NCSES. The cognitive interviews focused on the definition of innovation and types of innovation, as well as novelty and innovation activities.
Overall, respondents across all countries appeared to agree with the Oslo Manual approach to require that an innovation is implemented in the marketplace but that an innovation is not required to be successful. However, U.S.-based companies appeared to be more likely to restrict their interpretation of innovation to cases in which it results in some form of technical, commercial, or financial success. That is, in their responses in cognitive interviews, U.S. respondents focused more on outcomes that can result from innovation, including lower costs and higher efficiency, than did respondents in other countries. All respondents, regardless of location, focused on new and improved products or processes or on use of technology; most U.S. respondents indicated technology is not integral to innovation. The NCSES cognitive interviews showed that the term “significantly improved” was a contentious aspect of the 2005 Oslo Manual definition, with several respondents considering the term to be too ambiguous and lacking precise criteria for identifying innovation. There also was a general sense that something “new only to the company” (rather than “new to the market”) is not sufficient to warrant being termed an innovation but rather an imitation. (These findings resulted in specific guidance in U.S. innovation surveys that products or processes need only be new or improved for the business and that innovations can fail or take time to prove themselves.)
The earlier (2005) definition of innovation made a distinction between four different types of innovation: product, process, marketing, and organizational. The cognitive research described above found that although some aspects of innovation were easy to understand, such as product innovation, others were more problematic. Specifically, the distinction between process and organizational innovation was difficult for respondents.
When respondents were asked for examples of innovation, they often provided examples of product innovation and very seldom provided examples of marketing or organizational innovation. When asked for examples of organizational innovation, respondents often gave examples that were process innovation. The confusion between process, marketing, and organizational types of innovation led to the development of the composite “business process innovation” term used in the Oslo Manual 2018 definition. (The concept of composite business process innovations was first implemented on the ABS 2019; see below.)
Impact of Definition Change on ABS Results
Data from the 2019 ABS provide a comprehensive view of the incidence of innovation by businesses located in the United States utilizing the new definitions recommended in Oslo Manual 2018. These survey data represent an estimated 4.8 million for-profit companies publicly or privately held, with one or more employees, and active in the United States in 2018 (see “Survey Information and Data Availability” section).
Thirty percent of the estimated 4.8 million for-profit companies with at least one employee reported having an innovation during the period of 2016–18 (table 1). By contrast, per ABS 2017 more than two-fifths (43%) of the estimated 4.6 million for-profit companies with at least one employee reported having introduced an innovation during the previous period of 2015–17. The difference between the two years can most likely be attributed, to some extent, to the change in the definition but also sampling variation and changes in the questionnaire. For example, in the 2017 ABS, there were four questions asking about each of the four different kinds of innovation, giving respondents in the 2017 ABS more opportunities to say “yes” to innovation. However, in the 2019 ABS, there were only two questions about the different kinds of innovation: product innovation and business process innovation. After accounting for differences in definition, sampling, and survey changes, the two surveys show broadly similar results.
In 2016–18 (ABS 2019), the incidence rate for product innovation was 19% (table 2). For 2015–17, the product innovation incidence rate was 18% (see table 19 in the 2017 ABS), suggesting that despite the change in the definition there was little to no change in the reported incidence rate of product innovation. For the 2016–18 period, the incidence rate for U.S.-located business process innovation was 19% (table 1). There was no analogous innovation rate for composite business process innovation for the 2015–17 period.
Comparing types of innovation in the 2005 and 2018 Oslo Manual editions
ABS = Annual Business Survey; NA = not applicable.
Source(s):
Organisation for Economic Co-operation and Development and Statistical Office of the European Communities, Oslo Manual, 2005 (3rd ed.); Organisation for Economic Co-operation and Development and Statistical Office of the European Communities, Oslo Manual 2018 (4th ed.).
Despite the changes between the 2017 ABS and the 2019 ABS in how process innovation is categorized, as well as the introduction of business process innovation in the 2019 ABS, it is nonetheless possible to compare innovation rates for similar (if not perfectly matched) types of innovation for the two periods. Oslo Manual 2018 provided a crosswalk between the types of innovation covered in the 2005 Oslo Manual with the component activities recommended in Oslo Manual 2018 (table 2). The ABS 2019 collected innovation incidence rates not only for the business process innovation composite but also for the individual innovation types that comprised business process innovation. For the 2017 ABS data collection, process innovation included production, delivery and logistics, and several ancillary services, including purchasing, accounting, and information and communication technologies services. The process innovation incidence rate was 16% (see table 23 in the 2017 ABS). For the 2019 ABS data collection, process innovation—as contrasted with business process innovation—included production, distribution and logistics, and information and communication systems. With the new definition of innovation and the new questionnaire, process innovation incidence was 14% (table 2).
However, when it comes to the other types of innovation as defined in the 2005 Oslo Manual and cross-walked to the Oslo Manual 2018 definition, the results are noticeably different between the years. In data from 2015 to 2017, the incidence rate for organization innovation was 26%; in 2016–18, it was 9%. For marketing innovation, the rate was 23% in 2015–17, compared to 10% in 2016–18 (table 2).
The data changes in marketing and organizational innovation between the two years are most likely attributed to the changes in the questions that were asked, as well as the change in the definition of innovation. Table 3 presents the questions asked in both the 2017 ABS and 2019 ABS questionnaires.
2017 and 2019 ABS questions on innovation
ABS = Annual Business Survey.
Source(s):
National Center for Science and Engineering Statistics and Census Bureau, 2019 Annual Business Survey: Data Year 2018 and 2017 Annual Business Survey: Data Year 2017.
Findings from the Annual Business Survey 2019
Nearly a third (30%) of the estimated 4.8 million for-profit companies with at least one employee introduced an innovation during 2016–18 (table 1). Nineteen percent of these companies introduced one or more product innovations and 19% introduced one or more business process innovations. Companies could report having both types of innovation.
Incidence of Innovation across the U.S. Economy
When discussing innovation incidence by industry it is important to note that although rates of innovation generally are higher for manufacturing companies, the absolute number of companies reporting innovation is considerably larger in nonmanufacturing industries. Of the 4.8 million employer companies represented in the ABS, nearly 218,000 (5%) were in manufacturing and 4.6 million companies (95%) were in nonmanufacturing (table 1).
By Industry
In 2016–18, 36% of the companies classified in manufacturing industries (North American Industry Classification System codes [NAICS] 31–33) reported any kind of innovation, compared with 30% of companies classified in nonmanufacturing industries (NAICS 11, 21–23, 42–81) (table 1). More than a fifth (22%) of manufacturing companies and 19% of nonmanufacturing companies reported product innovations. For business process innovations, the innovation rate for manufacturing industries was 27% and for nonmanufacturing industries it was 19%.
Higher incidence rates of innovation were also evident in several more narrowly defined manufacturing subsectors. Communications equipment (NAICS 3342) reported 53% and pharmaceuticals and medicines (NAICS 3254) reported 52% product or business process innovation. Among nonmanufacturing subsectors, the software publishers industry (NAICS 5112) reported 56% product or business process innovation (table 1).
Product innovations were reported by about two out of five companies in the communications equipment industry (NAICS 3342) and navigational, measuring, electromedical, and control instruments industry (NAICS 3345) (43% and 41%, respectively). Business process innovations were reported by about two out of five (44%) of companies in the software publishers industry (NAICS 5112) (table 1).
By Sex and by Race and Ethnicity
A slightly higher proportion of female-majority–owned companies (32%) were product or business process innovators, compared with 29% of male-majority–owned companies (figure 1). For both product innovations and business process innovations, the proportions between female- and male-majority–owned companies were almost identical at 21% versus 19%, respectively.
Innovation incidence rate, by type of innovation and sex of majority owner(s): 2016–18
| Type of innovation | Female-majority owned | Equally owned by male and female | Male-majority owned |
|---|---|---|---|
| Product or business process innovation | 31.8 | 29.2 | 29.2 |
| Product innovation | 20.6 | 18.3 | 18.9 |
| Business process innovation | 20.7 | 19.3 | 18.8 |
Note(s):
Detail may not add to total because of rounding. Statistics are representative of companies located in the United States.
Source(s):
National Center for Science and Engineering Statistics and Census Bureau, 2019 Annual Business Survey: Data Year 2018.
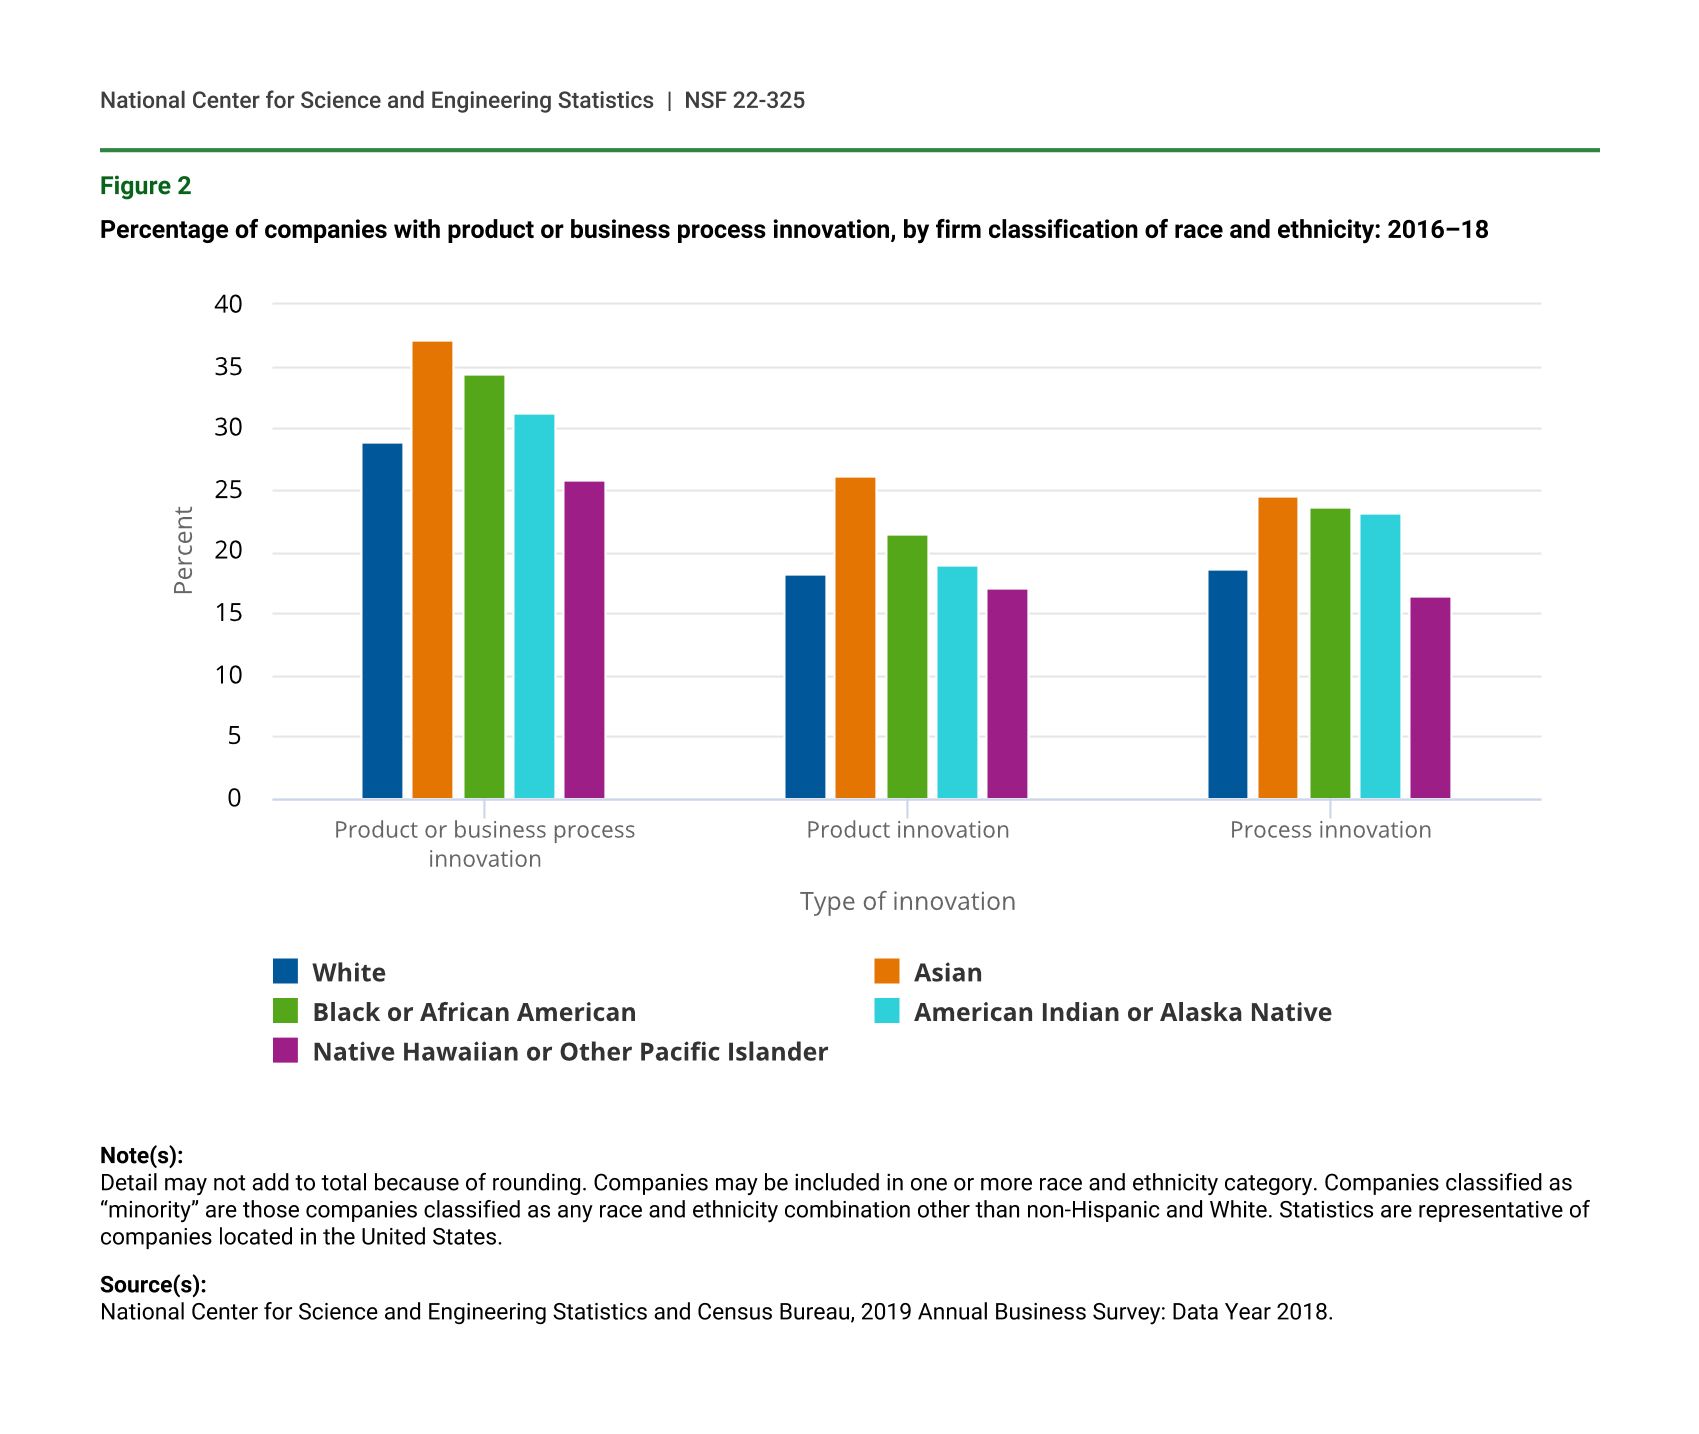
More than a third of Asian-majority–owned companies (37%) and Black or African American-majority–owned companies (35%) and 29% of white-majority–owned companies were product or business process innovators (figure 2). Approximately a quarter of Asian-majority–owned companies were each product innovators (26%) or business process innovators (25%). Over a third (36%) of Hispanic or Latino-majority–owned companies were product or business process innovators, compared to 29% of non-Hispanic-majority–owned companies (data not shown).
Percentage of companies with product or business process innovation, by firm classification of race and ethnicity: 2016–18
| Type of innovation | White | Asian | Black or African American | American Indian or Alaska Native | Native Hawaiian or Other Pacific Islander |
|---|---|---|---|---|---|
| Product or business process innovation | 28.8 | 37.1 | 34.5 | 31.3 | 25.9 |
| Product innovation | 18.3 | 26.2 | 21.4 | 18.9 | 17.0 |
| Process innovation | 18.6 | 24.5 | 23.6 | 23.1 | 16.4 |
Note(s):
Detail may not add to total because of rounding. Companies may be included in one or more race and ethnicity category. Companies classified as “minority” are those companies classified as any race and ethnicity combination other than non-Hispanic and White. Statistics are representative of companies located in the United States.
Source(s):
National Center for Science and Engineering Statistics and Census Bureau, 2019 Annual Business Survey: Data Year 2018.
By State
There were, for the most part, only small differences in the product or business process innovation rates among companies located in the individual 50 states and the District of Columbia. The innovation rates for states ranged from 33% to 23% for product or business process innovation. For product innovation, the states ranged from 22% to 14% and from 24% to 11% for business process innovation (table 4).
Companies with product or business process innovation, by state: 2016–18
Note(s):
Details may not add to total because of rounding.
Source(s):
National Center for Science and Engineering Statistics and Census Bureau, 2019 Annual Business Survey: Data Year 2018.
Survey Information and Data Availability
The ABS is designed to collect a wide range of data on business R&D, intellectual property, company and primary owner characteristics, and innovation activities in the United States. The ABS was developed and is cosponsored by NCSES and the Census Bureau. The statistics from the survey are based on a sample, and as such, they are subject to both sampling and nonsampling errors (see “Technical Notes” in the Annual Business Survey: 2019 (Data Year 2018) that are available at https://ncses.nsf.gov/pubs/nsf22315).
For the 2019 ABS, 299,976 employer companies were sampled to represent the population of 5.3 million employer companies, 4.8 million of which were in scope for the innovation and technology modules. For the 2019 ABS, the unit response rate was 72%.
For the 2017 ABS, a total of 849,970 employer companies were sampled to represent the population of 5.3 million employer companies. For the full 2017 ABS, the unit response rate was 69%.
The full set of data tables on innovation, R&D, company demographics, technology, and patent and intellectual property protection from this survey are available in the report Annual Business Survey: 2019 (Data Year 2018) (https://ncses.nsf.gov/pubs/nsf22315). Individual data tables and tables with relative standard errors and imputation rates from the 2019 ABS are available upon request from the Survey Manager. The full set of tables for Annual Business Survey: Tables for Data Year 2017 is available at https://ncses.nsf.gov/pubs/nsf21303.
Notes
1Organisation for Economic Co-operation and Development (OECD) and Statistical Office of the European Communities (Eurostat). 2018. Oslo Manual 2018: Guidelines for Collecting, Reporting and Using Data on Innovation, 4th ed. Paris: OECD Publishing; Luxembourg: Eurostat. Available at https://doi.org/10.1787/9789264304604-en.
2Organisation for Economic Co-operation and Development (OECD) and Statistical Office of the European Communities (Eurostat). 2005. Oslo Manual: Guidelines for Collecting and Interpreting Innovation Data, 3rd ed. Paris: OECD Publishing. Available at https://doi.org/10.1787/9789264013100-en.
3Peric S, Galindo-Rueda F. 2014. Final Report: The Cognitive Testing of Innovation Survey Concepts, Definitions, and Questions. p 5. Paris: Organisation for Economic Co-operation and Development. NSF Award Number: 1114138.
4Tuttle A, Alvarado H, Beck J. 2019. OECD Innovation Project: Findings From Early Stage Scoping Interviews In The United States Final Report. Research and Methodology Directorate, Center for Behavioral Science Methods Research Report Series (Survey Methodology #2019-05). Washington, DC: Census Bureau. Available at https://www.census.gov/content/dam/Census/library/working-papers/2019/adrm/rsm2019-05.pdf.
5The 2019 ABS refers to data reference year 2018 and is the second year of the survey. The 2017 ABS refers to data reference year 2017 and was the first year of the survey.
6The 4.8 million for-profit companies were active in 2018 and not necessarily during the entire 2016–18 time period.
7The differences in the innovation incidence rates are not statistically significant.
Suggested Citation
Kindlon AE, Jankowski J; National Center for Science and Engineering Statistics (NCSES). 2022. Innovation Data from the 2019 Annual Business Survey. NSF 22-325. Alexandria, VA: National Science Foundation. Available at https://ncses.nsf.gov/pubs/nsf22325/.
Contact Us
NCSES
National Center for Science and Engineering Statistics
Directorate for Social, Behavioral and Economic Sciences
National Science Foundation
2415 Eisenhower Avenue, Suite W14200
Alexandria, VA 22314
Tel: (703) 292-8780
FIRS: (800) 877-8339
TDD: (800) 281-8749
E-mail ncsesweb@nsf.gov