 An official website of the United States government
Labor Force Transitions of U.S.-Trained Doctoral Scientists and Engineers: Findings from a New Longitudinal Panel
Labor force transitions of doctoral scientists and engineers are crucial to U.S. economic growth and competitiveness. This InfoBrief introduces a new resource for analysis of change dynamics among this doctoral workforce, using a longitudinal panel from the Survey of Doctorate Recipients (SDR). This data resource offers insights unlike those available via cross-sectional means. For example, in 2015, U.S.-trained doctoral scientists and engineers under 66 years of age participated in the labor force worldwide at an exceptionally high rate of 96%. Over the 4-year period of 2015–19, their labor force participation declined gradually to 92% but remained high when compared with the U.S. civilian population of similar ages (table 1). Retirement was a major reason for leaving the labor force, with 8% reporting being retired in either 2015, 2017, or 2019. With unemployment rates lower than 2% during this period, a large majority (87%) of them were employed during all three survey reference periods in 2015, 2017, and 2019. However, about 1 in 5 changed their sector of employment over this time (table 2). These and other findings described below are made possible by the ongoing 2015–25 SDR longitudinal panel (LSDR 2015–25), which is designed to provide information about employment changes among U.S.-trained science, engineering, and health (SEH) doctorate holders over this 10-year period.
The LSDR 2015–25 panel includes SEH doctorate holders who were originally surveyed in the annual Survey of Earned Doctorates (SED) at the time they received their doctoral degree and were subsequently sampled into the SDR in 2015. They are now being re-interviewed biennially for information on changes in employment status and other important transitions in their career pathways. The LSDR 2015–19 data file is the first release of data from this longitudinal study. Data for the LSDR 2015–25 panel will be updated with additional information from the ongoing SDR cycles of data collection in 2021, 2023, and 2025.
Labor force participation and unemployment of U.S. civilian population and LSDR population: 2015–19
CPS = Current Population Survey; LSDR = Survey of Doctorate Recipients longitudinal panel.
a The LSDR target population consists of approximately 856,000 U.S.-trained research doctorate holders in science, engineering, or health fields who earned their doctorates before 2014 and were 65 years of age or younger in 2015.
b General age range is 25–64 years for the CPS and all ages for the LSDR.
c Older age range is 55–64 years for the CPS and 56–65 years in 2015 for the LSDR.
Note(s):
Labor force and unemployment statistics of U.S. civilian population are CPS 2015, 2017, and 2019 annual average employment status tables are available at https://www.bls.gov/charts/employment-situation/civilian-labor-force-participation-rate.htm and at https://www.bls.gov/charts/employment-situation/civilian-unemployment.htm. CPS definitions for U.S. civilian population and labor force are detailed at https://www.bls.gov/cps/definitions.htm#population.
Source(s):
National Center for Science and Engineering Statistics, Survey of Doctorate Recipients longitudinal panel 2015–25 (LSDR 2015–19 data file).
Changes in employment status among the SEH doctorate holders, by sex, career stage, and visa status: 2015–19
SEH = science, engineering, and health; S&E = science and engineering.
a Labor force and retirement status estimates are for the baseline survey in 2015 and follow-up surveys in 2017 and 2019.
b Selected characteristic was reported at least one time or at all times in each of the three survey reference periods of 1 February 2015, 2017, or 2019.
c Change in selected employment characteristic occurred at least once among 745,400 who were employed in all three survey reference periods of 1 February 2015, 2017, and 2019.
Note(s):
The early career doctorate holders are those who earned their doctorates between 2009 and 2013. This subgroup remains in the first 10 years after earning their doctorate degree during the survey period 2015–19.
Source(s):
National Center for Science and Engineering Statistics, Survey of Doctorate Recipients longitudinal panel 2015–25 (LSDR 2015–19 data file).
The SDR longitudinal survey data are a new resource for analysis of labor force dynamics and provide information on topics including the incidence of retirement; researcher mobility; and career changes, especially among recent doctorate recipients. The data can be used to study patterns over time and detect changes in the characteristics of the target population at the group and individual level. The longitudinal data are flexible in terms of offering population estimates at multiple points in time and marking transitions between various starting and ending points within the study period. Limitations of the data do exist. For example, duration of unemployment, number of jobs, and other types of transitions cannot be precisely measured because the current survey instruments collect employment data for only a short reference period in each survey year.
Changes in Labor Force Status
The first 10 years after earning an SEH research doctorate degree is considered the early career stage of employment. In the longitudinal panel, doctoral graduates from years 2009 to 2013 were in their early career during the period 2015–19, and they account for nearly a fifth (19%) of the study population, representing approximately 165,000 doctorate holders. At the other end of the longitudinal panel are doctorate holders in their later career stage in 2015, comprising a group aged 56–65 years. More than a quarter (27%) of the study population is in this older group, representing approximately 235,000 doctorate holders. Though job changes may be more common for early career doctorate holders exploring employment options, transitioning out of the labor force is a more common experience among those in their late career. Unemployment, in contrast, is uncommon throughout this highly trained SEH doctoral population. Less than 4% of them reported being unemployed during one or more of the surveys’ reference periods in 2015, 2017, and 2019 (table 2). Overall, a higher proportion of female doctorate holders (4%) experienced unemployment than their male counterparts (3%) during the period. This pattern holds true for early career doctorate holders, with more women (6%) than men (4%) experiencing unemployment.
Not working is generally due to unemployment or being out of the labor force. The incidence of not working was observed during three survey reference periods between 2015 and 2019, and a higher proportion (16% vs. 11%) of women than men were not working during at least one of the reference periods (table 2). Not working could be temporary, especially for those who entered the job market not long ago. Among female early career doctorates, 10% were not working in either 2015 or 2017, but 60% of those previously not working were employed in 2019. In contrast, among male early career doctorates, a smaller proportion (4%) were not working in either 2015 or 2017, and most of them (82%) were later employed in 2019.
Employment Mobility
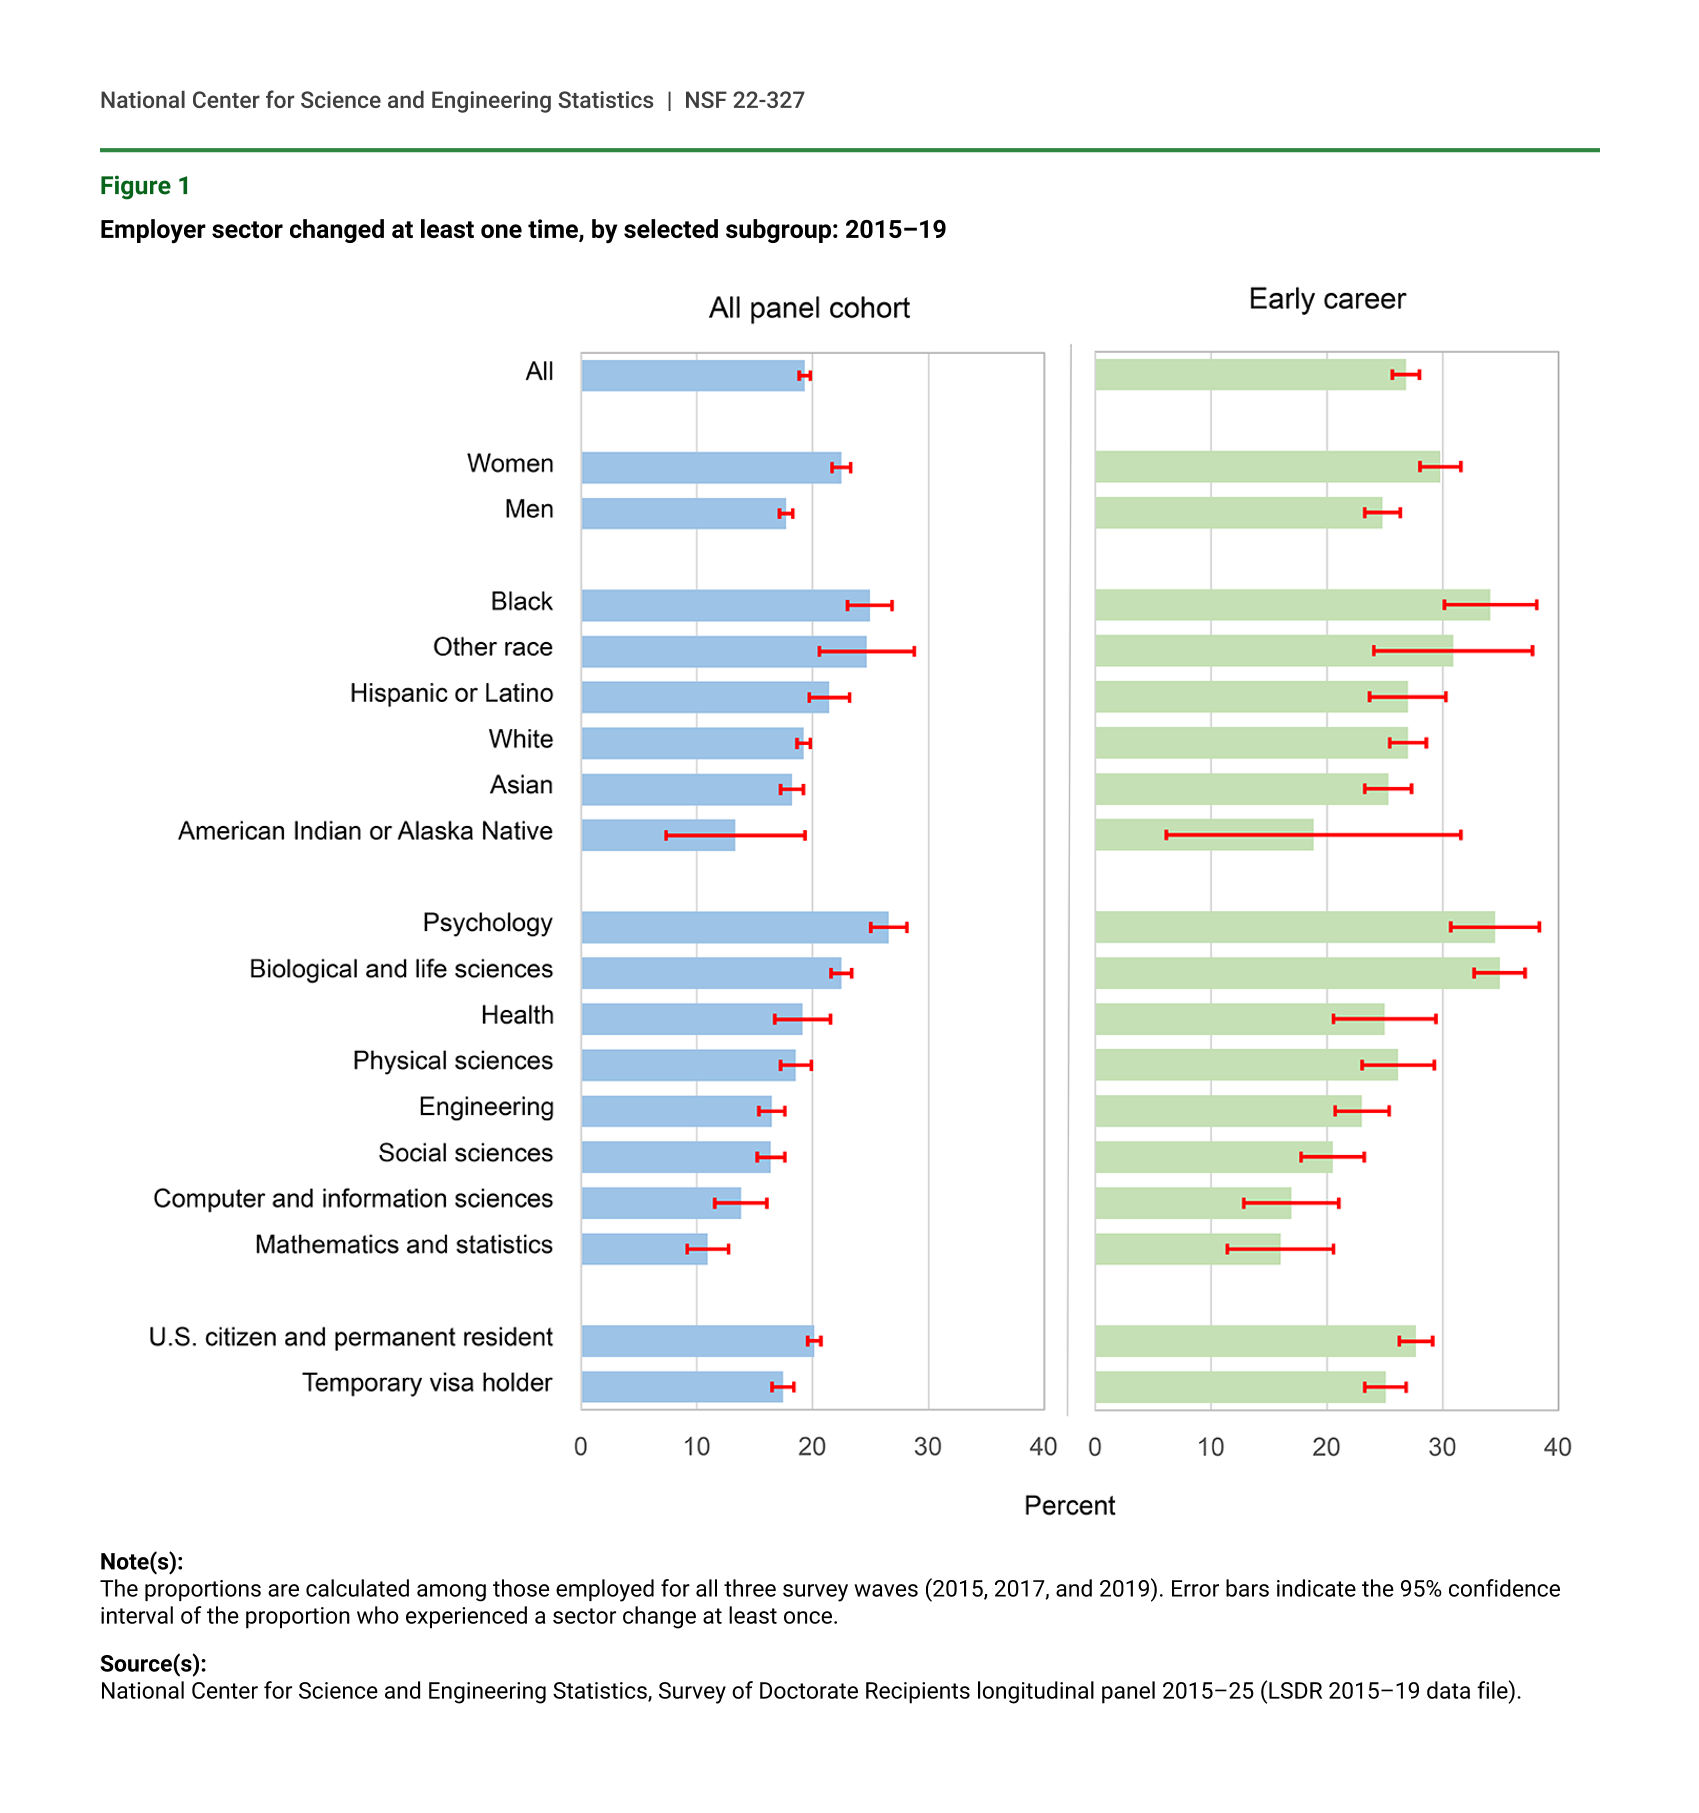
Various aspects of employment mobility can be examined for this panel. For example, employment sector is a fundamental factor that affects work experience, opportunities, job security, and prestige of a scientific career (National Research Council 2001). The LSDR 2015–19 data classify the employment sector into eight categories: two educational sectors (academia and 2-year or pre-college institutions), three industry sectors (for-profit, self-employed, and non-profit), and three government sectors (U.S. federal, U.S. state and local, and non-U.S. government). Occurrence of employment sector changes during 2015–19 was assessed among an estimated 745,400 SEH doctorate holders who were employed during all three survey reference periods. Overall, 19% of this group experienced employment sector changes. Differences in the proportion experiencing employment sector changes were observed among subgroups defined by sex, race or Hispanic ethnicity, doctoral field of study, and U.S. citizenship status (figure 1).
Employer sector changed at least one time, by selected subgroup: 2015–19
Note(s):
The proportions are calculated among those employed for all three survey waves (2015, 2017, and 2019). Error bars indicate the 95% confidence interval of the proportion who experienced a sector change at least once.
Source(s):
National Center for Science and Engineering Statistics, Survey of Doctorate Recipients longitudinal panel 2015–25 (LSDR 2015–19 data file).
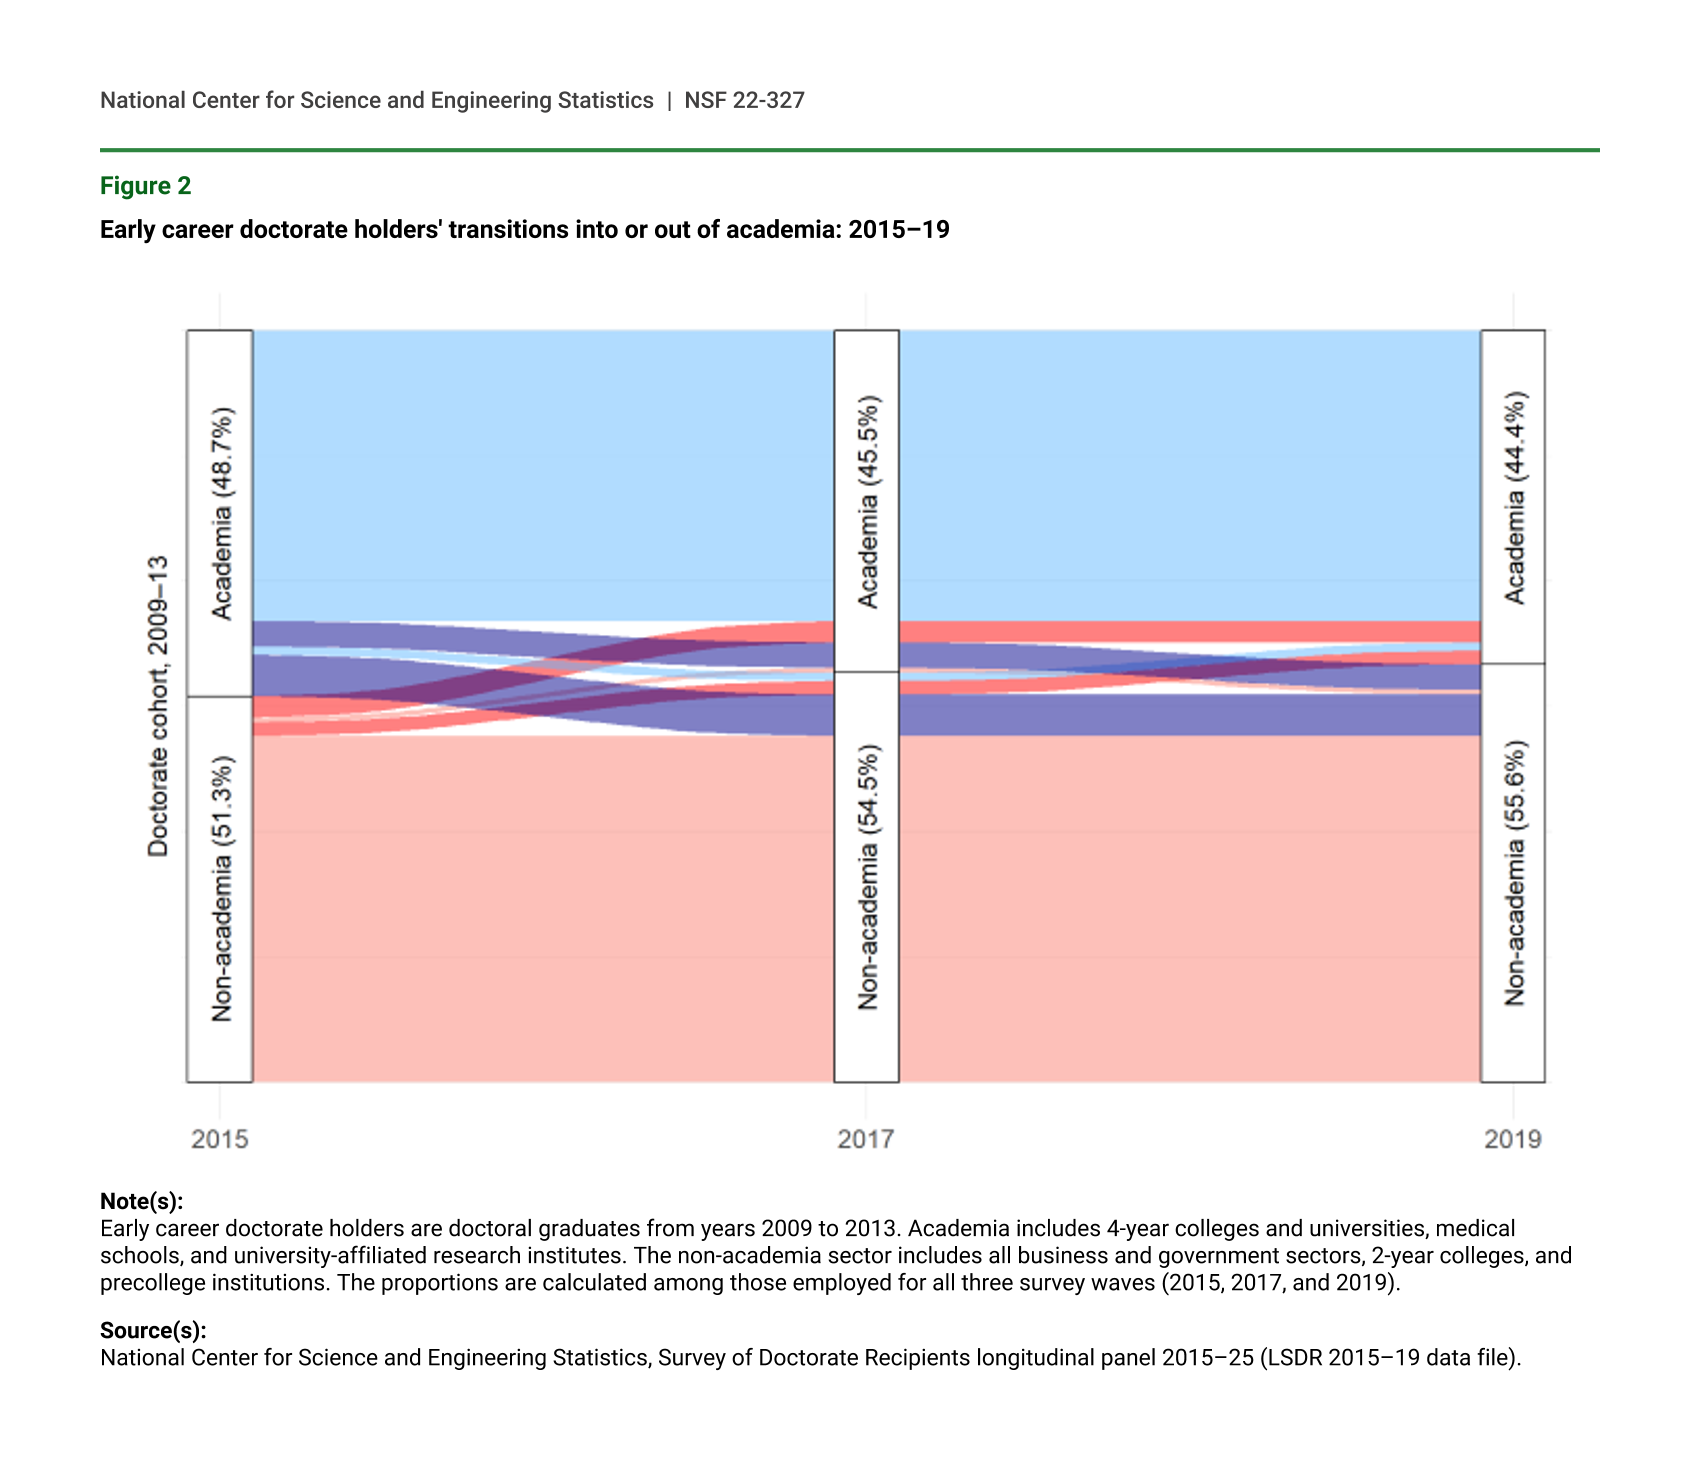
There is a large number of transition patterns observed across all eight sector categories, but 40% were transitions between sub-sectors within one of the three broad sectors of education, industry, and government. Changes across broad employment sectors were most common between education and industry (31%), followed by government and industry (18%), and education and government (9%). Only a small fraction of the changes (3%) involved moving across all three broad sectors during 2015–19. Early career doctorates seeking a career track in research or teaching often head to academia. Nearly half (49%) of the early career doctorates who were employed in all three survey waves were working in academia in 2015. By 2019, about 9% transitioned out of academia, and about 5% transitioned into academia from working in non-academia sectors in 2015. The patterns of moving into and out of academia are illustrated in figure 2. Among early career doctorates employed in academia in 2015, approximately 34% were in a tenure track position and 4% were tenured. By 2019, only 27% were in a tenure track and 21% were tenured.
Early career doctorate holders' transitions into or out of academia: 2015–19
Note(s):
Early career doctorate holders are doctoral graduates from years 2009 to 2013. Academia includes 4-year colleges and universities, medical schools, and university-affiliated research institutes. The non-academia sector includes all business and government sectors, 2-year colleges, and precollege institutions. The proportions are calculated among those employed for all three survey waves (2015, 2017, and 2019).
Source(s):
National Center for Science and Engineering Statistics, Survey of Doctorate Recipients longitudinal panel 2015–25 (LSDR 2015–19 data file).
Doctorate holders in SEH fields typically work in occupations closely related to their field of study. However, job market demand or professional development may motivate occupational transitions into different fields. Overall, 25% of those employed in all three survey waves worked in a non-science and engineering (S&E) occupation during at least one survey reference date during the 2015–19 period. The early career subgroup had a lower rate at 19%, while 31% of those 56–65 years of age worked a non-S&E job at least once (table 2).
Since 2015, the SDR’s population coverage has fully represented internationally residing, U.S.-trained SEH doctorate holders (Chang and Foley 2017). The mobility of this highly trained population in terms of location of residence can be studied using the LSDR 2015–19 data. The vast majority (85%) of the panel resided in the United States during all three reference periods, while 12% resided outside of the United States during all three times (table 2). Overall, about 3% moved into or out of the United States during this time (see table 1-C in the detailed statistical tables at https://ncses.nsf.gov/pubs/nsf22326/). Doctoral graduates with a temporary U.S. visa had a substantially higher proportion residing abroad (32%) during this period (table 2).
Transitioning to Retirement and Part-Time Employment
The LSDR 2015–19 data indicate that only 1% of doctorate holders who were age 55 or younger in 2015 were retired in 2019. This contrasts with a much higher rate of retirement (22%) among those aged 56–65 years. The subgroup of 56–65-year-old doctorate holders was in their later career in 2015, with 91% having earned their doctorate more than 20 years earlier. In 2015, while 89% of this group was employed, 1 in 10 was not in the labor force, with most of these individuals (9%) being retired. The portion of this subgroup who were retired grew steadily over time, increasing to 15% in 2017 and to 22% in 2019. Among 56–65-year-old doctorate holders employed in 2015, 15% had transitioned to retirement by 2019. Overall, 24% of this age group retired at least one time between 2015 and 2019, accounting for 89% of those who retired at least one time in the full panel.
The one-time, irreversible transition from full-time employment to complete retirement has evolved, with retirement now being viewed as a complex process unfolding over time and varying considerably across individuals (Szinovacz 2013). For those who retired before 2019, the LSDR data currently offers limited information about post-retirement status due to the short time span (2015–19). About 15% of the subgroup of 56–65-year-old doctorate holders reported being retired in 2015 or 2017. Among these individuals, a majority (84%) remained retired at later points in time and 14% reported employment post-retirement. For those who first reported retirement in 2017 or 2019, a substantial portion (31%) were not working or were working part time at some point before the reported retirement.
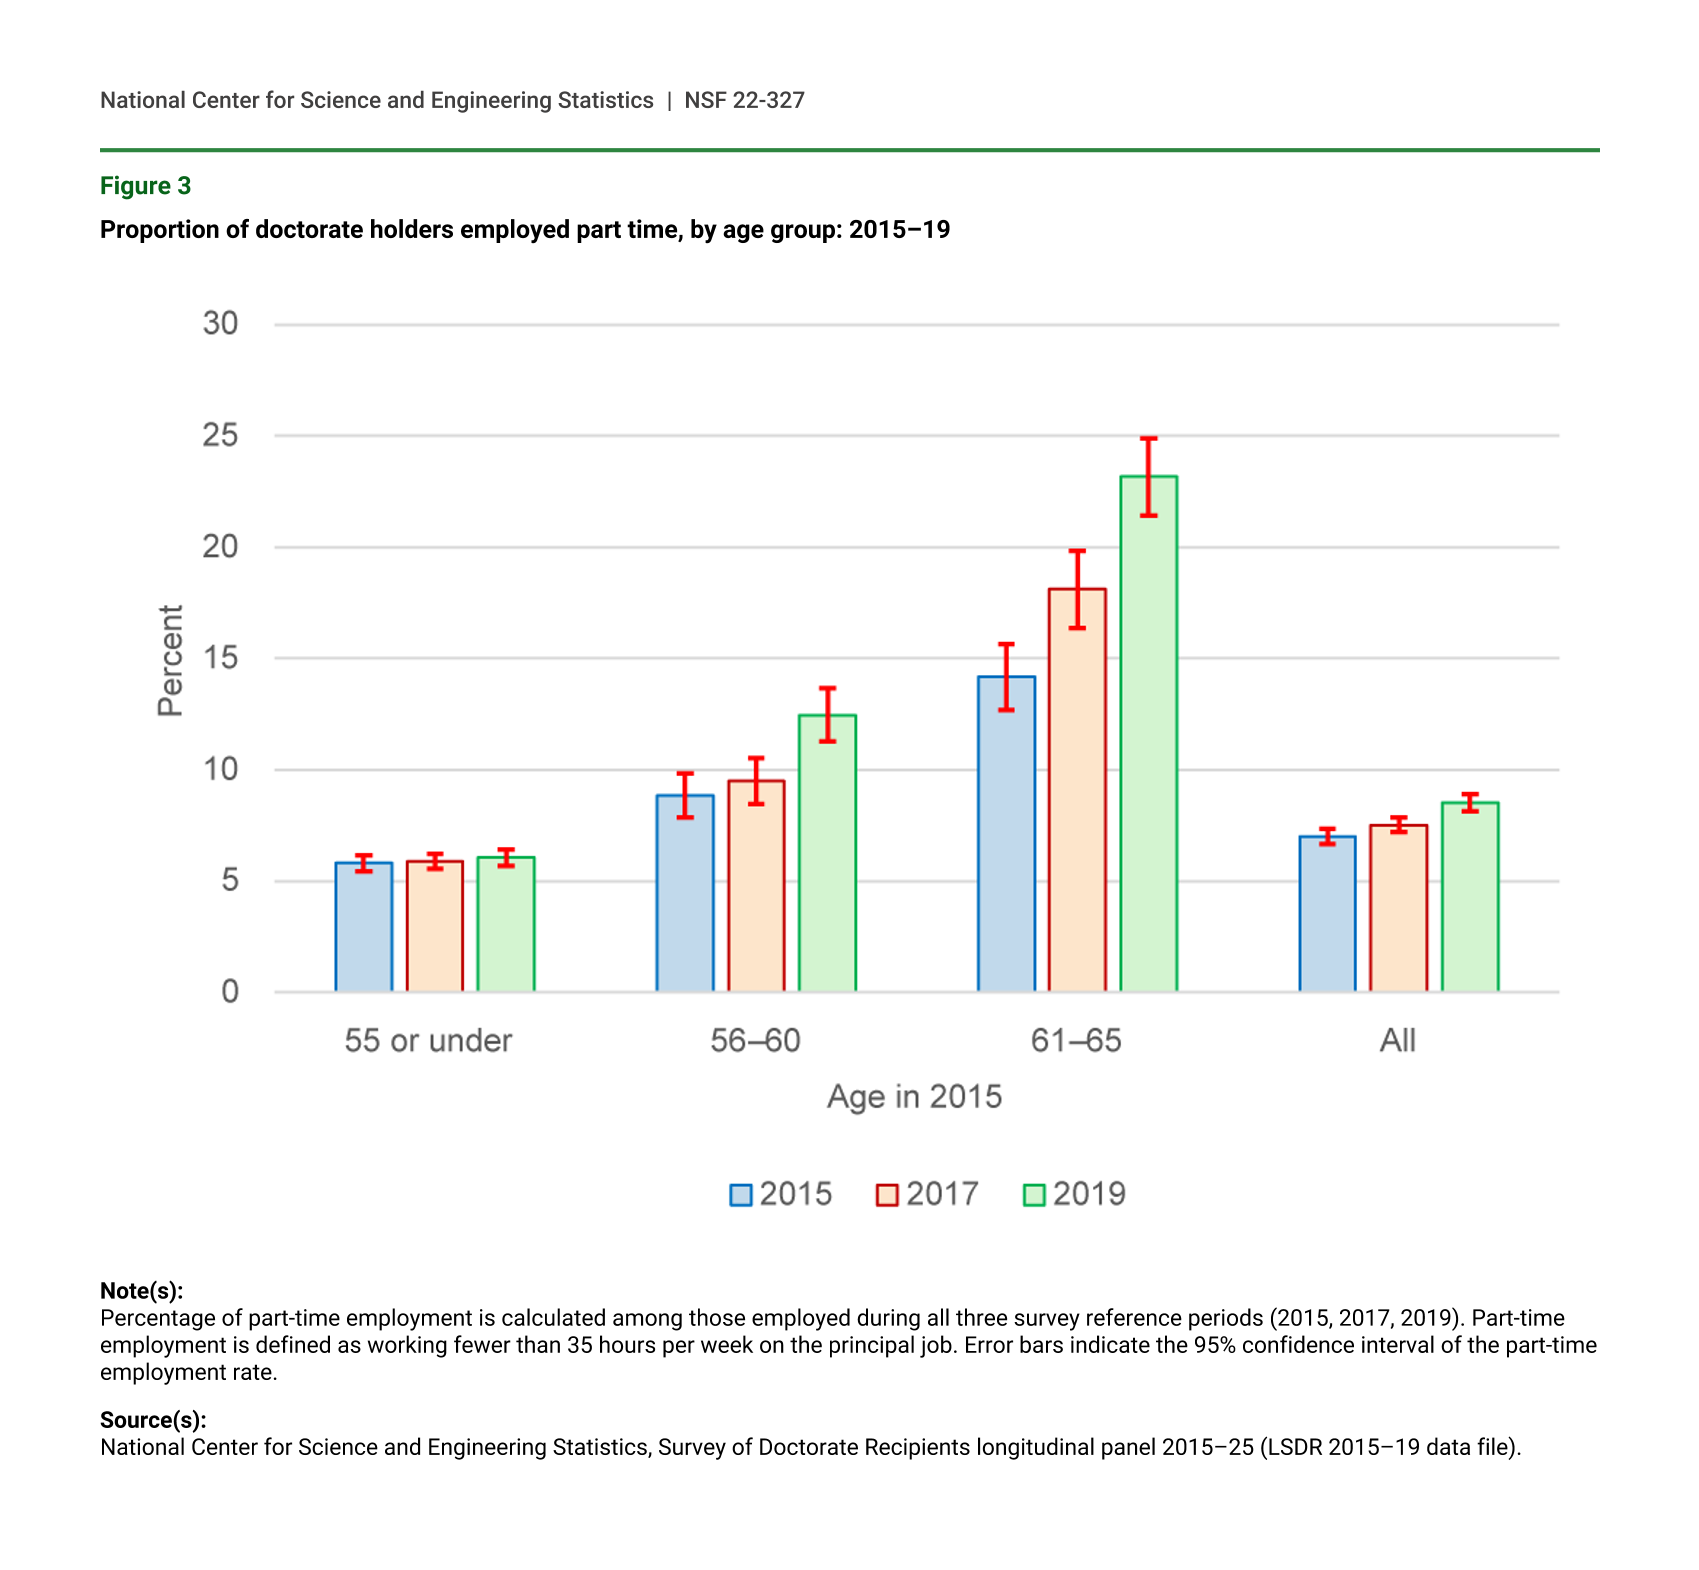
Results from studies conducted in Europe and the United States suggest that reducing working hours is an appealing option for partial or gradual retirement among older workers as they approach full retirement, and it has potential for extending one’s work life (Berg et al. 2020; Cahill and Quinn 2020). Working fewer than 35 hours per week is considered working part time. In the LSDR 2015–19 panel, 14% of doctorate holders were working part time during at least one survey reference date between 2015 and 2019. Working part time was more prevalent among female doctorate holders and minority groups, with 18% of Blacks, 20% of women, and 22% of those aged 56–65 having worked part time at least once during this period. Changes within the part-time employment rate can be observed for those employed during all three survey reference periods. For those aged 55 or younger, the part-time employment rate remained steady and unchanged at about 6%, while the part-time employment rate increased considerably from 14% to 23% among those aged 61–65 (figure 3).
Proportion of doctorate holders employed part time, by age group: 2015–19
Note(s):
Percentage of part-time employment is calculated among those employed during all three survey reference periods (2015, 2017, 2019). Part-time employment is defined as working fewer than 35 hours per week on the principal job. Error bars indicate the 95% confidence interval of the part-time employment rate.
Source(s):
National Center for Science and Engineering Statistics, Survey of Doctorate Recipients longitudinal panel 2015–25 (LSDR 2015–19 data file).
Data Sources, Limitations, and Availability
The LSDR 2015–25 is designed to be a general doctoral population panel and track the same individuals across points in time and provide data over a 10-year period, 2015–25. The panel sample was selected from those who were age 65 or younger and responded to the 2015 SDR, which was the baseline survey. The sample consists of 40,148 individuals who earned an SEH doctorate from a U.S. educational institution before 1 July 2013 and represents a population of approximately 860,000 at the baseline. The LSDR 2015–19 data file is the first release of longitudinal data for this panel and contains survey responses from the SED and three cycles of the SDR (2015, 2017, and 2019). A subset of 3,749 individuals who failed to respond in both 2017 and 2019 was excluded from the LSDR 2015–19, and the remaining 36,399 sample cases were weighted to represent the panel baseline population and account for non-respondents. The panel sample used in this report excludes 228 individuals who became ineligible for the survey in 2017 or 2019, it and represents a target population of approximately 856,000 U.S.-trained research doctorate holders in science, engineering, or health fields.
In this first release, the LSDR 2015–19 file contains only a subset of 32 variables from each SDR survey cycle. These variables include the items that are critical to representing a completed SDR questionnaire; hence, they have zero or very low item missing rates. Missing data that was imputed for prior cross-sectional SDR surveys was retained, and additional missing data was imputed for sample cases that were non-respondents during one SDR cycle. Also included in the LSDR 2015–19 file are baseline information from the SED that was collected at the time of earning the doctorate, indicators of survey eligibility and response history, and longitudinal survey weight and replicate weight variables. Summary statistics from the LSDR 2015–19 are available in a set of statistical tables (https://ncses.nsf.gov/pubs/nsf22326/), and NCSES grants licenses to securely access the restricted use microdata file (https://ncses.nsf.gov/about/licensing).
One important data limitation of the LSDR 2015–19 is that a one-week reference period each survey cycle was used to collect most of the employment data, and changes to employment status that occurred between two consecutive survey reference periods may not be accurately captured by the current survey instrument. Some of the standard longitudinal measures of employment, such as number of jobs held, length of each job held, and duration of unemployment spells, cannot be inferred accurately from the LSDR 2015–19 data. All counts of selected events and incidents, such as retirement, unemployment, and being out of the labor force, are based on data reported for the three reference periods. Similarly, the number of transitions from one status to another is based only on data associated with the survey reference periods.
References
Berg P, Hamman MK, Piszczek M, Ruhm CJ. 2020. Can Policy Facilitate Partial Retirement? Evidence from a Natural Experiment in Germany. ILR Review 73:1226–51. Available at https://doi.org/10.1177/0019793920907320.
Cahill KE, Quinn JF. 2020. The Importance of Gradual Retirement in America Today. Public Policy & Aging Report 30:107–12. Available at https://doi.org/10.1093/ppar/praa013.
Chang W-Y, Foley D; National Center for Science and Engineering Statistics (NCSES). 2017. The 2015 Survey of Doctorate Recipients Expands Its Population Coverage and Reporting on Field of Study. InfoBrief NSF 17-319. Alexandria, VA: National Science Foundation. Available at https://www.nsf.gov/statistics/2017/nsf17319/.
National Research Council. 2001. From Scarcity to Visibility: Gender Differences in the Careers of Doctoral Scientists and Engineers. Washington, DC: The National Academies Press. Available at https://doi.org/10.17226/5363.
Szinovacz ME. 2013. A multilevel perspective for retirement research. In Wang M, editor, The Oxford Handbook of Retirement, pp. 152–73. New York, NY: Oxford University Press.
Notes
1Descriptions, questionnaires, data tables, and publications of the SDR can be found at https://www.nsf.gov/statistics/srvydoctoratework/.
2The population consists of approximately 856,000 U.S.-trained research doctorate holders in science, engineering, or health (SEH) fields, who earned their doctorates before 2014 and were 65 years of age or younger in 2015.
3Description, questionnaires, data tables, and publications of the SED can be found at https://www.nsf.gov/statistics/srvydoctorates/.
4The LSDR 2015–25 panel is a large sample of 40,148 individuals selected from the SDR 2015 respondents following a stratified sample design using employment sector reported in 2015, age, indicator of underrepresented race and ethnicity minority, and sex. The LSDR 2015–25 panel represents the target population of U.S.-trained SEH doctorate holders who were 65 years old or younger as of 1 February 2015 and earned their doctorates before 1 July 2013. The LSDR 2015–19 data file includes those who responded for both or either one of the follow-up surveys in 2017 and 2019, and it consists of 36,399 doctorate holders.
5See “Data Sources, Limitations, and Availability” at the end of this report.
6The academia sector includes 4-year colleges or universities, medical schools (including university-affiliated hospitals or medical centers), and university-affiliated research institutes.
7The changes of tenure status were examined for those who were employed during all three survey reference periods and worked in academia in 2015.
Suggested Citation
Chang W-Y, Wang Y, Lynn M, Foley D; National Center for Science and Engineering Statistics (NCSES). 2022. Labor Force Transitions of U.S.-Trained Doctoral Scientists and Engineers: Findings from a New Longitudinal Panel. NSF 22-327. Alexandria, VA: National Science Foundation. Available at https://ncses.nsf.gov/pubs/nsf22327/.
Contact Us
NCSES
National Center for Science and Engineering Statistics
Directorate for Social, Behavioral and Economic Sciences
National Science Foundation
2415 Eisenhower Avenue, Suite W14200
Alexandria, VA 22314
Tel: (703) 292-8780
FIRS: (800) 877-8339
TDD: (800) 281-8749
E-mail: ncsesweb@nsf.gov