 An official website of the United States government
 Recent Trends in U.S. R&D Performance
The U.S. R&D system consists of the activities of a diverse group of R&D performers and sources of funding. Included here are private businesses, the federal government, nonfederal governments, higher education institutions, and nonprofit organizations. The organizations that perform R&D often receive significant levels of outside funding, and organizations that fund R&D may also themselves be performers.
The principal sources of data for the indicators and analyses discussed in this section come from annual surveys of the R&D expenditures of these major performers and funders, conducted by the National Center for Science and Engineering Statistics (NCSES) within the National Science Foundation (NSF). A Technical Appendix to this report provides an overview of these surveys and the methods involved in collecting, compiling, and analyzing the data.
Current Trends in U.S. Total R&D and R&D Intensity
U.S. Total R&D
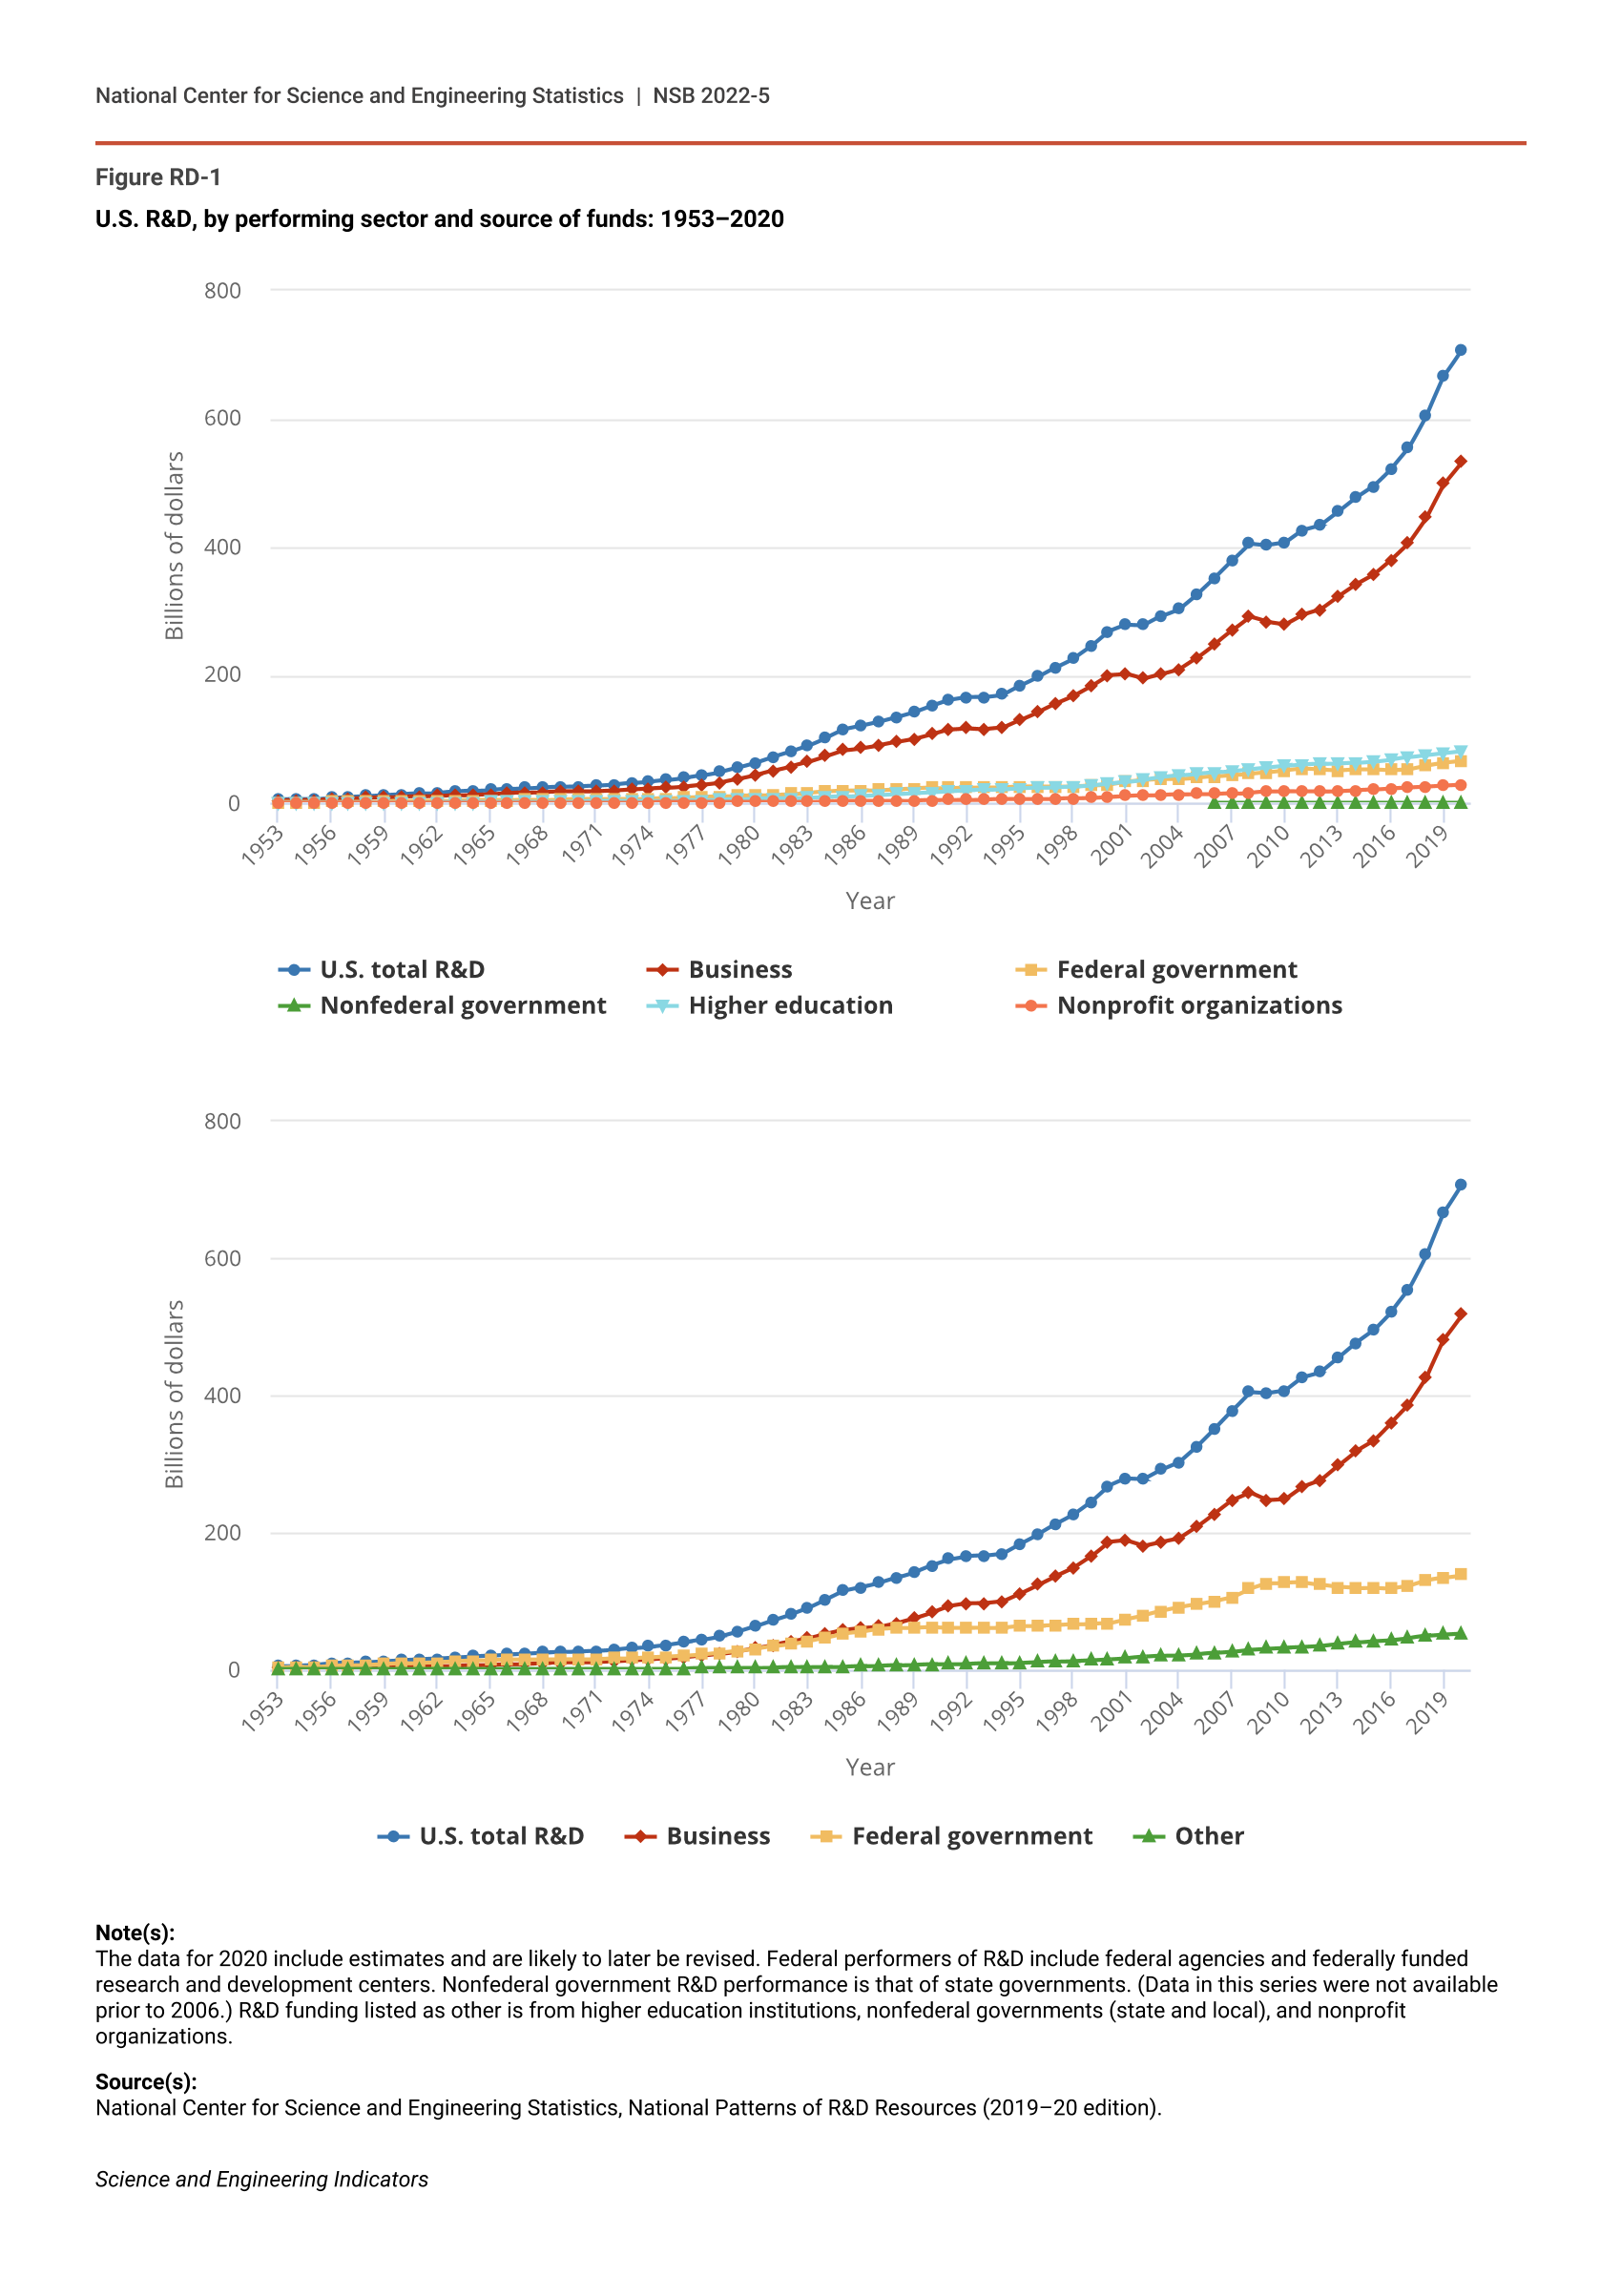
Research and experimental development (R&D) performed in the United States totaled $666.9 billion in 2019 (Figure RD-1; Table RD-1). The estimated total for 2020, based on performer-reported expectations, is $708.0 billion. These numbers compare with U.S. R&D totals of $494.5 billion in 2015 and $406.6 billion in 2010. (All amounts and calculations are reported in current dollars, unless otherwise noted.)
U.S. R&D, by performing sector and source of funds: 1953–2020
| Year | U.S. total R&D | Business | Federal government | Nonfederal government | Higher education | Nonprofit organizations |
|---|---|---|---|---|---|---|
| 1953 | 5.2 | 3.6 | 1.1 | NA | 0.3 | 0.1 |
| 1954 | 5.6 | 4.1 | 1.1 | NA | 0.3 | 0.1 |
| 1955 | 6.2 | 4.4 | 1.3 | NA | 0.3 | 0.1 |
| 1956 | 8.5 | 6.3 | 1.7 | NA | 0.4 | 0.1 |
| 1957 | 9.9 | 7.3 | 2.0 | NA | 0.4 | 0.2 |
| 1958 | 10.9 | 8.1 | 2.2 | NA | 0.5 | 0.2 |
| 1959 | 12.5 | 9.2 | 2.5 | NA | 0.6 | 0.2 |
| 1960 | 13.7 | 10.0 | 2.7 | NA | 0.7 | 0.3 |
| 1961 | 14.6 | 10.4 | 3.1 | NA | 0.8 | 0.3 |
| 1962 | 15.6 | 11.0 | 3.2 | NA | 1.0 | 0.4 |
| 1963 | 17.5 | 12.2 | 3.7 | NA | 1.2 | 0.4 |
| 1964 | 19.1 | 13.0 | 4.3 | NA | 1.4 | 0.4 |
| 1965 | 20.3 | 13.8 | 4.4 | NA | 1.6 | 0.5 |
| 1966 | 22.1 | 15.2 | 4.5 | NA | 1.8 | 0.5 |
| 1967 | 23.3 | 16.0 | 4.8 | NA | 2.0 | 0.6 |
| 1968 | 24.7 | 17.0 | 4.9 | NA | 2.2 | 0.6 |
| 1969 | 26.0 | 17.8 | 5.2 | NA | 2.3 | 0.6 |
| 1970 | 26.3 | 17.6 | 5.6 | NA | 2.4 | 0.7 |
| 1971 | 27.0 | 17.8 | 5.8 | NA | 2.6 | 0.7 |
| 1972 | 28.7 | 19.0 | 6.2 | NA | 2.8 | 0.8 |
| 1973 | 31.0 | 20.7 | 6.4 | NA | 3.0 | 0.9 |
| 1974 | 33.4 | 22.2 | 6.9 | NA | 3.2 | 1.0 |
| 1975 | 35.7 | 23.5 | 7.6 | NA | 3.6 | 1.1 |
| 1976 | 39.4 | 26.1 | 8.3 | NA | 3.9 | 1.1 |
| 1977 | 43.3 | 28.9 | 8.9 | NA | 4.3 | 1.2 |
| 1978 | 48.7 | 32.2 | 10.1 | NA | 5.0 | 1.4 |
| 1979 | 55.4 | 37.1 | 11.0 | NA | 5.7 | 1.6 |
| 1980 | 63.2 | 43.2 | 11.9 | NA | 6.5 | 1.7 |
| 1981 | 72.3 | 50.4 | 13.0 | NA | 7.1 | 1.8 |
| 1982 | 80.7 | 57.2 | 14.1 | NA | 7.6 | 1.9 |
| 1983 | 89.9 | 63.7 | 15.8 | NA | 8.3 | 2.2 |
| 1984 | 102.2 | 73.1 | 17.5 | NA | 9.2 | 2.5 |
| 1985 | 114.7 | 82.4 | 19.2 | NA | 10.3 | 2.8 |
| 1986 | 120.2 | 85.9 | 19.9 | NA | 11.5 | 2.9 |
| 1987 | 126.4 | 90.2 | 20.4 | NA | 12.8 | 3.0 |
| 1988 | 133.9 | 94.9 | 21.6 | NA | 14.2 | 3.2 |
| 1989 | 141.9 | 99.9 | 22.7 | NA | 15.6 | 3.7 |
| 1990 | 152.0 | 107.4 | 23.5 | NA | 16.9 | 4.1 |
| 1991 | 160.9 | 114.7 | 23.3 | NA | 18.2 | 4.7 |
| 1992 | 165.4 | 116.8 | 24.2 | NA | 19.4 | 5.0 |
| 1993 | 165.7 | 115.4 | 24.5 | NA | 20.5 | 5.3 |
| 1994 | 169.2 | 117.4 | 24.6 | NA | 21.6 | 5.6 |
| 1995 | 183.6 | 129.8 | 25.4 | NA | 22.6 | 5.8 |
| 1996 | 197.3 | 142.4 | 25.0 | NA | 23.7 | 6.2 |
| 1997 | 211.9 | 155.4 | 25.2 | NA | 24.6 | 6.6 |
| 1998 | 225.8 | 167.1 | 25.8 | NA | 25.6 | 7.2 |
| 1999 | 244.5 | 182.1 | 26.8 | NA | 27.5 | 8.0 |
| 2000 | 267.9 | 200.0 | 28.5 | NA | 29.9 | 9.6 |
| 2001 | 278.5 | 202.0 | 32.8 | NA | 32.7 | 11.0 |
| 2002 | 277.9 | 193.9 | 35.5 | NA | 36.7 | 11.9 |
| 2003 | 291.4 | 200.7 | 37.2 | NA | 40.6 | 12.8 |
| 2004 | 302.7 | 208.3 | 37.7 | NA | 43.3 | 13.4 |
| 2005 | 325.3 | 226.2 | 39.6 | NA | 45.5 | 14.1 |
| 2006 | 350.9 | 247.7 | 41.6 | 0.3 | 47.4 | 14.0 |
| 2007 | 377.9 | 269.3 | 44.1 | 0.4 | 49.4 | 14.7 |
| 2008 | 404.8 | 290.7 | 45.6 | 0.5 | 52.1 | 15.9 |
| 2009 | 402.9 | 282.4 | 47.6 | 0.6 | 54.9 | 17.5 |
| 2010 | 406.6 | 279.0 | 50.8 | 0.7 | 58.1 | 18.0 |
| 2011 | 426.2 | 294.1 | 53.5 | 0.7 | 60.1 | 17.8 |
| 2012 | 433.7 | 302.3 | 52.1 | 0.7 | 60.9 | 17.8 |
| 2013 | 454.3 | 322.5 | 51.1 | 0.6 | 61.5 | 18.5 |
| 2014 | 476.0 | 340.7 | 52.7 | 0.6 | 62.4 | 19.6 |
| 2015 | 494.5 | 355.8 | 52.8 | 0.6 | 64.6 | 20.6 |
| 2016 | 521.7 | 379.5 | 51.2 | 0.6 | 67.8 | 22.6 |
| 2017 | 554.0 | 405.8 | 52.6 | 0.6 | 71.1 | 23.9 |
| 2018 | 604.8 | 445.6 | 58.4 | 0.6 | 74.9 | 25.4 |
| 2019 | 666.9 | 498.2 | 62.8 | 0.7 | 78.2 | 27.0 |
| 2020 | 708.0 | 531.9 | 65.7 | 0.7 | 81.1 | 28.5 |
| Year | U.S. total R&D | Business | Federal government | Other |
|---|---|---|---|---|
| 1953 | 5.2 | 2.2 | 2.8 | 0.1 |
| 1954 | 5.6 | 2.4 | 3.1 | 0.1 |
| 1955 | 6.2 | 2.5 | 3.5 | 0.2 |
| 1956 | 8.5 | 3.3 | 5.0 | 0.2 |
| 1957 | 9.9 | 3.5 | 6.2 | 0.2 |
| 1958 | 10.9 | 3.7 | 7.0 | 0.2 |
| 1959 | 12.5 | 4.1 | 8.2 | 0.3 |
| 1960 | 13.7 | 4.5 | 8.9 | 0.3 |
| 1961 | 14.6 | 4.8 | 9.5 | 0.3 |
| 1962 | 15.6 | 5.1 | 10.1 | 0.4 |
| 1963 | 17.5 | 5.5 | 11.6 | 0.4 |
| 1964 | 19.1 | 5.9 | 12.8 | 0.5 |
| 1965 | 20.3 | 6.5 | 13.2 | 0.5 |
| 1966 | 22.1 | 7.3 | 14.2 | 0.6 |
| 1967 | 23.3 | 8.1 | 14.6 | 0.6 |
| 1968 | 24.7 | 9.0 | 15.0 | 0.7 |
| 1969 | 26.0 | 10.0 | 15.2 | 0.8 |
| 1970 | 26.3 | 10.4 | 15.0 | 0.8 |
| 1971 | 27.0 | 10.8 | 15.2 | 0.9 |
| 1972 | 28.7 | 11.7 | 16.0 | 1.0 |
| 1973 | 31.0 | 13.3 | 16.6 | 1.1 |
| 1974 | 33.4 | 14.9 | 17.3 | 1.2 |
| 1975 | 35.7 | 15.8 | 18.5 | 1.3 |
| 1976 | 39.4 | 17.7 | 20.3 | 1.4 |
| 1977 | 43.3 | 19.6 | 22.1 | 1.6 |
| 1978 | 48.7 | 22.5 | 24.4 | 1.8 |
| 1979 | 55.4 | 26.1 | 27.2 | 2.1 |
| 1980 | 63.2 | 30.9 | 30.0 | 2.3 |
| 1981 | 72.3 | 35.9 | 33.7 | 2.6 |
| 1982 | 80.7 | 40.7 | 37.1 | 2.9 |
| 1983 | 89.9 | 45.3 | 41.5 | 3.2 |
| 1984 | 102.2 | 52.2 | 46.5 | 3.6 |
| 1985 | 114.7 | 58.0 | 52.6 | 4.1 |
| 1986 | 120.2 | 61.0 | 54.6 | 4.6 |
| 1987 | 126.4 | 62.6 | 58.6 | 5.2 |
| 1988 | 133.9 | 68.0 | 60.1 | 5.8 |
| 1989 | 141.9 | 75.0 | 60.5 | 6.5 |
| 1990 | 152.0 | 83.2 | 61.6 | 7.2 |
| 1991 | 160.9 | 92.3 | 60.8 | 7.8 |
| 1992 | 165.4 | 96.2 | 60.9 | 8.2 |
| 1993 | 165.7 | 96.5 | 60.5 | 8.7 |
| 1994 | 169.2 | 99.2 | 60.8 | 9.2 |
| 1995 | 183.6 | 110.9 | 63.0 | 9.8 |
| 1996 | 197.3 | 123.4 | 63.4 | 10.5 |
| 1997 | 211.9 | 136.2 | 64.4 | 11.3 |
| 1998 | 225.8 | 147.8 | 65.9 | 12.1 |
| 1999 | 244.5 | 164.5 | 66.8 | 13.1 |
| 2000 | 267.9 | 186.0 | 67.2 | 14.7 |
| 2001 | 278.5 | 188.4 | 73.8 | 16.3 |
| 2002 | 277.9 | 180.7 | 78.9 | 18.3 |
| 2003 | 291.4 | 186.2 | 85.1 | 20.1 |
| 2004 | 302.7 | 191.3 | 90.8 | 20.6 |
| 2005 | 325.3 | 207.8 | 95.4 | 22.1 |
| 2006 | 350.9 | 227.2 | 99.9 | 23.8 |
| 2007 | 377.9 | 246.8 | 105.1 | 25.9 |
| 2008 | 404.8 | 258.0 | 117.6 | 29.1 |
| 2009 | 402.9 | 246.6 | 125.8 | 30.6 |
| 2010 | 406.6 | 248.1 | 126.6 | 31.9 |
| 2011 | 426.2 | 266.4 | 127.0 | 32.8 |
| 2012 | 433.7 | 275.7 | 123.8 | 34.2 |
| 2013 | 454.3 | 297.2 | 120.1 | 37.0 |
| 2014 | 476.0 | 318.4 | 118.4 | 39.2 |
| 2015 | 494.5 | 333.2 | 119.5 | 41.7 |
| 2016 | 521.7 | 360.3 | 118.2 | 43.2 |
| 2017 | 554.0 | 386.4 | 121.6 | 46.0 |
| 2018 | 604.8 | 426.2 | 129.6 | 49.0 |
| 2019 | 666.9 | 481.8 | 133.8 | 51.3 |
| 2020 | 708.0 | 517.4 | 137.8 | 52.7 |
Note(s):
The data for 2020 include estimates and are likely to later be revised. Federal performers of R&D include federal agencies and federally funded research and development centers. Nonfederal government R&D performance is that of state governments. (Data in this series were not available prior to 2006.) R&D funding listed as other is from higher education institutions, nonfederal governments (state and local), and nonprofit organizations.
Source(s):
National Center for Science and Engineering Statistics, National Patterns of R&D Resources (2019–20 edition).
Science and Engineering Indicators
U.S. R&D expenditures, by performing sector and source of funds: 2010–20
FFRDC = federally funded research and development center.
a The data for 2020 are estimates and are likely later to be revised.
b Includes expenditures of federal intramural R&D as well as costs associated with administering extramural R&D procurements.
c Some components of the R&D performed by nonprofit organizations are estimated and may later be revised.
Note(s):
Data are based on annual reports by performers, except for the nonprofit sector. Expenditure levels for higher education, federal government, and nonfederal government performers are calendar year approximations based on fiscal year data.
Source(s):
National Center for Science and Engineering Statistics, National Patterns of R&D Resources (2019–20 edition).
Science and Engineering Indicators
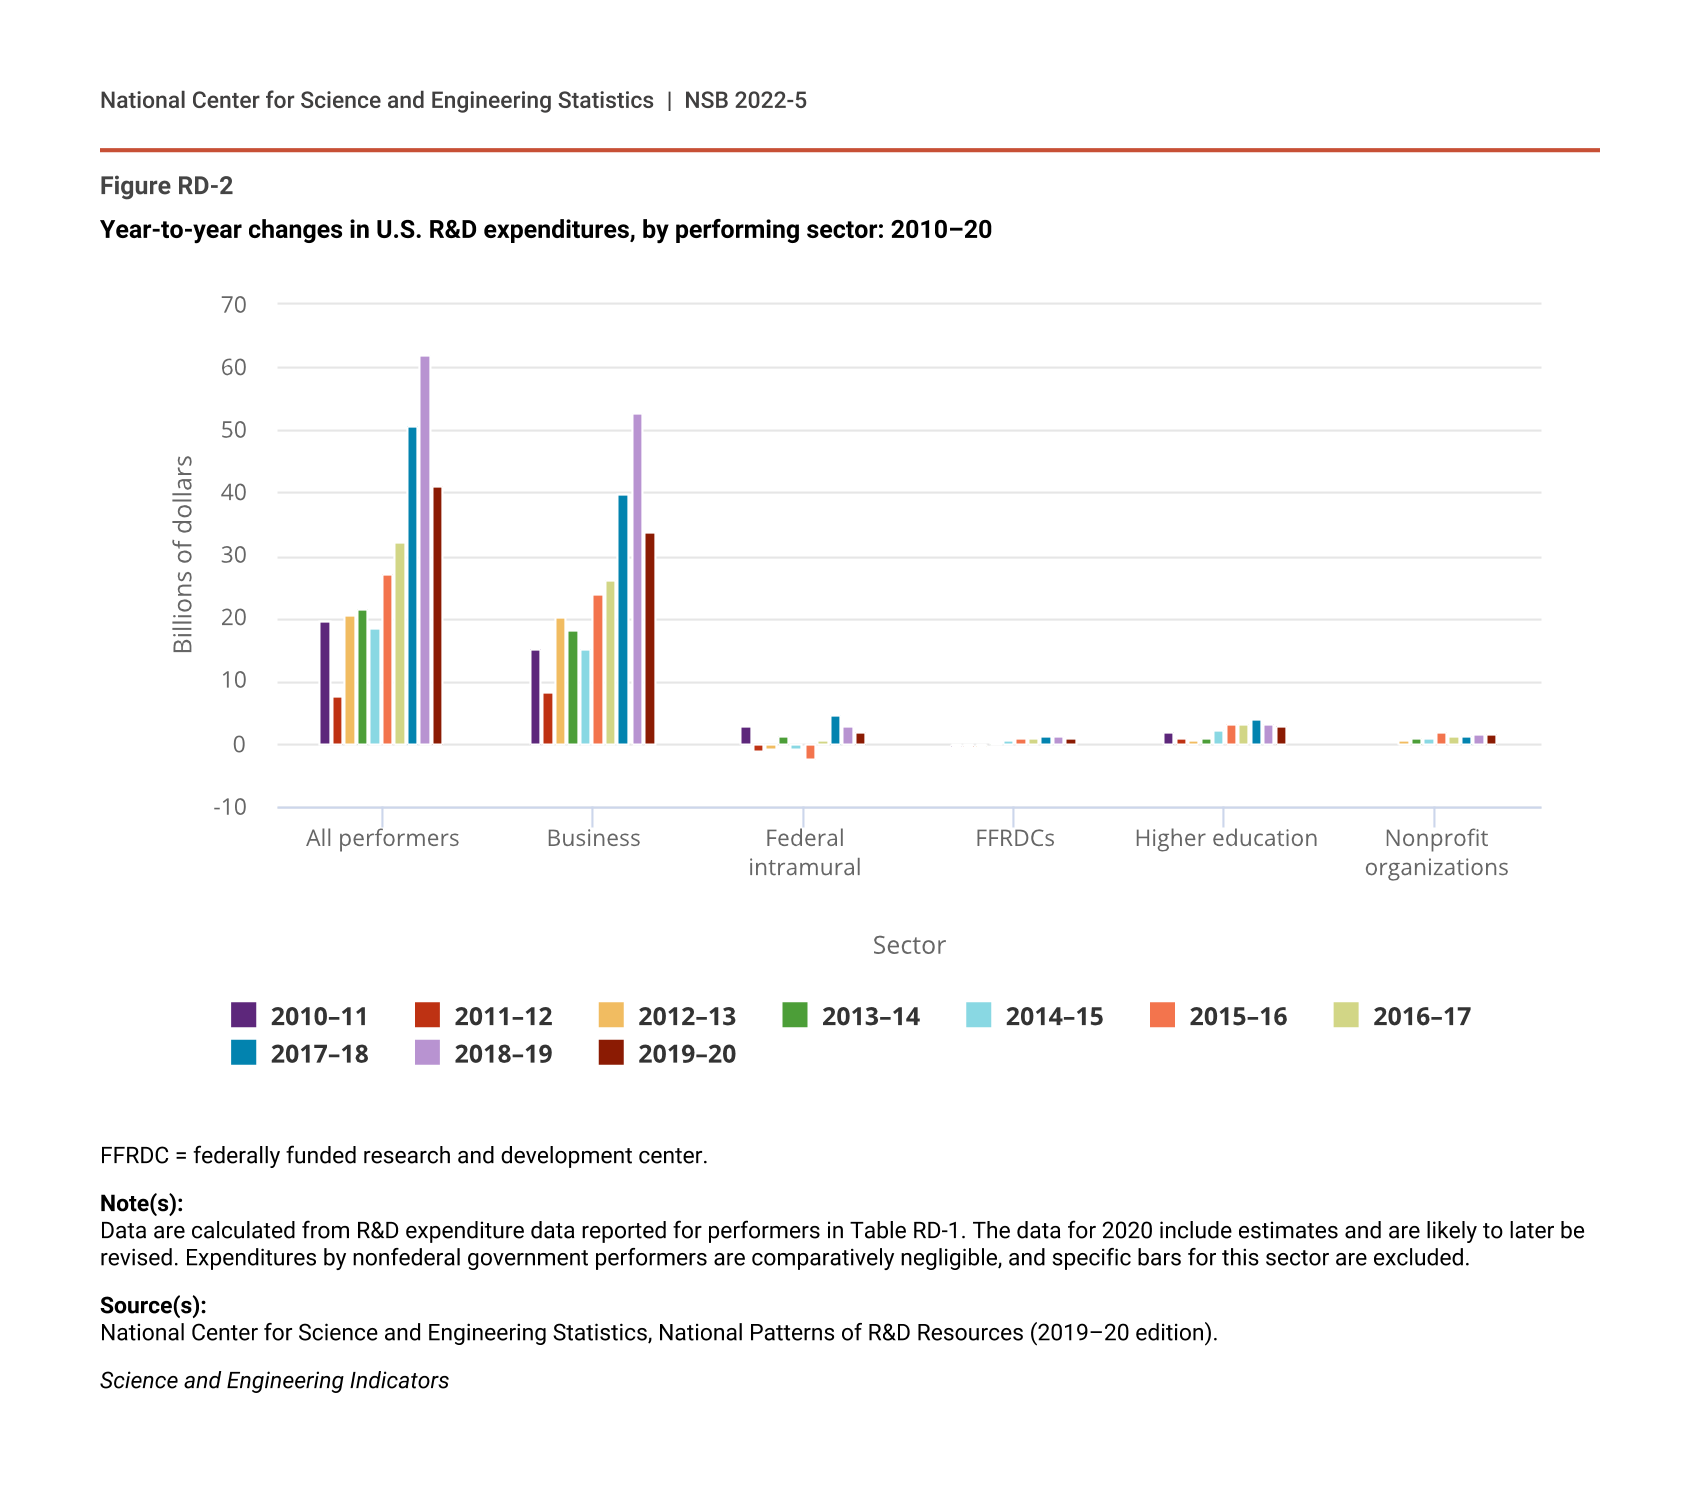
Year-over-year increases in the total of U.S. R&D expenditures averaged $19.2 billion over the 2010–16 period (calculated from the data in Table RD-1). This level of annual increase was, in general, a sufficient pace to remain well ahead of the rate of expansion of the nation’s gross domestic product (GDP) (Table RD-2). Nonetheless, an even stronger pace of R&D increase has emerged in the years since. The U.S. R&D total in 2017 was $32.3 billion ahead of the previous year; $50.8 billion in 2018; and $62.0 billion in 2019—and, as presently estimated, $41.1 billion in 2020 (Figure RD-2). This pattern of sustained annual increase in the U.S. total R&D since 2010 has been due mainly to consistently higher levels of business R&D performance, which have been near 80% or more of the total annual increases since 2010 (Figure RD-2).
Annual rates of change in U.S. R&D expenditures, by performing sector: 1990–2020
NA = not available.
FFRDC = federally funded research and development center.
a The R&D data for 2020 include estimates and are likely to be later revised.
b Survey data on state intramural R&D performance were not available prior to 2006.
c Some components of the R&D performed by nonprofit organizations are estimated and may later be revised.
Note(s):
The longer-term trend rates are calculated as compound annual growth rates.
Source(s):
National Center for Science and Engineering Statistics, National Patterns of R&D Resources (2019–20 edition).
Science and Engineering Indicators
Year-to-year changes in U.S. R&D expenditures, by performing sector: 2010–20
| Sector | 2010–11 | 2011–12 | 2012–13 | 2013–14 | 2014–15 | 2015–16 | 2016–17 | 2017–18 | 2018–19 | 2019–20 |
|---|---|---|---|---|---|---|---|---|---|---|
| All performers | 19.6 | 7.5 | 20.6 | 21.7 | 18.5 | 27.2 | 32.3 | 50.8 | 62.0 | 41.1 |
| Business | 15.1 | 8.2 | 20.3 | 18.2 | 15.1 | 23.7 | 26.3 | 39.8 | 52.6 | 33.8 |
| Federal intramural | 3.0 | -0.9 | -0.6 | 1.4 | -0.6 | -2.4 | 0.5 | 4.6 | 3.1 | 2.1 |
| FFRDCs | -0.3 | -0.4 | -0.4 | 0.2 | 0.7 | 0.8 | 0.9 | 1.2 | 1.4 | 0.8 |
| Higher education | 2.0 | 0.8 | 0.7 | 0.8 | 2.3 | 3.2 | 3.3 | 3.8 | 3.3 | 2.9 |
| Nonprofit organizations | -0.2 | -0.1 | 0.7 | 1.1 | 1.0 | 2.0 | 1.3 | 1.4 | 1.7 | 1.5 |
FFRDC = federally funded research and development center.
Note(s):
Data are calculated from R&D expenditure data reported for performers in Table RD-1. The data for 2020 include estimates and are likely to later be revised. Expenditures by nonfederal government performers are comparatively negligible, and specific bars for this sector are excluded.
Source(s):
National Center for Science and Engineering Statistics, National Patterns of R&D Resources (2019–20 edition).
Science and Engineering Indicators
Adjusting for inflation, growth in U.S. total R&D averaged 3.8% annually over the 2010–19 period, well above the 2.2% average growth of U.S. gross domestic product (GDP) over the same period (Table RD-2). The average annual growth of U.S. total R&D in the prior decade (2000–10) was lower at 2.1%, compared to 1.8% rate of GDP expansion. The estimate for 2020 shows R&D growing at 4.9%, compared to a 3.4% decline in GDP.
U.S. National R&D Intensity
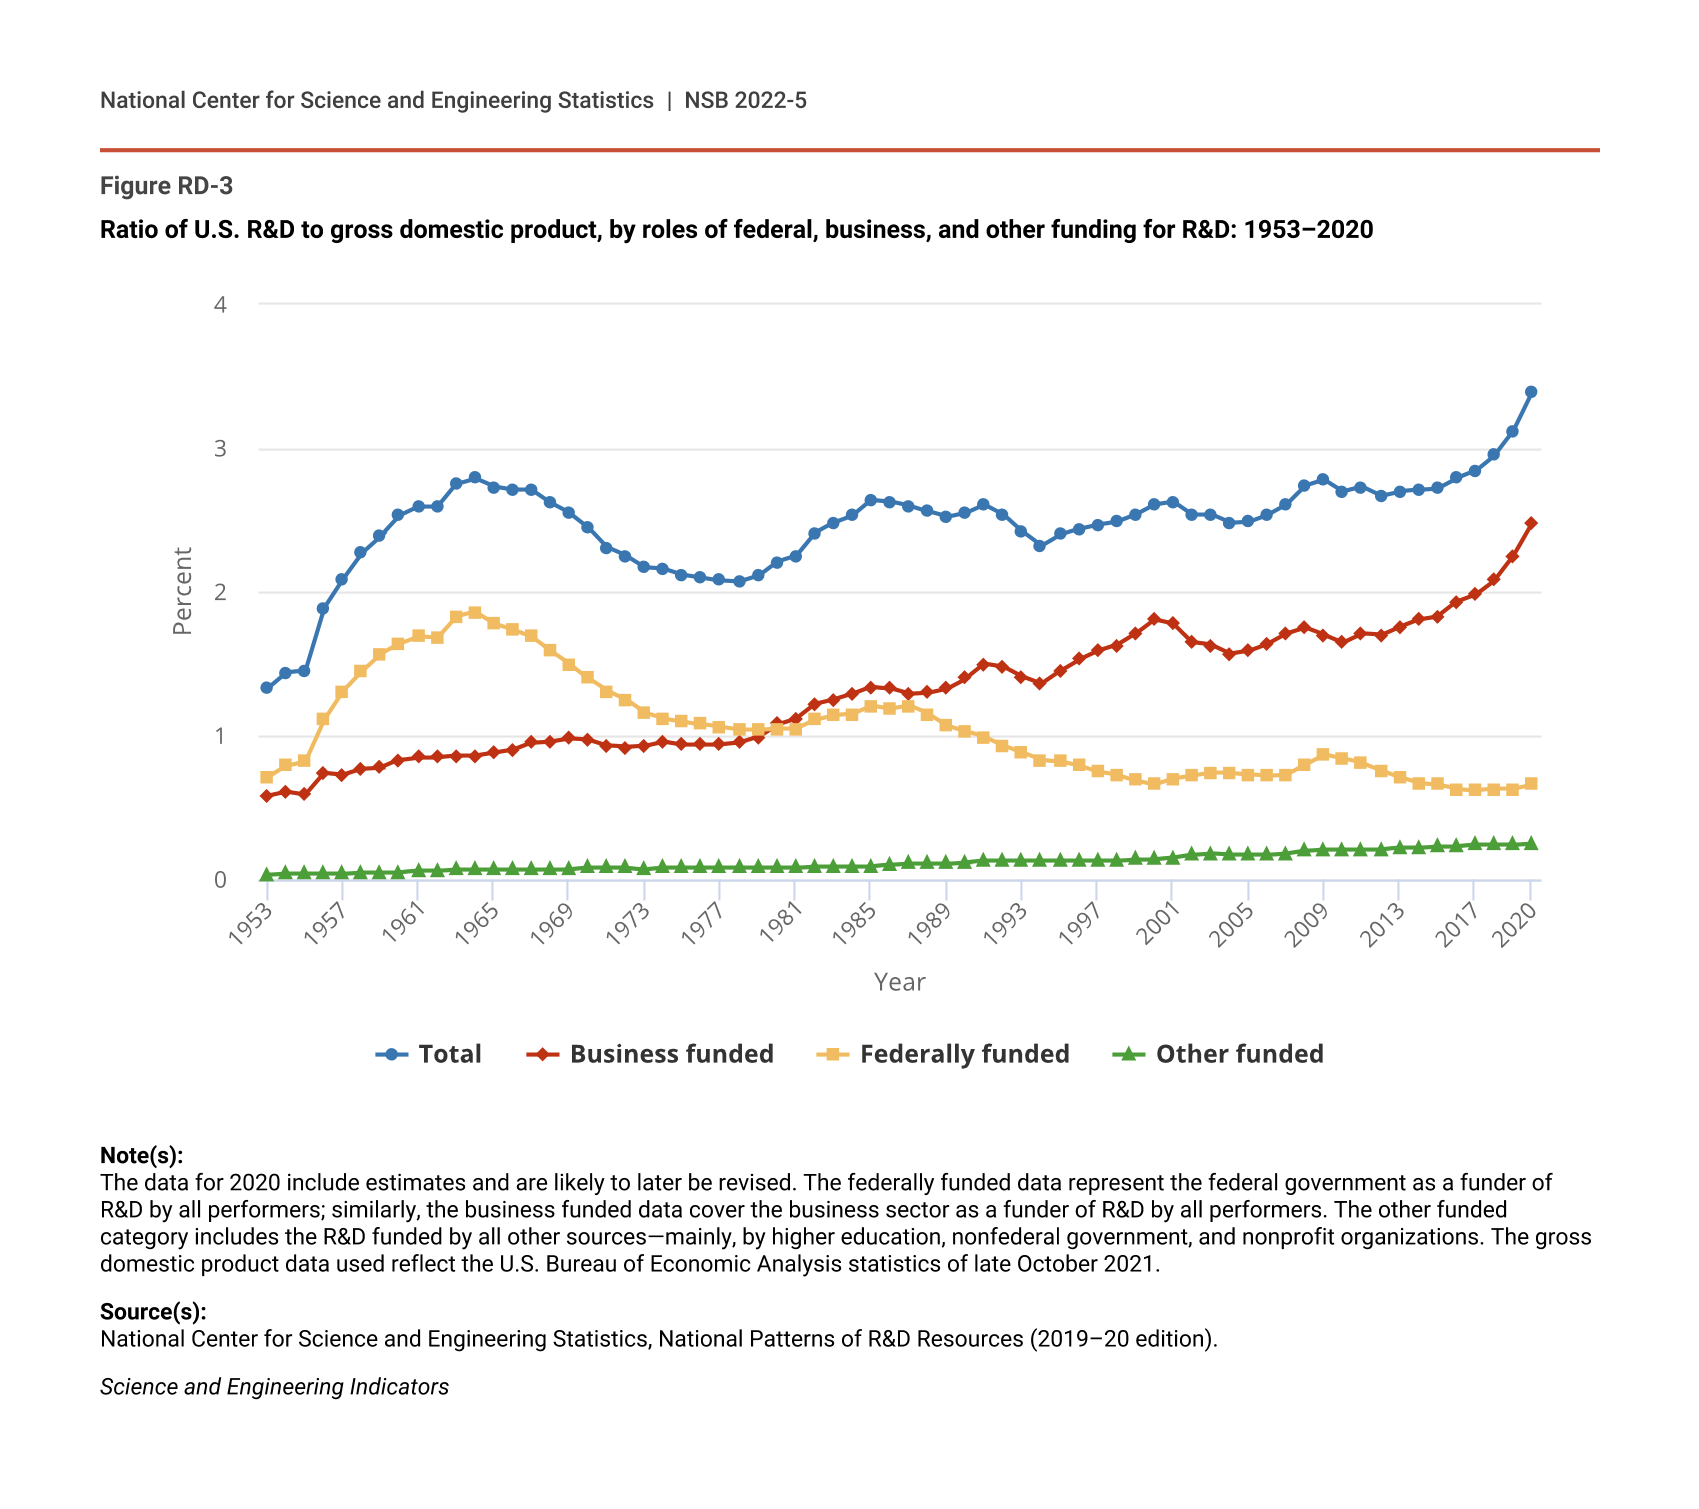
The ratio of total national R&D expenditures to GDP is widely used by national statistical offices and policy analysts as an overall gauge of the intensity of a nation’s R&D effort. In this new edition of the data, the ratio of U.S. R&D to GDP was 3.12% in 2019, and it is estimated to be 3.39% in 2020.
The U.S. ratio generally has been rising since the mid-1990s, although with some periods of decline (Figure RD-3). The highest U.S. ratios recorded in the past have been 2.79% in 1964, 2.78% in 2009, 2.79% again in 2016, 2.84% in 2017, and 2.95% in 2018. Reaching an R&D intensity level above 3.0% is widely regarded in the R&D policy community as a notable national achievement. Some further maturity in the data is warranted in interpreting the reported 3.39% for 2020—both due to its estimated nature and the fact that the sizable uptick from 2019 reflects both a rising R&D level but also a declining GDP.
Ratio of U.S. R&D to gross domestic product, by roles of federal, business, and other funding for R&D: 1953–2020
| Year | Total | Business funded | Federally funded | Other funded |
|---|---|---|---|---|
| 1953 | 1.33 | 0.58 | 0.71 | 0.03 |
| 1954 | 1.44 | 0.61 | 0.79 | 0.04 |
| 1955 | 1.45 | 0.59 | 0.82 | 0.04 |
| 1956 | 1.89 | 0.74 | 1.11 | 0.04 |
| 1957 | 2.09 | 0.73 | 1.31 | 0.04 |
| 1958 | 2.27 | 0.77 | 1.45 | 0.05 |
| 1959 | 2.39 | 0.78 | 1.57 | 0.05 |
| 1960 | 2.53 | 0.83 | 1.64 | 0.05 |
| 1961 | 2.59 | 0.85 | 1.69 | 0.06 |
| 1962 | 2.59 | 0.85 | 1.68 | 0.06 |
| 1963 | 2.75 | 0.86 | 1.83 | 0.07 |
| 1964 | 2.79 | 0.86 | 1.86 | 0.07 |
| 1965 | 2.73 | 0.88 | 1.78 | 0.07 |
| 1966 | 2.71 | 0.90 | 1.74 | 0.07 |
| 1967 | 2.71 | 0.95 | 1.69 | 0.07 |
| 1968 | 2.62 | 0.96 | 1.59 | 0.07 |
| 1969 | 2.55 | 0.98 | 1.50 | 0.07 |
| 1970 | 2.45 | 0.97 | 1.40 | 0.08 |
| 1971 | 2.31 | 0.93 | 1.31 | 0.08 |
| 1972 | 2.25 | 0.92 | 1.25 | 0.08 |
| 1973 | 2.17 | 0.93 | 1.16 | 0.07 |
| 1974 | 2.16 | 0.96 | 1.12 | 0.08 |
| 1975 | 2.12 | 0.94 | 1.10 | 0.08 |
| 1976 | 2.10 | 0.94 | 1.08 | 0.08 |
| 1977 | 2.08 | 0.94 | 1.06 | 0.08 |
| 1978 | 2.07 | 0.95 | 1.04 | 0.08 |
| 1979 | 2.11 | 0.99 | 1.04 | 0.08 |
| 1980 | 2.21 | 1.08 | 1.05 | 0.08 |
| 1981 | 2.25 | 1.12 | 1.05 | 0.08 |
| 1982 | 2.41 | 1.22 | 1.11 | 0.09 |
| 1983 | 2.48 | 1.25 | 1.14 | 0.09 |
| 1984 | 2.53 | 1.29 | 1.15 | 0.09 |
| 1985 | 2.64 | 1.34 | 1.21 | 0.09 |
| 1986 | 2.63 | 1.33 | 1.19 | 0.10 |
| 1987 | 2.60 | 1.29 | 1.21 | 0.11 |
| 1988 | 2.56 | 1.30 | 1.15 | 0.11 |
| 1989 | 2.52 | 1.33 | 1.07 | 0.11 |
| 1990 | 2.55 | 1.40 | 1.03 | 0.12 |
| 1991 | 2.61 | 1.50 | 0.99 | 0.13 |
| 1992 | 2.54 | 1.48 | 0.93 | 0.13 |
| 1993 | 2.42 | 1.41 | 0.88 | 0.13 |
| 1994 | 2.32 | 1.36 | 0.83 | 0.13 |
| 1995 | 2.40 | 1.45 | 0.82 | 0.13 |
| 1996 | 2.44 | 1.53 | 0.79 | 0.13 |
| 1997 | 2.47 | 1.59 | 0.75 | 0.13 |
| 1998 | 2.49 | 1.63 | 0.73 | 0.13 |
| 1999 | 2.54 | 1.71 | 0.69 | 0.14 |
| 2000 | 2.61 | 1.81 | 0.66 | 0.14 |
| 2001 | 2.63 | 1.78 | 0.70 | 0.15 |
| 2002 | 2.54 | 1.65 | 0.72 | 0.17 |
| 2003 | 2.54 | 1.63 | 0.74 | 0.18 |
| 2004 | 2.48 | 1.57 | 0.74 | 0.17 |
| 2005 | 2.49 | 1.59 | 0.73 | 0.17 |
| 2006 | 2.54 | 1.64 | 0.72 | 0.17 |
| 2007 | 2.61 | 1.71 | 0.73 | 0.18 |
| 2008 | 2.74 | 1.75 | 0.80 | 0.20 |
| 2009 | 2.78 | 1.70 | 0.87 | 0.21 |
| 2010 | 2.70 | 1.65 | 0.84 | 0.21 |
| 2011 | 2.73 | 1.71 | 0.81 | 0.21 |
| 2012 | 2.67 | 1.70 | 0.76 | 0.21 |
| 2013 | 2.70 | 1.76 | 0.71 | 0.22 |
| 2014 | 2.71 | 1.81 | 0.67 | 0.22 |
| 2015 | 2.72 | 1.83 | 0.66 | 0.23 |
| 2016 | 2.79 | 1.93 | 0.63 | 0.23 |
| 2017 | 2.84 | 1.98 | 0.62 | 0.24 |
| 2018 | 2.95 | 2.08 | 0.63 | 0.24 |
| 2019 | 3.12 | 2.25 | 0.63 | 0.24 |
| 2020 | 3.39 | 2.48 | 0.66 | 0.25 |
Note(s):
The data for 2020 include estimates and are likely to later be revised. The federally funded data represent the federal government as a funder of R&D by all performers; similarly, the business funded data cover the business sector as a funder of R&D by all performers. The other funded category includes the R&D funded by all other sources—mainly, by higher education, nonfederal government, and nonprofit organizations. The gross domestic product data used reflect the U.S. Bureau of Economic Analysis statistics of late October 2021.
Source(s):
National Center for Science and Engineering Statistics, National Patterns of R&D Resources (2019–20 edition).
Science and Engineering Indicators
Most of the rise in the R&D-to-GDP ratio over the past several decades has been the result of the increase in nonfederal spending on R&D, particularly by the business sector. This arises largely from the growing role of business R&D in the national R&D system, which in turn reflects the increase of R&D-dependent goods and services in the national and global economies. By contrast, the share of federally funded R&D expenditures declined from the mid-1980s to the late 1990s, notably from cuts in defense-related R&D. This was followed by a gradual uptick through 2009, driven by increased federal spending on biomedical and national security R&D and the one-time incremental funding for R&D provided by the American Recovery and Reinvestment Act of 2009 (ARRA). The federally funded share, however, has returned to a path of mainly decline since 2010 (Figure RD-3).
Performers of R&D
Business Sector
The business sector is by far the largest performer of U.S. R&D. In 2019, domestically performed business R&D accounted for $498.2 billion, or 75% of the $666.9 billion national R&D total (Table RD-1 and Table RD-3). The business sector’s status as the predominant player in national R&D performance has long been the case, with its annual share ranging between 69% and 75% over the two-decade period of 2000–19 (Figure RD-1).
U.S. R&D expenditures, by performing sector, source of funds, and type of R&D: 2019
* = amount < $0.5 million; ** = small to negligible amount, included as part of the funding provided by nonprofit organizations; *** = small to negligible amount, included as part of the funding provided by other sectors.
FFRDC = federally funded research and development center.
Note(s):
Some components of R&D performance and funding by nonprofit organizations are estimated and may later be revised.
Source(s):
National Center for Science and Engineering Statistics, National Patterns of R&D Resources (2019–20 edition).
Science and Engineering Indicators
Adjusted for inflation, growth in business R&D averaged 4.8% annually over the period 2010–19, well ahead of the 3.8% annual average for U.S. total R&D and the 2.2% annual average for GDP (Table RD-2).
Higher Education
R&D performed in the United States by the higher education sector totaled $78.2 billion in 2019, or 12% of U.S. total R&D (Table RD-1 and Table RD-3). Over the period 2000–19, the higher education share of U.S. R&D has ranged between 11% and 14%.
Adjusted for inflation, growth in this sector’s R&D performance averaged 1.6% annually over 2010–19, well behind both U.S. total R&D (3.8%) and GDP (2.2%) (Table RD-2). The year-by-year trajectory in higher education R&D expenditures has been marked by contrasts: relatively low growth in 2010 and 2011, a noticeable slowdown in 2012–14, and then higher but still comparatively modest rates (similar to those for GDP) in 2015–19.
Federal Agencies and Federally Funded Research and Development Centers
The federal government performed $62.8 billion, or 9% of U.S. R&D in 2019 (Table RD-1 and Table RD-3). This included $39.9 billion (6% of the U.S. total) performed by the intramural R&D facilities of federal agencies and $22.9 billion (3%) of R&D performed by the 42 federally funded research and development centers (FFRDCs). The federal share of U.S. R&D performance rose from about 11% in 2000 to 12% in 2010 but has declined since then, down to about 9% in 2019.
Adjusted for inflation, this sector’s R&D performance over 2010–19 has increased at an annual rate of 0.6%—in contrast to the 3.8% rate for total U.S. R&D and 2.2% for GDP (Table RD-2). In the previous decade (2000–10), federal R&D performance grew an average of 3.8% yearly, well ahead of U.S. total R&D (2.1%). However, the year-over-year changes for 2010–19 are a varied picture, with outright declines or low growth rates for 2012–17 but a turn to markedly higher rates of increase in 2018–19. Part of this history reflects the waning after 2010 of the incremental funding from ARRA and the more challenging environment for federal budget support after 2011; in 2018 and 2019, the results of lengthy congressional debates on federal spending resulted in substantial increases to federal funding for R&D.
State Government
State agency intramural R&D performance in 2019 totaled $675 million—a small share (about 0.1%) of the U.S. total (Table RD-1 and Table RD-3). This includes all 50 states and the District of Columbia.
Nonprofit Organizations
R&D performed in the United States by nonprofit organizations (excluding higher education institutions, the federal government, and nonfederal governments) was an estimated $27.0 billion in 2019 (Table RD-1 and Table RD-3). This was 4% of U.S. total R&D, a share that has changed little since the early 2000s.
Sources of R&D Funding
R&D Funding by Business
Matching its predominant role in R&D performance, the business sector is also the leading source of funding for R&D performed in the United States. In 2019, business sector’s funding accounted for $481.8 billion, or 72% of the total U.S. R&D performance (Table RD-3). Nearly all (98%) of the business sector’s funding for R&D that year supported business R&D performance—whether performed by the company itself or in support of the R&D performed by other companies. Most of the remainder went to R&D performers in higher education and nonprofit organizations, along with small amounts to FFRDCs and nonfederal governments.
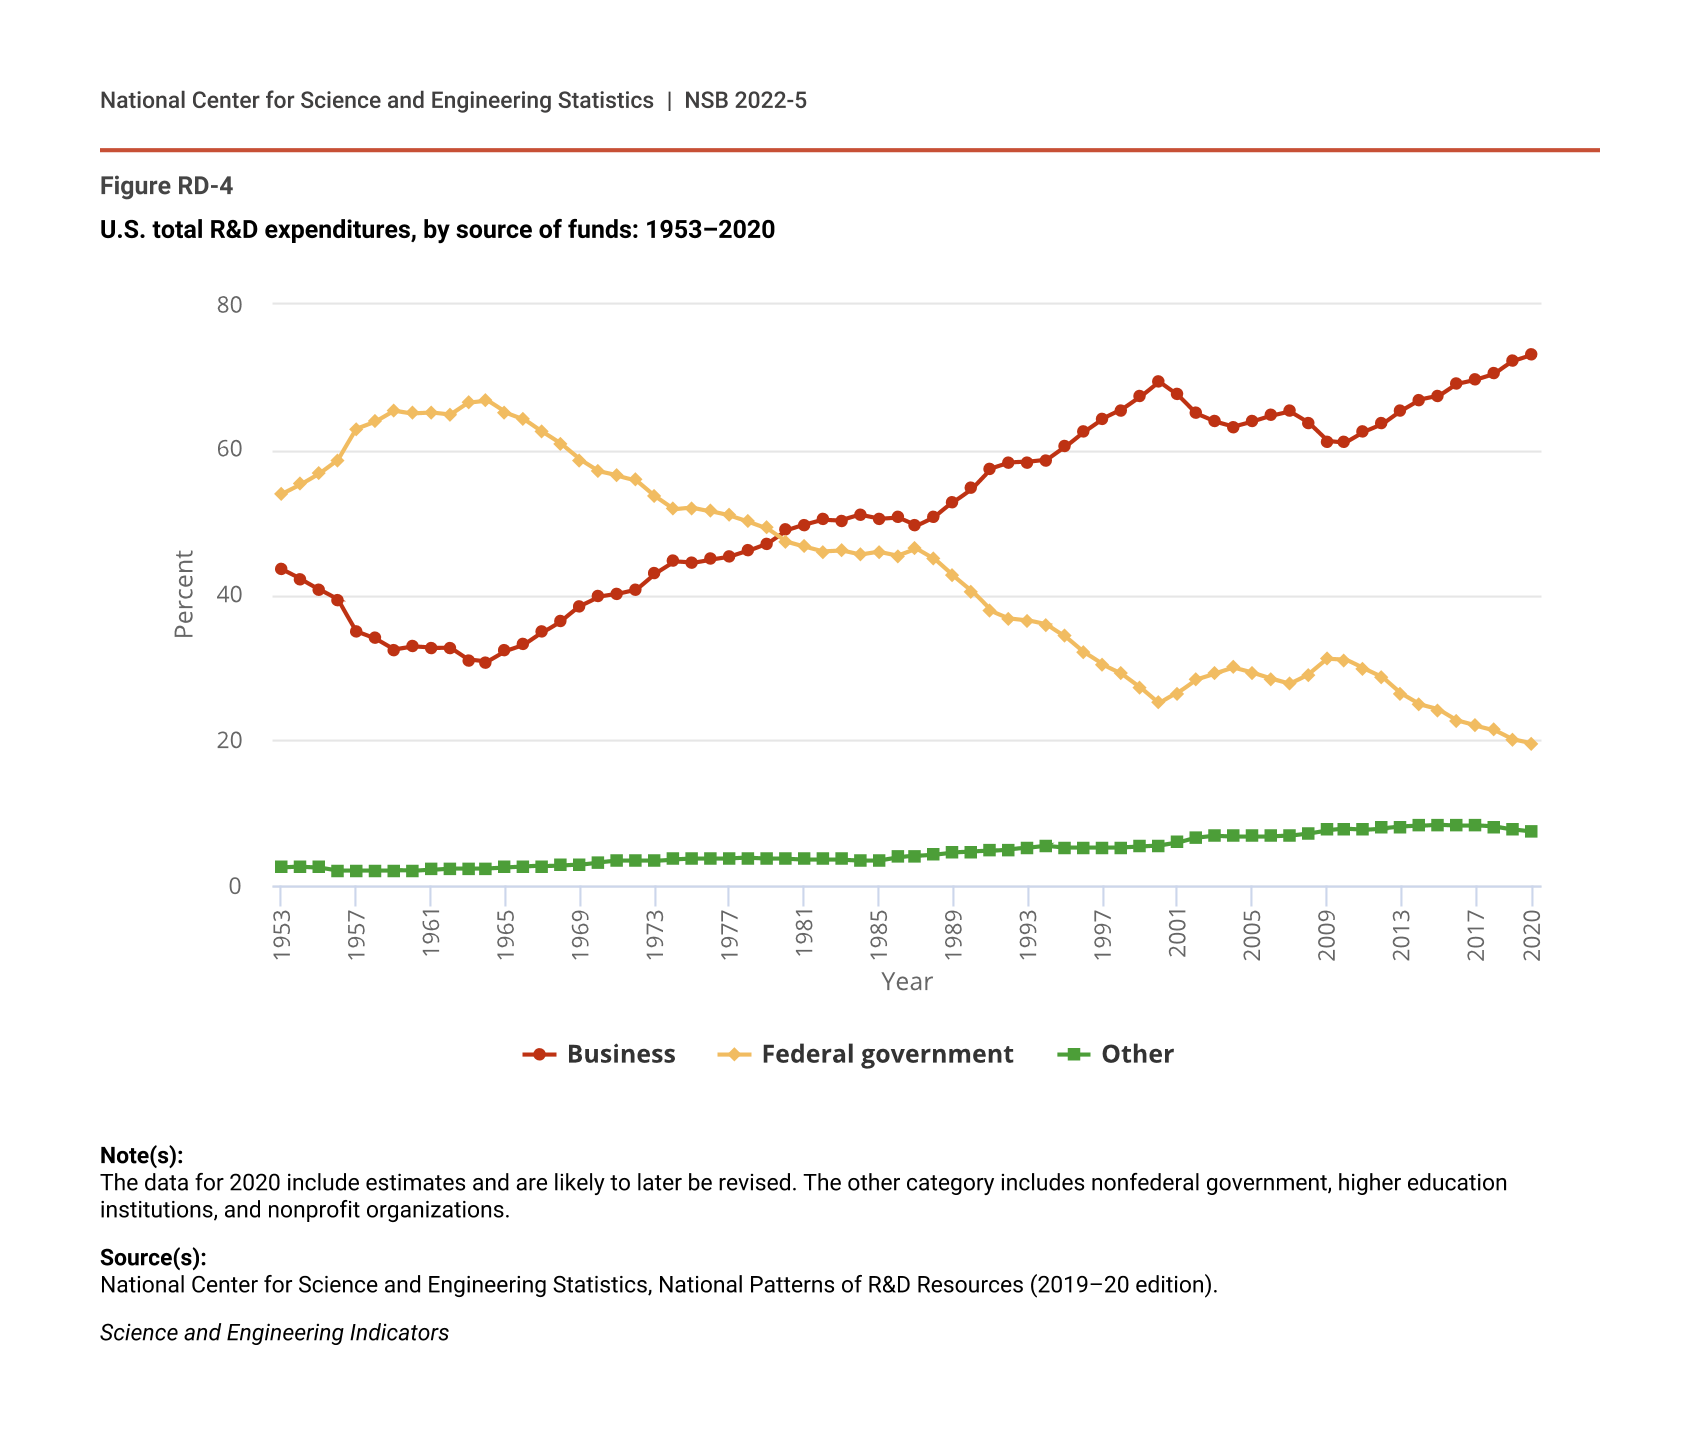
The business sector’s dominant role in the nation’s R&D funding began in the early 1980s, when its support started to exceed 50% of all U.S. R&D funding (Figure RD-4). Over 2000–19, the business sector’s share of the U.S. R&D funding total has ranged from 61% to 72% yearly.
U.S. total R&D expenditures, by source of funds: 1953–2020
| Year | Business | Federal government | Other |
|---|---|---|---|
| 1953 | 43.5 | 53.9 | 2.5 |
| 1954 | 42.2 | 55.2 | 2.6 |
| 1955 | 40.8 | 56.7 | 2.5 |
| 1956 | 39.4 | 58.6 | 2.1 |
| 1957 | 35.0 | 62.9 | 2.1 |
| 1958 | 34.0 | 63.9 | 2.1 |
| 1959 | 32.5 | 65.4 | 2.1 |
| 1960 | 32.9 | 65.0 | 2.0 |
| 1961 | 32.7 | 65.1 | 2.2 |
| 1962 | 32.8 | 64.8 | 2.4 |
| 1963 | 31.1 | 66.5 | 2.4 |
| 1964 | 30.8 | 66.8 | 2.4 |
| 1965 | 32.3 | 65.1 | 2.5 |
| 1966 | 33.2 | 64.2 | 2.6 |
| 1967 | 34.9 | 62.4 | 2.7 |
| 1968 | 36.5 | 60.7 | 2.8 |
| 1969 | 38.5 | 58.6 | 2.9 |
| 1970 | 39.8 | 57.0 | 3.2 |
| 1971 | 40.2 | 56.4 | 3.4 |
| 1972 | 40.8 | 55.8 | 3.4 |
| 1973 | 43.0 | 53.6 | 3.4 |
| 1974 | 44.6 | 51.8 | 3.6 |
| 1975 | 44.4 | 52.0 | 3.7 |
| 1976 | 44.9 | 51.5 | 3.7 |
| 1977 | 45.3 | 50.9 | 3.7 |
| 1978 | 46.1 | 50.1 | 3.8 |
| 1979 | 47.1 | 49.2 | 3.7 |
| 1980 | 48.9 | 47.4 | 3.7 |
| 1981 | 49.7 | 46.7 | 3.6 |
| 1982 | 50.4 | 46.0 | 3.6 |
| 1983 | 50.3 | 46.1 | 3.6 |
| 1984 | 51.0 | 45.5 | 3.5 |
| 1985 | 50.5 | 45.9 | 3.5 |
| 1986 | 50.7 | 45.4 | 3.9 |
| 1987 | 49.5 | 46.4 | 4.1 |
| 1988 | 50.8 | 44.9 | 4.3 |
| 1989 | 52.8 | 42.6 | 4.6 |
| 1990 | 54.7 | 40.5 | 4.7 |
| 1991 | 57.4 | 37.8 | 4.8 |
| 1992 | 58.2 | 36.8 | 5.0 |
| 1993 | 58.3 | 36.5 | 5.2 |
| 1994 | 58.6 | 35.9 | 5.5 |
| 1995 | 60.4 | 34.3 | 5.3 |
| 1996 | 62.5 | 32.1 | 5.3 |
| 1997 | 64.3 | 30.4 | 5.3 |
| 1998 | 65.5 | 29.2 | 5.3 |
| 1999 | 67.3 | 27.3 | 5.4 |
| 2000 | 69.4 | 25.1 | 5.5 |
| 2001 | 67.6 | 26.5 | 5.9 |
| 2002 | 65.0 | 28.4 | 6.6 |
| 2003 | 63.9 | 29.2 | 6.9 |
| 2004 | 63.2 | 30.0 | 6.8 |
| 2005 | 63.9 | 29.3 | 6.8 |
| 2006 | 64.7 | 28.5 | 6.8 |
| 2007 | 65.3 | 27.8 | 6.9 |
| 2008 | 63.7 | 29.1 | 7.2 |
| 2009 | 61.2 | 31.2 | 7.6 |
| 2010 | 61.0 | 31.1 | 7.8 |
| 2011 | 62.5 | 29.8 | 7.7 |
| 2012 | 63.6 | 28.6 | 7.9 |
| 2013 | 65.4 | 26.4 | 8.1 |
| 2014 | 66.9 | 24.9 | 8.2 |
| 2015 | 67.4 | 24.2 | 8.4 |
| 2016 | 69.1 | 22.7 | 8.3 |
| 2017 | 69.7 | 22.0 | 8.3 |
| 2018 | 70.5 | 21.4 | 8.1 |
| 2019 | 72.2 | 20.1 | 7.7 |
| 2020 | 73.1 | 19.5 | 7.4 |
Note(s):
The data for 2020 include estimates and are likely to later be revised. The other category includes nonfederal government, higher education institutions, and nonprofit organizations.
Source(s):
National Center for Science and Engineering Statistics, National Patterns of R&D Resources (2019–20 edition).
Science and Engineering Indicators
R&D Funding by the Federal Government
The federal government is the second-largest source of funding for U.S. R&D, behind the business sector. It is a significant resource for most of the U.S. R&D performer sectors, except the business sector, in which the federal role, while far from negligible, is overshadowed by businesses funding business R&D.
Funds from the federal government accounted for $133.8 billion, or 20% of U.S. total R&D in 2019 (Table RD-1). The largest amounts of federal funding were directed to R&D performance by the federal government, higher education, and businesses (Table RD-3). In 2019, federal funding supported about 51% of academic R&D performance, 5% of business R&D performance, 33% of nonprofit R&D performance, all of federal intramural R&D performance, and almost all (98%) of FFRDC R&D performance.
Several decades ago, the federal government was the leading sponsor of the nation’s R&D—funding 67% of all U.S. R&D in 1964 (Figure RD-4). The federal share decreased to half (49%) of all funding in the late 1970s, to a little over a third (36%) in the mid-1990s, and to a quarter (25%) by the turn of the century. (A major factor in the decrease of the federal share of national R&D was the sharp decline in funding for space R&D after the United States won the race to the moon in the late 1960s. At largely the same time, the business sector was rapidly expanding its energy-related R&D in response to the world oil supply crises. For additional detail on this history, see Jankowski [2001, 2013].) The share ticked up again to 31% in 2009 and 2010, amid changing business conditions and expanded federal funding for health, defense, and counterterrorism R&D (including ARRA funding). The federal share, however, again declined in subsequent years and stood at 20% in 2019. Some of this recent year’s decline reflects the waning of the ARRA incremental funding and the more challenging federal budget environment since 2011. Another reason for the decline, however, is a natural consequence of the large increases in R&D funding from the business sector that also have been happening in these recent years.
R&D Funding from Other Sources
The remainder of R&D funding from other sources is a smaller component: $51.3 billion in 2019, or about 8% of all U.S. R&D performance (Table RD-3). Of this amount, $21.6 billion was from higher education’s own institutional funds, nearly all of which remain in the academic sector; $4.9 billion was from state and local governments, primarily supporting academic research; and $24.8 billion was from nonprofit organizations, mostly funding this sector’s own R&D. Of the estimated nonprofit total, some funds ($7.9 billion) support R&D in higher education, and small amounts supported that of businesses ($0.9 billion), FFRDCs ($0.2 billion), and state government ($0.1 billion).
R&D by Type of R&D
In 2019, basic research activities comprised $102.9 billion (15%) of total U.S. R&D expenditures, followed by applied research at $132.0 billion (20%) and $432.0 billion (65%) for experimental development (Table RD-3 and Table RD-4). (For definitions of these terms, see the Glossary section.)
U.S. R&D expenditures, by type of R&D: Selected years, 2000–20
a The data for 2020 include estimates and are likely to later be revised.
Note(s):
Data throughout the time series reported here are consistently based on the Organisation for Economic Co-operation and Development's Frascati Manual (OECD 2015) definitions for basic research, applied research, and experimental development. Prior to 2010, however, some changes were introduced in the questionnaires of the sectoral expenditure surveys to improve the accuracy of respondents' classification of their R&D by type. Accordingly, small percentage changes in the historical data may not be meaningful.
Source(s):
National Center for Science and Engineering Statistics, National Patterns of R&D Resources (2019–20 edition).
Science and Engineering Indicators
Basic Research
Higher education institutions continued to be the largest performer of U.S. basic research in 2019, while the federal government remained the largest source of funding for basic research. Higher education performed just under half (48%) of all basic research, and the federal government funded about 41% of all basic research performed (Table RD-3). The business sector was also a substantial performer (32%) and funder (33%) of basic research. The federal government (agency intramural laboratories and FFRDCs) and nonprofit organizations were smaller performers, accounting for 12% and 9%, respectively, of the U.S basic research performance total in 2019.
Applied Research
The business sector was both the largest performer (58%) and largest funder (56%) of applied research in 2019 (Table RD-3). Higher education (17%), the federal government (16%), and nonprofit organizations (10%) were the next-largest performers of applied research.
The vast majority of business sector’s funding for applied research remained within the sector (Table RD-3). The federal government provided about a third of applied research funding, with its funding spread broadly across different sectors; higher education and federal intramural laboratories and FFRDCs received the largest amounts.
Experimental Development
The business sector predominates in experimental development, performing 90% of the R&D in this category in 2019 (Table RD-3). The federal government accounted for another 7%, much of it defense related, with the federal government itself the primary user of the results. By contrast, higher education and nonprofit organizations perform relatively little development (2% and 1%, respectively, of the total in 2019).
The business sector provided 87% of the funding for the experimental development performed in 2019, nearly all of which remained in that sector (Table RD-3). Federal funding accounted for about 12% of the experimental development total, with the business sector (especially defense-related industries) and federal intramural laboratories as the largest recipients.