|
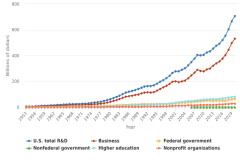
Figure RD-1
|
U.S. R&D, by performing sector and source of funds: 1953–2020 |
National Center for Science and Engineering Statistics
|
National Patterns of R&D Resources
|
|
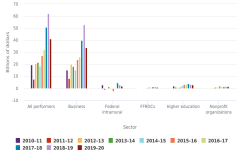
Figure RD-2
|
Year-to-year changes in U.S. R&D expenditures, by performing sector: 2010–20 |
National Center for Science and Engineering Statistics
|
National Patterns of R&D Resources
|
|
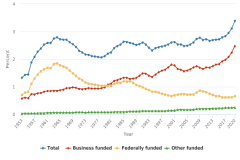
Figure RD-3
|
Ratio of U.S. R&D to gross domestic product, by roles of federal, business, and other funding for R&D: 1953–2020 |
National Center for Science and Engineering Statistics
|
National Patterns of R&D Resources
|
|
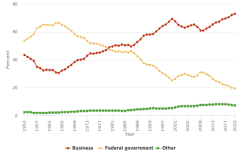
Figure RD-4
|
U.S. total R&D expenditures, by source of funds: 1953–2020 |
National Center for Science and Engineering Statistics
|
National Patterns of R&D Resources
|
|
Figure RD-5
|
Global R&D expenditures, by region: 2019 |
Organisation for Economic Co-operation and Development
|
Main Science and Technology Indicators
|
|
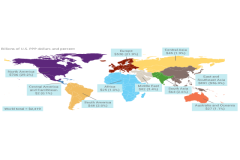
Figure RD-5
|
Global R&D expenditures, by region: 2019
|
UNESCO Institute for Statistics
|
UIS.Stat database
|
|
Figure RD-6
|
GERD and R&D intensity for world's top 17 R&D-performing countries and economies: 2019 or most recent data year |
National Center for Science and Engineering Statistics
|
National Patterns of R&D Resources
|
|
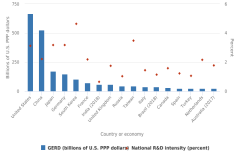
Figure RD-6
|
GERD and R&D intensity for world's top 17 R&D-performing countries and economies: 2019 or most recent data year
|
Organisation for Economic Co-operation and Development
|
Main Science and Technology Indicators
|
|
Figure RD-6
|
GERD and R&D intensity for world's top 17 R&D-performing countries and economies: 2019 or most recent data year
|
UNESCO Institute for Statistics
|
UIS.Stat database
|
|
Figure RD-7
|
Global R&D expenditures, by region: 2000, 2010, and 2019 |
Organisation for Economic Co-operation and Development
|
Main Science and Technology Indicators
|
|
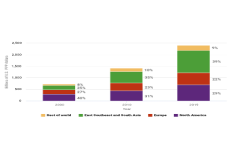
Figure RD-7
|
Global R&D expenditures, by region: 2000, 2010, and 2019
|
UNESCO Institute for Statistics
|
UIS.Stat database
|
|
Figure RD-8
|
Total R&D expenditures and contributions to the increase in worldwide R&D expenditures, by selected region, country, or economy: 2000 and 2019 |
National Center for Science and Engineering Statistics
|
National Patterns of R&D Resources
|
|
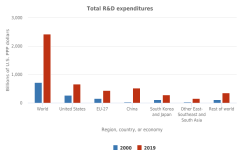
Figure RD-8
|
Total R&D expenditures and contributions to the increase in worldwide R&D expenditures, by selected region, country, or economy: 2000 and 2019
|
Organisation for Economic Co-operation and Development
|
Main Science and Technology Indicators
|
|
Figure RD-8
|
Total R&D expenditures and contributions to the increase in worldwide R&D expenditures, by selected region, country, or economy: 2000 and 2019
|
UNESCO Institute for Statistics
|
UIS.Stat database
|
|
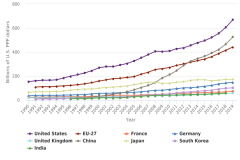
Figure RD-9
|
Gross domestic expenditures on R&D, by selected region, country, or economy: 1990–2019 |
National Center for Science and Engineering Statistics
|
National Patterns of R&D Resources
|
|
Figure RD-9
|
Gross domestic expenditures on R&D, by selected region, country, or economy: 1990–2019
|
Organisation for Economic Co-operation and Development
|
Main Science and Technology Indicators
|
|
Figure RD-9
|
Gross domestic expenditures on R&D, by selected region, country, or economy: 1990–2019
|
UNESCO Institute for Statistics
|
UIS.Stat database
|
|
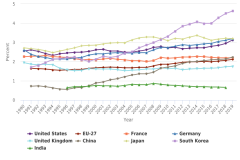
Figure RD-10
|
Gross domestic expenditures on R&D as a share of gross domestic product, by selected region, country, or economy: 1990–2019 |
National Center for Science and Engineering Statistics
|
National Patterns of R&D Resources
|
|
Figure RD-10
|
Gross domestic expenditures on R&D as a share of gross domestic product, by selected region, country, or economy: 1990–2019
|
Organisation for Economic Co-operation and Development
|
Main Science and Technology Indicators
|
|
Figure RD-10
|
Gross domestic expenditures on R&D as a share of gross domestic product, by selected region, country, or economy: 1990–2019
|
UNESCO Institute for Statistics
|
UIS.Stat database
|
|
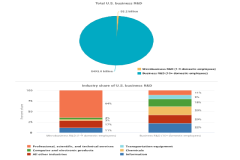
Figure RD-11
|
Top R&D-performing industries: 2019 |
National Center for Science and Engineering Statistics
|
Annual Business Survey
|
|
Figure RD-11
|
Top R&D-performing industries: 2019
|
National Center for Science and Engineering Statistics
|
Business Enterprise Research and Development Survey
|
|
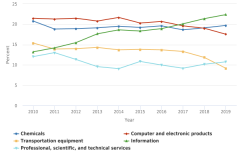
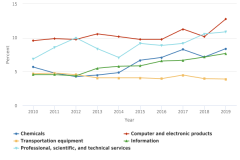
Figure RD-12
|
Industry share of total business R&D, by top R&D-performing industries: 2010–19 |
National Center for Science and Engineering Statistics
|
Business Enterprise Research and Development Survey
|
|
Figure RD-12
|
Industry share of total business R&D, by top R&D-performing industries: 2010–19
|
National Center for Science and Engineering Statistics
|
Business R&D and Innovation Survey
|
|
Figure RD-12
|
Industry share of total business R&D, by top R&D-performing industries: 2010–19
|
National Center for Science and Engineering Statistics
|
Business Research and Development Survey
|
|
Figure RD-13
|
Business R&D intensity, by top R&D-performing industries: 2010–19 |
National Center for Science and Engineering Statistics
|
Business Enterprise Research and Development Survey
|
|
Figure RD-13
|
Business R&D intensity, by top R&D-performing industries: 2010–19
|
National Center for Science and Engineering Statistics
|
Business R&D and Innovation Survey
|
|
Figure RD-13
|
Business R&D intensity, by top R&D-performing industries: 2010–19
|
National Center for Science and Engineering Statistics
|
Business Research and Development Survey
|
|
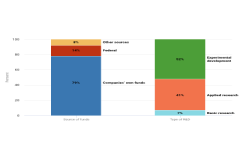
Figure RD-14
|
Microbusiness R&D performance, by source of funds and type of R&D: 2019 |
National Center for Science and Engineering Statistics
|
Annual Business Survey
|
|
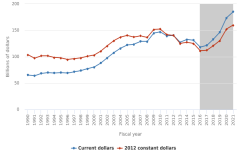
Figure RD-15
|
Federal obligations for R&D and R&D plant, current and constant dollars: FYs 1990–2021 |
National Center for Science and Engineering Statistics
|
Survey of Federal Funds for Research and Development
|
|
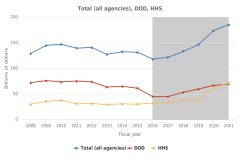
Figure RD-16
|
Federal obligations for R&D and R&D plant, total and for selected agencies: FYs 2008–21 |
National Center for Science and Engineering Statistics
|
Survey of Federal Funds for Research and Development
|
|
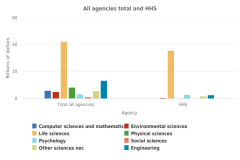
Figure RD-17
|
Federal obligations for research, by agency and major S&E field: FY 2020 |
National Center for Science and Engineering Statistics
|
Survey of Federal Funds for Research and Development
|
|
Table RD-1
|
U.S. R&D expenditures, by performing sector and source of funds: 2010–20 |
National Center for Science and Engineering Statistics
|
National Patterns of R&D Resources
|
|
Table RD-2
|
Annual rates of change in U.S. R&D expenditures, by performing sector: 1990–2020 |
National Center for Science and Engineering Statistics
|
National Patterns of R&D Resources
|
|
Table RD-3
|
U.S. R&D expenditures, by performing sector, source of funds, and type of R&D: 2019 |
National Center for Science and Engineering Statistics
|
National Patterns of R&D Resources
|
|
Table RD-4
|
U.S. R&D expenditures, by type of R&D: Selected years, 2000–20 |
National Center for Science and Engineering Statistics
|
National Patterns of R&D Resources
|
|
Table RD-5
|
International comparisons of gross domestic expenditures on R&D and R&D share of gross domestic product, by region, country, or economy: 2019 or most recent year |
National Center for Science and Engineering Statistics
|
National Patterns of R&D Resources
|
|
Table RD-5
|
International comparisons of gross domestic expenditures on R&D and R&D share of gross domestic product, by region, country, or economy: 2019 or most recent year
|
Organisation for Economic Co-operation and Development
|
Main Science and Technology Indicators
|
|
Table RD-5
|
International comparisons of gross domestic expenditures on R&D and R&D share of gross domestic product, by region, country, or economy: 2019 or most recent year
|
UNESCO Institute for Statistics
|
UIS.Stat database
|
|
Table RD-6
|
Comparative growth rates for gross domestic expenditures on R&D and gross domestic product, top R&D-performing countries: 2000–10 and 2010–19 |
National Center for Science and Engineering Statistics
|
National Patterns of R&D Resources
|
|
Table RD-6
|
Comparative growth rates for gross domestic expenditures on R&D and gross domestic product, top R&D-performing countries: 2000–10 and 2010–19
|
Organisation for Economic Co-operation and Development
|
Main Science and Technology Indicators
|
|
Table RD-6
|
Comparative growth rates for gross domestic expenditures on R&D and gross domestic product, top R&D-performing countries: 2000–10 and 2010–19
|
UNESCO Institute for Statistics
|
UIS.Stat database
|
|
Table RD-7
|
Gross expenditures on R&D for selected countries, by performing sector and source of funds: 2019 or most recent year |
National Center for Science and Engineering Statistics
|
National Patterns of R&D Resources
|
|
Table RD-7
|
Gross expenditures on R&D for selected countries, by performing sector and source of funds: 2019 or most recent year
|
Organisation for Economic Co-operation and Development
|
Main Science and Technology Indicators
|
|
Table RD-7
|
Gross expenditures on R&D for selected countries, by performing sector and source of funds: 2019 or most recent year
|
UNESCO Institute for Statistics
|
UIS.Stat database
|
|
Table RD-8
|
Gross expenditures on R&D for selected countries, by type of R&D: 2019 or most recent year |
National Center for Science and Engineering Statistics
|
National Patterns of R&D Resources
|
|
Table RD-8
|
Gross expenditures on R&D for selected countries, by type of R&D: 2019 or most recent year
|
Organisation for Economic Co-operation and Development
|
Main Science and Technology Indicators
|
|
Table RD-8
|
Gross expenditures on R&D for selected countries, by type of R&D: 2019 or most recent year
|
UNESCO Institute for Statistics
|
UIS.Stat database
|
|
Table RD-9
|
Funds spent for business R&D performed in the United States, by source of funds and selected industry: 2019 |
National Center for Science and Engineering Statistics
|
Business Enterprise Research and Development Survey
|
|
Table RD-10
|
Sales, R&D intensity, and employment for companies that performed or funded R&D, by selected industry: 2019 |
National Center for Science and Engineering Statistics
|
Business Enterprise Research and Development Survey
|
|
Table RD-11
|
Funds spent for business R&D performed in the United States, by source of funds: 2010–19 |
National Center for Science and Engineering Statistics
|
Business Enterprise Research and Development Survey
|
|
Table RD-11
|
Funds spent for business R&D performed in the United States, by source of funds: 2010–19
|
National Center for Science and Engineering Statistics
|
Business R&D and Innovation Survey
|
|
Table RD-11
|
Funds spent for business R&D performed in the United States, by source of funds: 2010–19
|
National Center for Science and Engineering Statistics
|
Business Research and Development Survey
|
|
Table RD-12
|
Funds spent for business R&D performed in the United States, by size of company: 2010–19 |
National Center for Science and Engineering Statistics
|
Annual Business Survey
|
|
Table RD-12
|
Funds spent for business R&D performed in the United States, by size of company: 2010–19
|
National Center for Science and Engineering Statistics
|
Business Enterprise Research and Development Survey
|
|
Table RD-12
|
Funds spent for business R&D performed in the United States, by size of company: 2010–19
|
National Center for Science and Engineering Statistics
|
Business R&D and Innovation Survey
|
|
Table RD-12
|
Funds spent for business R&D performed in the United States, by size of company: 2010–19
|
National Center for Science and Engineering Statistics
|
Business R&D and Innovation Survey–Microbusiness
|
|
Table RD-12
|
Funds spent for business R&D performed in the United States, by size of company: 2010–19
|
National Center for Science and Engineering Statistics
|
Business Research and Development Survey
|
|
Table RD-13
|
Funds spent for business R&D performed in the United States, by type of R&D: 2010–19 |
National Center for Science and Engineering Statistics
|
Business Enterprise Research and Development Survey
|
|
Table RD-13
|
Funds spent for business R&D performed in the United States, by type of R&D: 2010–19
|
National Center for Science and Engineering Statistics
|
Business R&D and Innovation Survey
|
|
Table RD-13
|
Funds spent for business R&D performed in the United States, by type of R&D: 2010–19
|
National Center for Science and Engineering Statistics
|
Business Research and Development Survey
|
|
Table RD-13
|
Funds spent for business R&D performed in the United States, by type of R&D: 2010–19
|
National Center for Science and Engineering Statistics
|
National Patterns of R&D Resources
|
|
Table RD-14
|
Business expenditures for R&D, by selected countries and top R&D performing industries: 2018 or most recent year |
National Center for Science and Engineering Statistics
|
Business Research and Development Survey
|
|
Table RD-14
|
Business expenditures for R&D, by selected countries and top R&D performing industries: 2018 or most recent year
|
Organisation for Economic Co-operation and Development
|
Analytical Business Enterprise Resarch and Development (ANBERD) Database
|
|
Table RD-15
|
Federal obligations for R&D and R&D plant, by agency: FYs 2008–21 |
National Center for Science and Engineering Statistics
|
Survey of Federal Funds for Research and Development
|
|
Table RD-16
|
Federal obligations for R&D and R&D plant, by agency and performer: FY 2020 |
National Center for Science and Engineering Statistics
|
Survey of Federal Funds for Research and Development
|
|
Table RD-17
|
Federal obligations for R&D, by agency and type of R&D: FY 2020 |
National Center for Science and Engineering Statistics
|
Survey of Federal Funds for Research and Development
|
|
Table RD-18
|
Government R&D support, by major socioeconomic objectives, for selected countries or regions: Selected years, 2000–19 |
Organisation for Economic Co-operation and Development
|
Main Science and Technology Indicators
|
|
Table SRD-1
|
Gross expenditures on R&D and expenditures for R&D as a share of gross domestic product, for selected countries or regions: 1981–2019 |
National Center for Science and Engineering Statistics
|
National Patterns of R&D Resources
|
|
Table SRD-1
|
Gross expenditures on R&D and expenditures for R&D as a share of gross domestic product, for selected countries or regions: 1981–2019
|
Organisation for Economic Co-operation and Development
|
Main Science and Technology Indicators
|
|
Table SRD-1
|
Gross expenditures on R&D and expenditures for R&D as a share of gross domestic product, for selected countries or regions: 1981–2019
|
UNESCO Institute for Statistics
|
UIS.Stat database
|
|
Table SRD-2
|
Business R&D performed in the United States, by industry: 2010–19 |
National Center for Science and Engineering Statistics
|
Business Enterprise Research and Development Survey
|
|
Table SRD-2
|
Business R&D performed in the United States, by industry: 2010–19
|
National Center for Science and Engineering Statistics
|
Business R&D and Innovation Survey
|
|
Table SRD-2
|
Business R&D performed in the United States, by industry: 2010–19
|
National Center for Science and Engineering Statistics
|
Business Research and Development Survey
|
|
Table SRD-3
|
Funds spent for business R&D performed in the United States, by type of R&D and selected sources of funds: 2010–19 |
National Center for Science and Engineering Statistics
|
Business Enterprise Research and Development Survey
|
|
Table SRD-3
|
Funds spent for business R&D performed in the United States, by type of R&D and selected sources of funds: 2010–19
|
National Center for Science and Engineering Statistics
|
Business R&D and Innovation Survey
|
|
Table SRD-3
|
Funds spent for business R&D performed in the United States, by type of R&D and selected sources of funds: 2010–19
|
National Center for Science and Engineering Statistics
|
Business Research and Development Survey
|
|
Table SRD-4
|
Funds spent for business R&D performed in the United States, by type of R&D and select industry: 2010–19 |
National Center for Science and Engineering Statistics
|
Business Enterprise Research and Development Survey
|
|
Table SRD-4
|
Funds spent for business R&D performed in the United States, by type of R&D and select industry: 2010–19
|
National Center for Science and Engineering Statistics
|
Business R&D and Innovation Survey
|
|
Table SRD-4
|
Funds spent for business R&D performed in the United States, by type of R&D and select industry: 2010–19
|
National Center for Science and Engineering Statistics
|
Business Research and Development Survey
|
|
Table SRD-5
|
Federal obligations for R&D and R&D plant, by type of R&D: FYs 1953–2021 |
National Center for Science and Engineering Statistics
|
Survey of Federal Funds for Research and Development
|
|
Table SRD-6
|
Federal obligations for R&D and R&D plant, by agency, performer, and type of R&D: FY 2020 |
National Center for Science and Engineering Statistics
|
Survey of Federal Funds for Research and Development
|
|
Table SRD-7
|
Federal obligations for research, by agency and S&E field: FY 2020 |
National Center for Science and Engineering Statistics
|
Survey of Federal Funds for Research and Development
|
|
Table SRD-8
|
Federal obligations for research, by detailed S&E field: Selected years, FYs 1990–2020 |
National Center for Science and Engineering Statistics
|
Survey of Federal Funds for Research and Development
|
 An official website of the United States government