 An official website of the United States government
 Characteristics of S&E Degree Recipients
In recent years, S&E degree recipients have become increasingly diverse in terms of both sex and race and ethnicity, although the representation of women and some racial and ethnic groups remains uneven among S&E fields. Demographic data on S&E degree recipients illustrate the relative position of underrepresented groups in U.S. S&E, groups that are collectively termed the “missing millions” by NSB (NSB 2020). This section of the report extends some analyses from Diversity and STEM: Women, Minorities, and Persons with Disabilities 2023 (NCSES 2023) using 2021 data from the Integrated Postsecondary Education Data System (IPEDS) categorized by the NCSES Taxonomy of Disciplines to address differences in degree attainment by sex and by race and ethnicity.
S&E Degrees by Sex
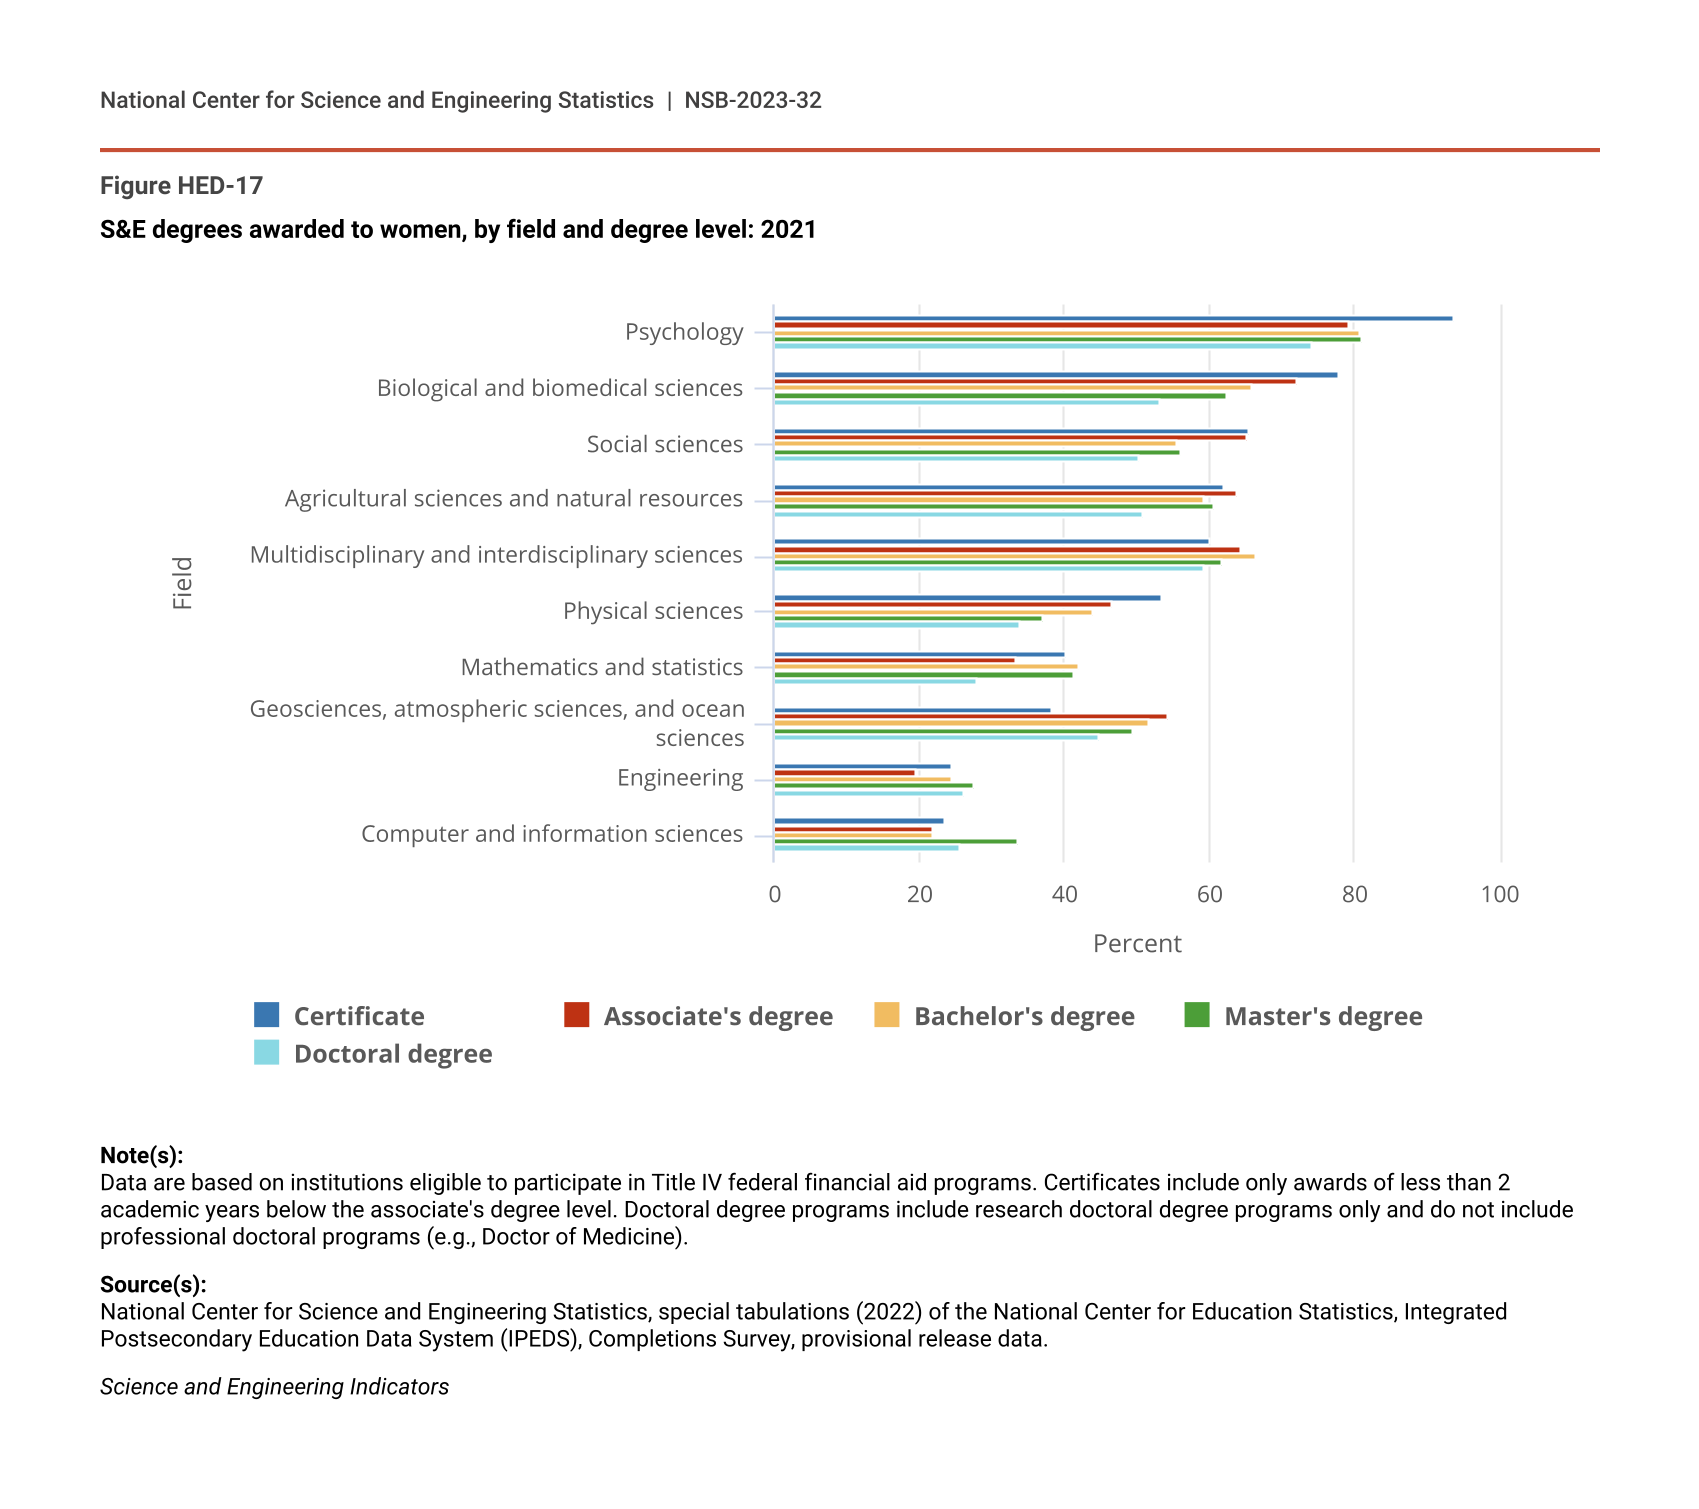
The percentage of S&E certificates and degrees that women earned in 2021 differed by field and by award level (Figure HED-17). Across all award levels, women earned more certificates and degrees than men in agricultural and biological sciences, multidisciplinary and interdisciplinary sciences, social sciences, and psychology. Women earned the highest shares of certificates and degrees in psychology, accounting for 94% of certificates in psychology and at least 74% of psychology degrees at other levels.
S&E degrees awarded to women, by field and degree level: 2021
| Field | Certificate | Associate's degree | Bachelor's degree | Master's degree | Doctoral degree |
|---|---|---|---|---|---|
| Psychology | 93.6 | 79.4 | 80.8 | 81.1 | 74.1 |
| Biological and biomedical sciences | 77.9 | 72.0 | 65.8 | 62.4 | 53.2 |
| Social sciences | 65.4 | 65.2 | 55.6 | 55.9 | 50.3 |
| Agricultural sciences and natural resources | 62.0 | 63.8 | 59.3 | 60.5 | 51.0 |
| Multidisciplinary and interdisciplinary sciences | 60.0 | 64.3 | 66.3 | 61.7 | 59.3 |
| Physical sciences | 53.5 | 46.6 | 44.1 | 37.2 | 33.9 |
| Mathematics and statistics | 40.2 | 33.4 | 42.0 | 41.4 | 27.9 |
| Geosciences, atmospheric sciences, and ocean sciences | 38.2 | 54.3 | 51.8 | 49.4 | 44.8 |
| Engineering | 24.5 | 19.4 | 24.3 | 27.7 | 26.2 |
| Computer and information sciences | 23.5 | 21.7 | 21.9 | 33.7 | 25.7 |
Note(s):
Data are based on institutions eligible to participate in Title IV federal financial aid programs. Certificates include only awards of less than 2 academic years below the associate's degree level. Doctoral degree programs include research doctoral degree programs only and do not include professional doctoral programs (e.g., Doctor of Medicine).
Source(s):
National Center for Science and Engineering Statistics, special tabulations (2022) of the National Center for Education Statistics, Integrated Postsecondary Education Data System (IPEDS), Completions Survey, provisional release data.
Science and Engineering Indicators
In other S&E fields, women made up the minority of award recipients in 2021. In computer and information sciences and in engineering, women earned no more than about a third of awards at any level. In geosciences, atmospheric sciences, and ocean sciences, women earned about half of the associate’s, bachelor’s, and master’s degrees but less than half of the certificates and doctoral degrees. In the physical sciences, women earned 54% of certificates, but the proportion of awards that women earned decreased as award level increased, with women receiving 34% of doctoral degrees.
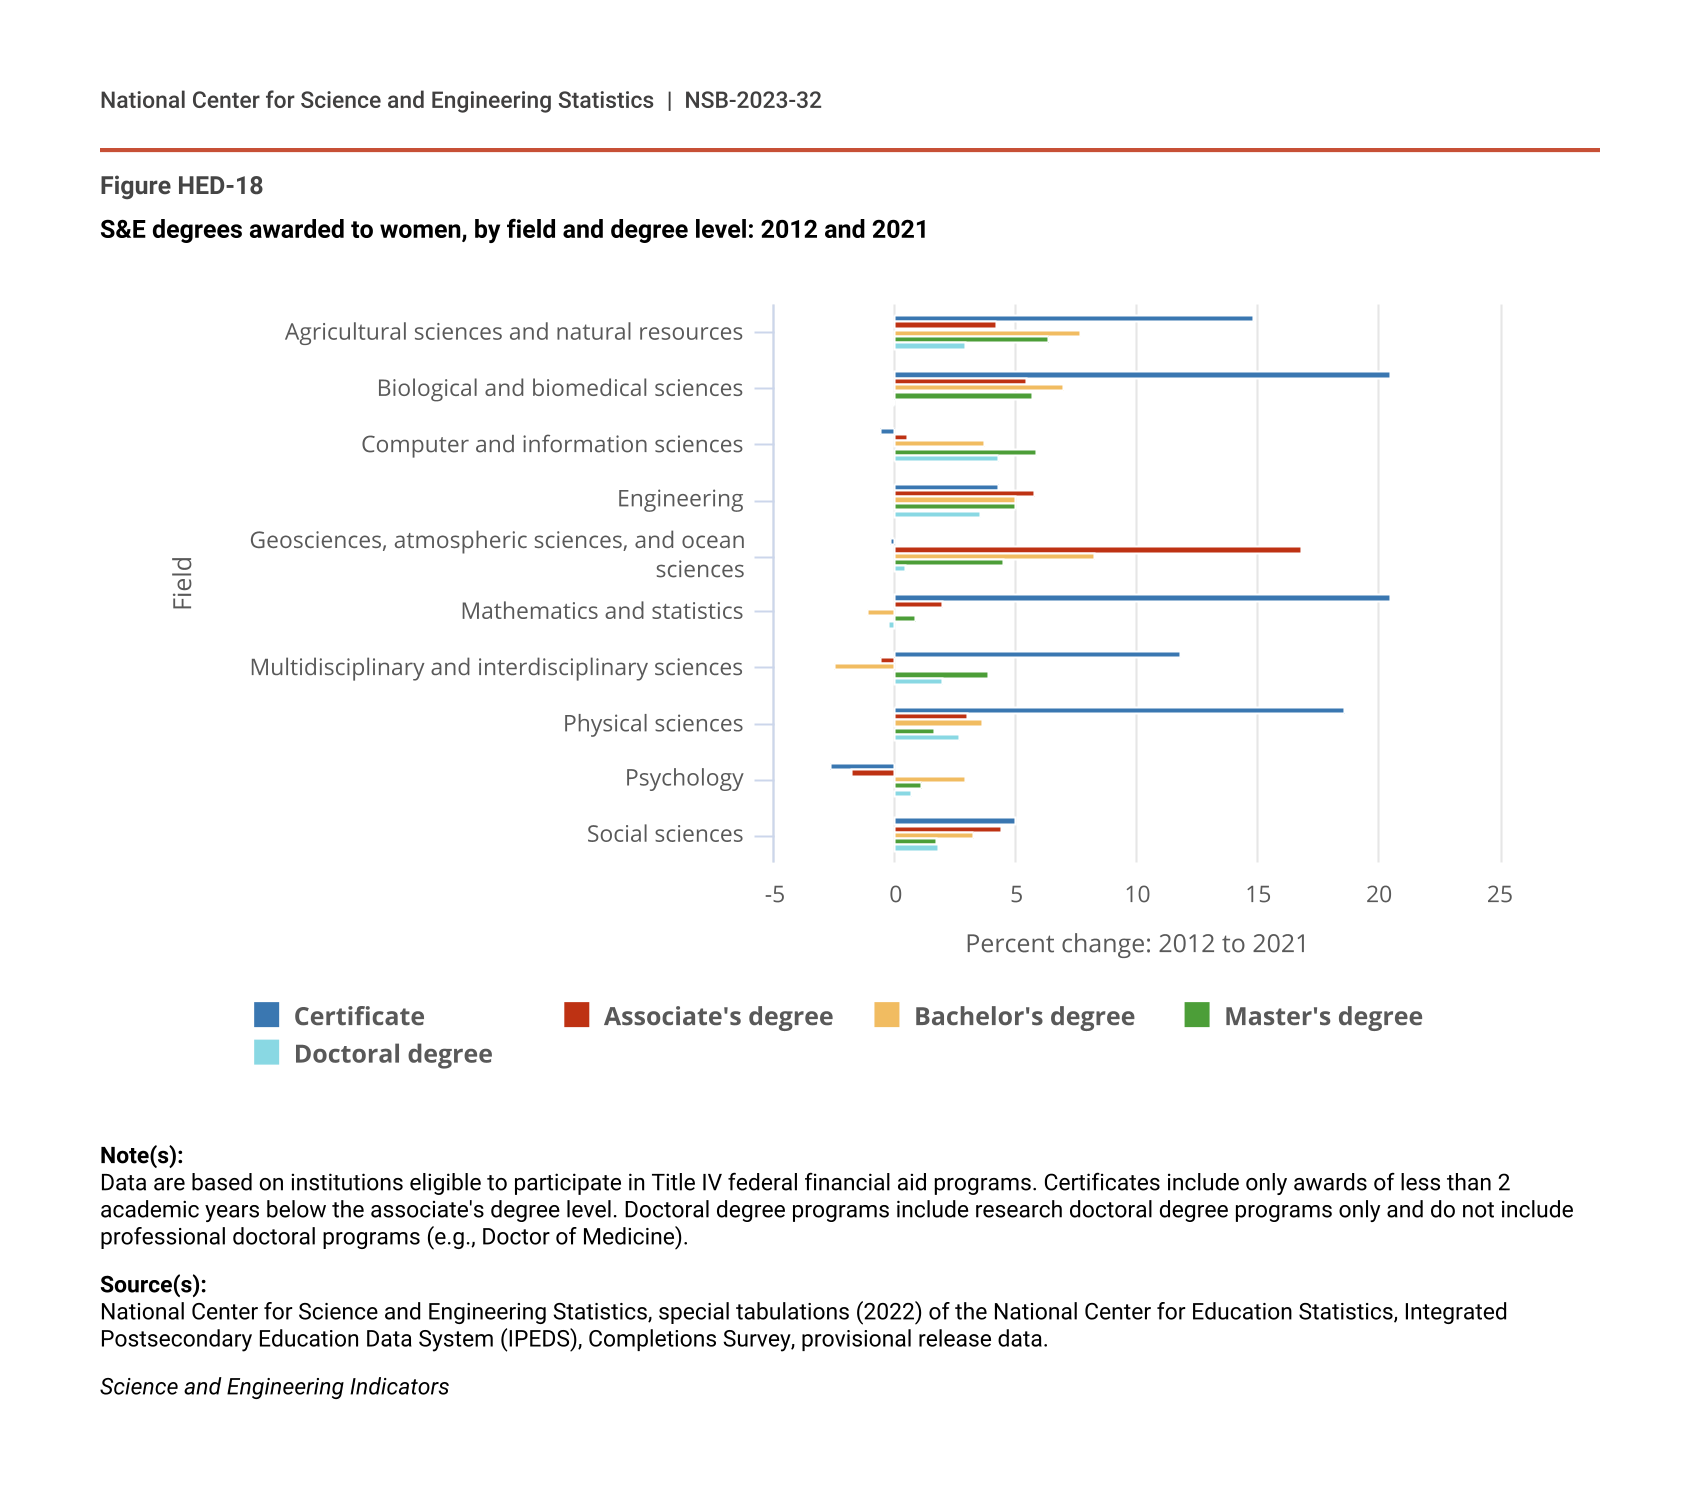
From 2012 to 2021, the percentage of S&E awards that women earned either increased or remained about the same, depending on the field and award level. The largest increases occurred at the certificate level in biological and biomedical sciences (20 percentage points), mathematics and statistics (21 percentage points), and the physical sciences (19 percentage points) (Figure HED-18). In engineering, one of the fields in which women are most underrepresented, the share of awards that women earned increased by 6 percentage points or less at all award levels. Similarly, the share of computer and information sciences awards that women earned increased by 4–6 percentage points at the bachelor’s, master’s, and doctoral levels.
S&E degrees awarded to women, by field and degree level: 2012 and 2021
| Field | Certificate | Associate's degree | Bachelor's degree | Master's degree | Doctoral degree |
|---|---|---|---|---|---|
| Agricultural sciences and natural resources | 14.8 | 4.2 | 7.7 | 6.4 | 2.9 |
| Biological and biomedical sciences | 20.5 | 5.4 | 7.0 | 5.7 | -0.1 |
| Computer and information sciences | -0.6 | 0.5 | 3.7 | 5.9 | 4.3 |
| Engineering | 4.3 | 5.8 | 5.0 | 5.0 | 3.5 |
| Geosciences, atmospheric sciences, and ocean sciences | -0.2 | 16.8 | 8.3 | 4.5 | 0.4 |
| Mathematics and statistics | 20.5 | 2.0 | -1.1 | 0.9 | -0.3 |
| Multidisciplinary and interdisciplinary sciences | 11.8 | -0.6 | -2.5 | 3.9 | 2.0 |
| Physical sciences | 18.6 | 3.0 | 3.6 | 1.6 | 2.7 |
| Psychology | -2.7 | -1.8 | 2.9 | 1.1 | 0.7 |
| Social sciences | 5.0 | 4.4 | 3.3 | 1.7 | 1.8 |
Note(s):
Data are based on institutions eligible to participate in Title IV federal financial aid programs. Certificates include only awards of less than 2 academic years below the associate's degree level. Doctoral degree programs include research doctoral degree programs only and do not include professional doctoral programs (e.g., Doctor of Medicine).
Source(s):
National Center for Science and Engineering Statistics, special tabulations (2022) of the National Center for Education Statistics, Integrated Postsecondary Education Data System (IPEDS), Completions Survey, provisional release data.
Science and Engineering Indicators
S&E Degrees, by Race and Ethnicity
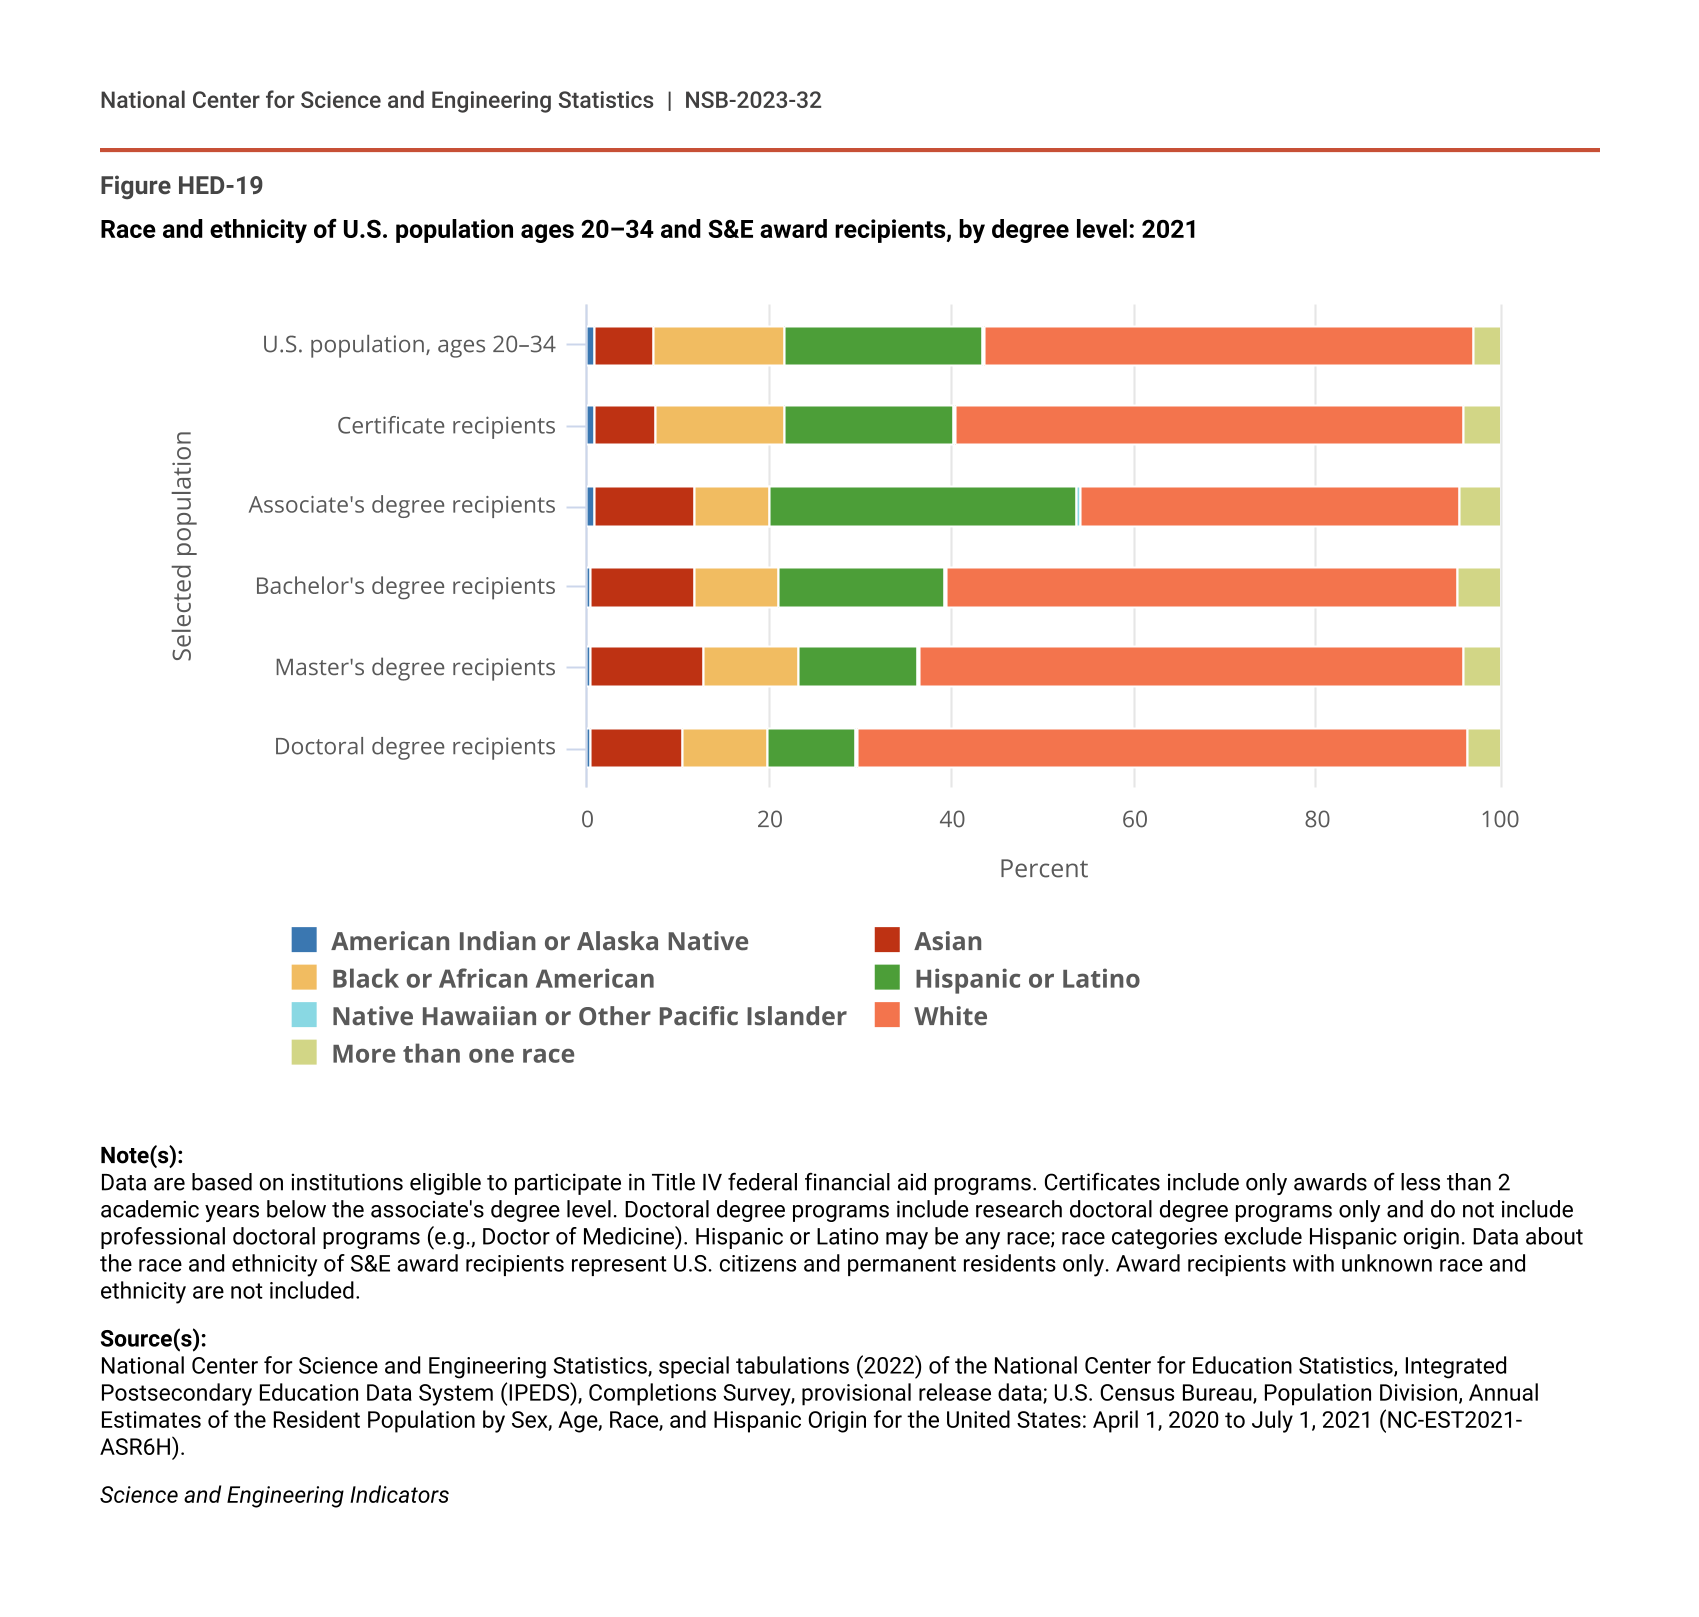
As of 2021, American Indian or Alaska Native, Black or African American, and Hispanic students were underrepresented among S&E certificate and degree award recipients at most award levels relative to their proportions of the U.S. population ages 20–34 years old (Figure HED-19). One notable exception is that Hispanic students comprised 33% of S&E associate’s degree recipients, compared to 22% of the U.S. population ages 20–34 years old. On the other hand, Hispanic students comprised 10% of S&E doctoral degree recipients. Asian individuals were overrepresented among S&E postsecondary award degree recipients at all levels, and White individuals were overrepresented at all levels except the associate’s degree level.
Race and ethnicity of U.S. population ages 20–34 and S&E award recipients, by degree level: 2021
| Selected population | American Indian or Alaska Native | Asian | Black or African American | Hispanic or Latino | Native Hawaiian or Other Pacific Islander | White | More than one race |
|---|---|---|---|---|---|---|---|
| U.S. population, ages 20–34 | 0.8 | 6.5 | 14.3 | 21.7 | 0.2 | 53.7 | 2.7 |
| Certificate recipients | 0.9 | 6.6 | 14.1 | 18.6 | 0.3 | 55.7 | 3.8 |
| Associate's degree recipients | 0.8 | 11.1 | 8.3 | 33.5 | 0.4 | 41.7 | 4.3 |
| Bachelor's degree recipients | 0.4 | 11.5 | 9.2 | 18.3 | 0.2 | 55.9 | 4.6 |
| Master's degree recipients | 0.4 | 12.3 | 10.5 | 13.2 | 0.2 | 59.6 | 3.8 |
| Doctoral degree recipients | 0.4 | 10.2 | 9.2 | 9.7 | 0.1 | 66.9 | 3.5 |
Note(s):
Data are based on institutions eligible to participate in Title IV federal financial aid programs. Certificates include only awards of less than 2 academic years below the associate's degree level. Doctoral degree programs include research doctoral degree programs only and do not include professional doctoral programs (e.g., Doctor of Medicine). Hispanic or Latino may be any race; race categories exclude Hispanic origin. Data about the race and ethnicity of S&E award recipients represent U.S. citizens and permanent residents only. Award recipients with unknown race and ethnicity are not included.
Source(s):
National Center for Science and Engineering Statistics, special tabulations (2022) of the National Center for Education Statistics, Integrated Postsecondary Education Data System (IPEDS), Completions Survey, provisional release data; U.S. Census Bureau, Population Division, Annual Estimates of the Resident Population by Sex, Age, Race, and Hispanic Origin for the United States: April 1, 2020 to July 1, 2021 (NC-EST2021-ASR6H).
Science and Engineering Indicators
The number of S&E certificates and degrees earned by students from most racial and ethnic groups has grown at most award levels over the last decade (Table HED-5). At the associate’s degree level and above, S&E degrees earned by Hispanic students increased by the greatest number from 2012 to 2021, including a 71,000 increase in S&E bachelor’s degrees. The prominent growth in Hispanic S&E degree recipients has occurred in tandem with a large increase in the overall U.S. Hispanic population, which is considerably younger than the nation’s non-Hispanic population. S&E degrees earned by students of more than one race grew most rapidly on a percentage basis during this time, but the number of degree recipients from this group is comparatively small. From 2012 to 2021, S&E degrees earned by American Indian or Alaska Native students decreased at the associate’s, bachelor’s, master’s, and doctoral levels; this was the only racial or ethnic group that experienced a decline in S&E master’s or doctoral degrees.
S&E degrees awarded to U.S. citizens and permanent residents, by degree level, race, and ethnicity: 2012 and 2021
Note(s):
Data are based on institutions eligible to participate in Title IV federal financial aid programs. Certificates include only awards of less than 2 academic years below the associate's degree level. Doctoral degree programs include research doctoral degree programs only and do not include professional doctoral programs (e.g., Doctor of Medicine). Hispanic or Latino may be any race; race categories exclude Hispanic origin. Students on temporary visas are excluded, as are award recipients with unknown race and ethnicity.
Source(s):
National Center for Science and Engineering Statistics, special tabulations (2022) of the National Center for Education Statistics, Integrated Postsecondary Education Data System (IPEDS), Completions Survey, provisional release data.
Science and Engineering Indicators
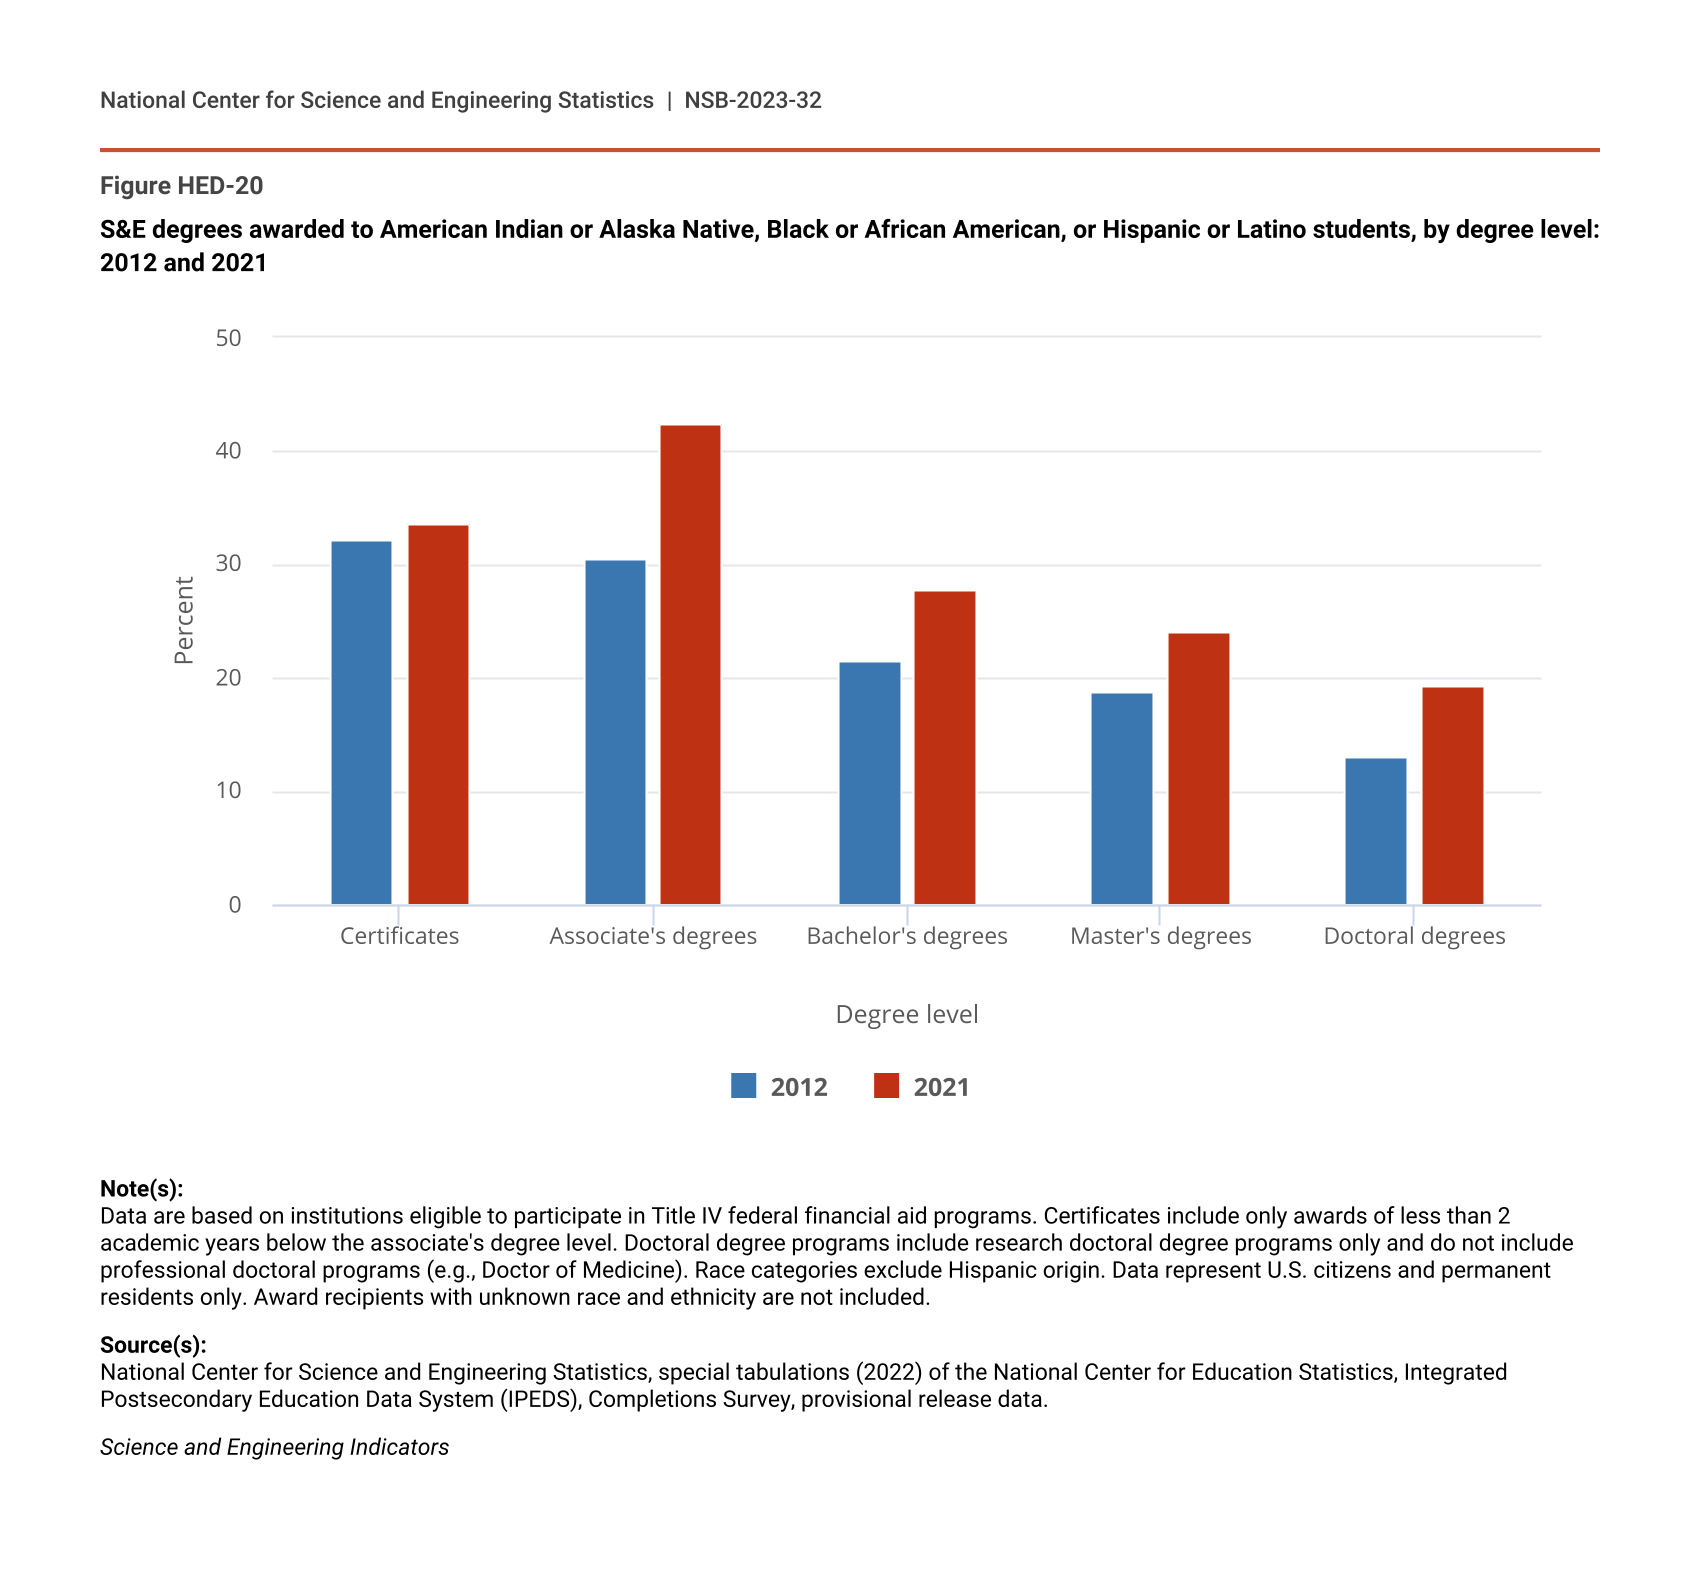
Between 2012 and 2021, the percentage of S&E awards collectively earned by American Indian or Alaska Native, Black or African American, and Hispanic or Latino students increased at every award level (Figure HED-20). The largest increase occurred at the associate’s degree level (from 31% to 42%), while the smallest increase occurred at the certificate level. The percentage of S&E bachelor’s degrees earned by students from these underrepresented groups increased from 22% to 28%, an increase that was driven by the increase in bachelor’s degree awards to Hispanic students. The percentage of S&E bachelor’s degrees earned by Hispanic graduates increased by at least 3 percentage points in every broad S&E field of study between 2012 and 2021 (Table SHED-15). In comparison, in each S&E field the percentage of bachelor’s degrees earned by Black students and American Indian or Alaska Native students either decreased or increased by a relatively small amount.
S&E degrees awarded to American Indian or Alaska Native, Black or African American, or Hispanic or Latino students, by degree level: 2012 and 2021
| Degree level | 2012 | 2021 |
|---|---|---|
| Certificates | 32.1 | 33.6 |
| Associate's degrees | 30.6 | 42.5 |
| Bachelor's degrees | 21.5 | 27.8 |
| Master's degrees | 18.7 | 24.1 |
| Doctoral degrees | 13.0 | 19.3 |
Note(s):
Data are based on institutions eligible to participate in Title IV federal financial aid programs. Certificates include only awards of less than 2 academic years below the associate's degree level. Doctoral degree programs include research doctoral degree programs only and do not include professional doctoral programs (e.g., Doctor of Medicine). Race categories exclude Hispanic origin. Data represent U.S. citizens and permanent residents only. Award recipients with unknown race and ethnicity are not included.
Source(s):
National Center for Science and Engineering Statistics, special tabulations (2022) of the National Center for Education Statistics, Integrated Postsecondary Education Data System (IPEDS), Completions Survey, provisional release data.
Science and Engineering Indicators
S&E Higher Education: Cost, Financial Aid, and Debt
The cost of higher education has increased in recent decades, as has the percentage of students who borrow to finance their education and the total amount of student debt (Ma and Pender 2022). Concern over the cost of higher education has grown among policymakers and the public in general because it poses a barrier for many individuals who cannot afford these expenses. This section presents cost data for higher education for all students and, when possible, for S&E students specifically.
In academic year 2019–20, first-time, full-time undergraduate students attending 4-year institutions faced an average net price of attendance—tuition, fees, and living expenses minus grant aid—of $14,200 at public institutions, $28,100 at private nonprofit institutions, and $23,200 at private for-profit institutions (in constant 2020–21 dollars) (NCES 2022). To pay these costs, students used federal, state, local, and institution grants and took out student loans. Although the federal government provides most student loans, students also borrow through state loan programs and from private lenders. In 2019–20, most first-time, full-time undergraduates received some financial aid; the percentage of aid recipients ranged from 81% among students in public 2-year institutions to 94% among students in private nonprofit 2-year institutions (Table HED-6). Students in private 2-year institutions borrowed at the highest rates: 76% in private for-profit institutions, and 78% in private nonprofit institutions. Students in public 2-year institutions borrowed at the lowest rate, 17%. Among those who borrowed, students in public 2-year institutions borrowed the lowest average amount, $4,700, and students in private for-profit 2-year institutions borrowed the highest average amount, $7,600 (NCES Digest of Education Statistics 2021: Table 331.20).
First-time, full-time undergraduates awarded financial aid, by type of financial aid and institutional control and level: Academic year 2019–20
Note(s):
Data are based on institutions eligible to participate in Title IV federal financial aid programs.
Source(s):
National Center for Education Statistics, Integrated Postsecondary Education Data System (IPEDS), Student Financial Aid Survey (excerpted from Digest of Education Statistics, Table 331.20).
Science and Engineering Indicators
Students’ ability to repay their student loan debt after leaving school is a major concern among the public and policymakers. In 2020, about 4 years after completing their bachelor’s degrees, the median amount borrowed among 2015–16 bachelor’s degree recipients who had taken out federal student loans was $30,000, and the average was $41,000, indicating that some students borrowed much higher amounts (Table HED-7). The total amount borrowed includes borrowing for education after completing the 2015–16 bachelor’s degree: graduates who had enrolled for an additional postsecondary degree or certificate had borrowed a median amount of $43,500, compared with a $27,000 median amount among students who had no further enrollment. By major field of study, the median amounts borrowed ranged from $27,000 among engineering graduates to $36,000 among graduates in health care fields.
Borrowing, debt, repayment, and repayment amount among 2015–16 bachelor's degree recipients who borrowed to pay for undergraduate or graduate education: 2020
Note(s):
Estimates pertain to individuals who completed the requirements for a bachelor’s degree in 2015–16 and were awarded their degree by a Title IV–eligible postsecondary institution in the 50 states, the District of Columbia, or Puerto Rico no later than 30 June 2017. Federal student loans include subsidized and unsubsidized Direct Loans (formerly called Stafford Loans), excluding Direct Unsubsidized Loans to students who received a TEACH Grant and failed to fulfill the service obligation; Perkins Loans; and Graduate PLUS Loans. Loans exclude Parent PLUS Loans. Respondents may owe more on their federal student loans than originally borrowed due to accumulating loan interest; thus, the ratio of amount owed to amount borrowed may be greater than 100%. Average and median monthly payment amount for student loans is calculated among those with at least one student loan in repayment. Monthly payment amounts include monthly payments of $0 for federal student loans under an income-driven repayment plan. Respondents with multiple majors were classified by the first field of study reported. General studies and other includes liberal arts and sciences, general studies, and humanities; multidisciplinary and interdisciplinary studies; basic skills; citizenship activities; health-related knowledge and skills; interpersonal and social skills; leisure and recreational activities; personal awareness and self-improvement; high school or secondary diplomas and certificates; and other majors. Other applied includes personal and consumer services; manufacturing, construction, repair, and transportation; military technology and protective services; architecture; communications; public administration and human services; design and applied arts; law and legal studies; library sciences; and theology and religious vocations.
Source(s):
National Center for Education Statistics, 2016/20 Baccalaureate and Beyond Longitudinal Study (B&B:16/20).
Science and Engineering Indicators
By 2020, the median amount that 2015–16 bachelor’s degree recipients owed in education loans was 92% of what they had borrowed, and the average amount owed was 78% of the amount they had borrowed (Table HED-7). Although 28% of borrowers were currently repaying their loans in summer 2020, reflecting the administrative forbearance that the federal government granted in response to the economic disruption caused by the COVID-19 pandemic, that percentage differed by students’ undergraduate field. Among biological and physical sciences, science technology, mathematics, and agricultural sciences majors, 17% were repaying their loans in 2020. In contrast, 37% of computer and information sciences majors were in repayment. Among those in repayment, the median monthly payment was $200, and the average was $230.
International Students in U.S. S&E Higher Education
International Student Enrollment
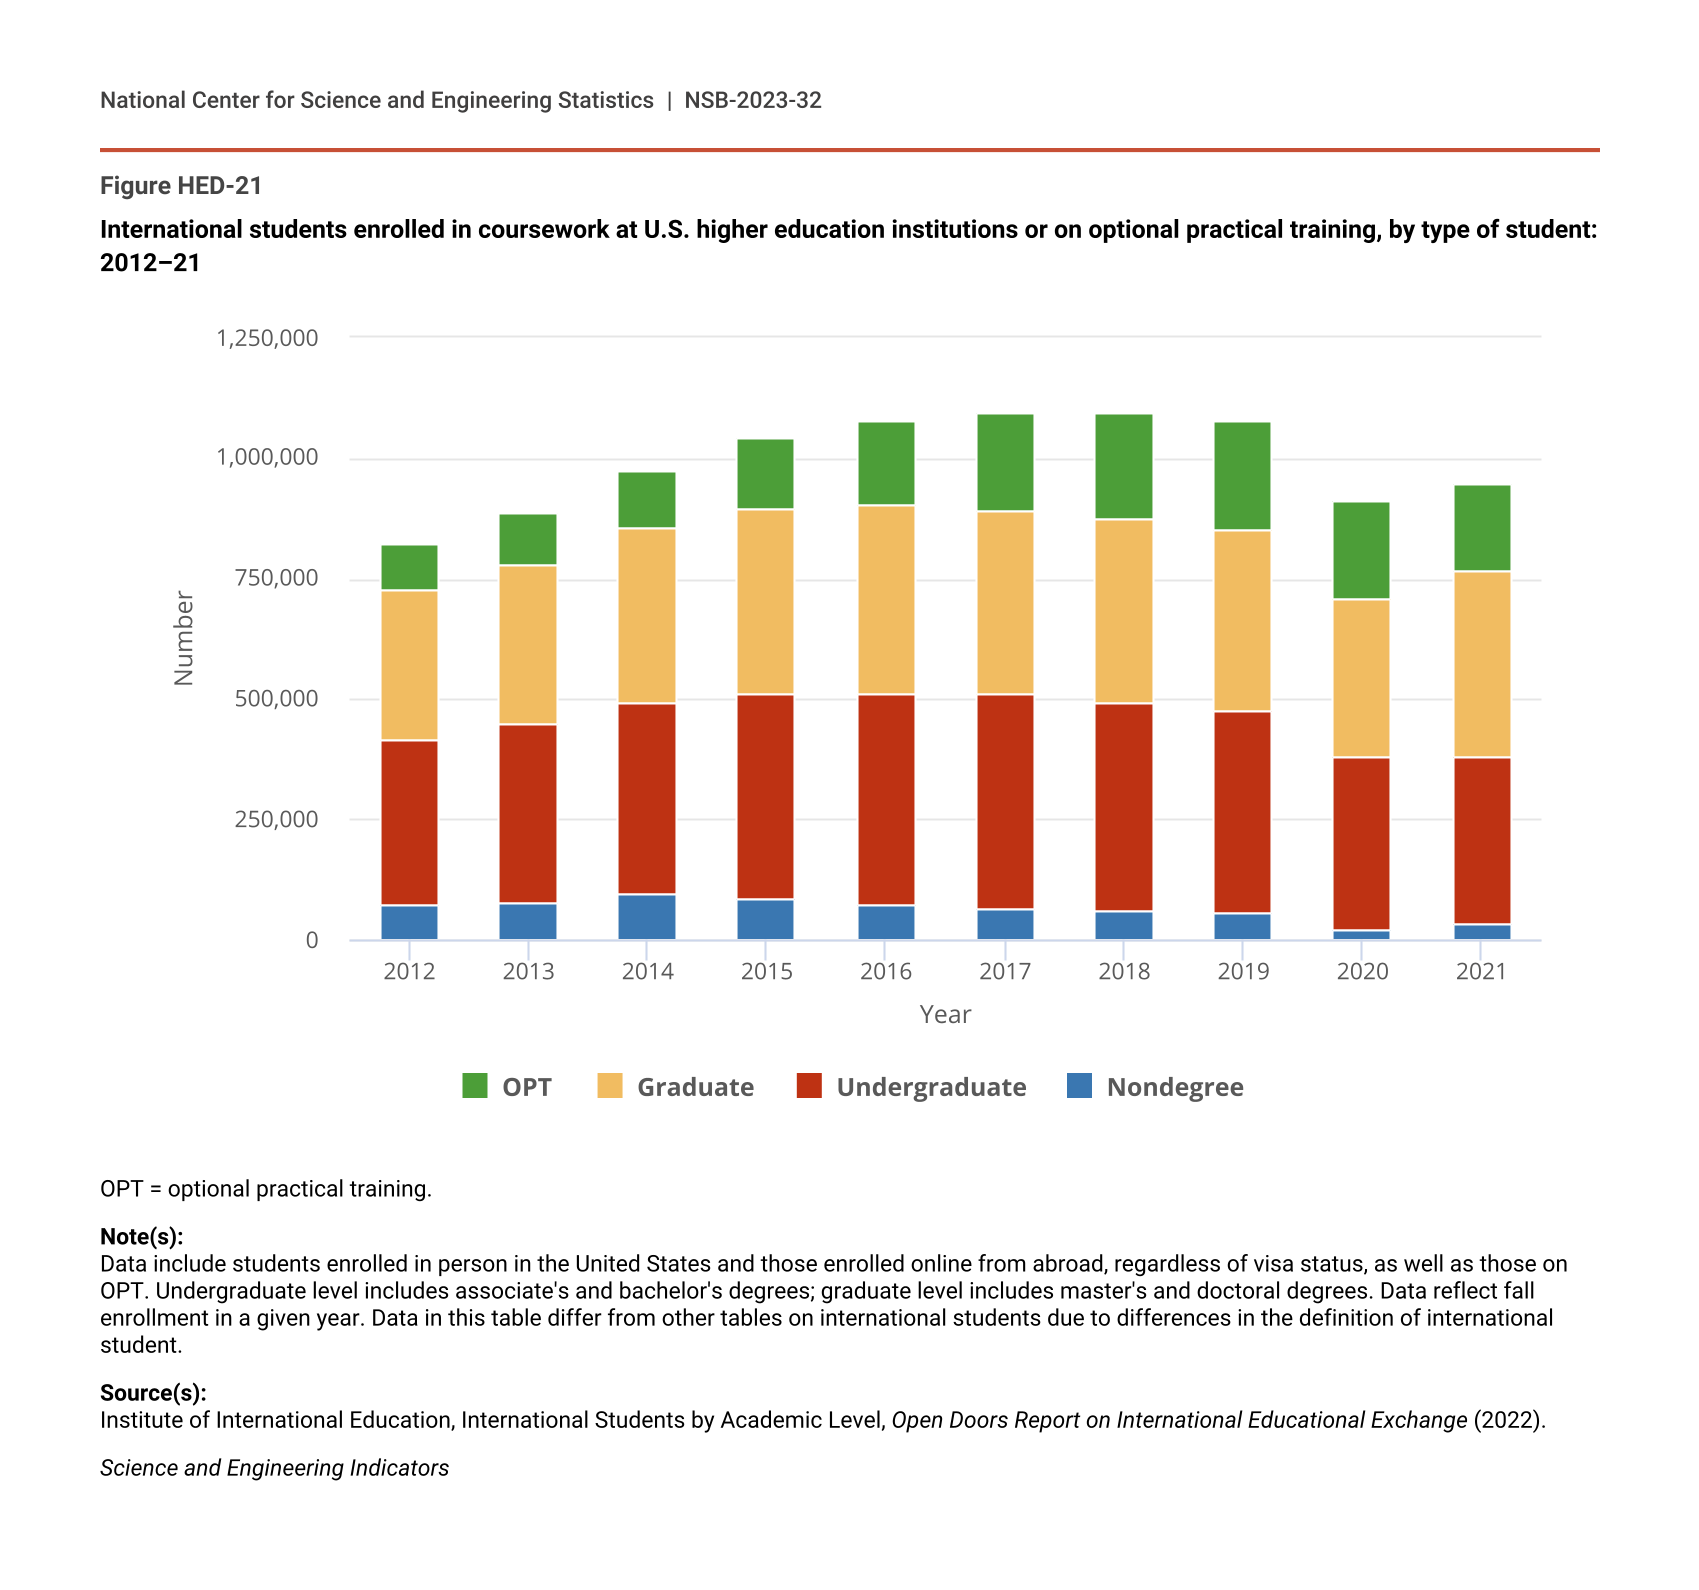
In fall 2021, 949,000 international students—including nondegree students, students enrolled both in person and online from abroad, and individuals on optional practical training—were enrolled in U.S. higher education institutions (Figure HED-21). International students accounted for an estimated 4.7% of total U.S. enrollment in fall 2021, a slight increase from the 4.6% share in 2020 but still below the pre–COVID-19 pandemic high of 5.5% in 2017–19 (IIE 2022c). Enrollment of international nondegree students, such as those on short-term exchange programs, experienced the greatest proportionate decrease from 2019 to 2021. International undergraduate enrollment, which peaked in 2017, and graduate enrollment, which peaked in 2016, both began declining prior to the COVID-19 pandemic. International undergraduate enrollment decreased by 4% from 2020 to 2021, in contrast to graduate enrollment, which increased by 17% (Figure HED-21).
International students enrolled in coursework at U.S. higher education institutions or on optional practical training, by type of student: 2012–21
| Year | Nondegree | Undergraduate | Graduate | OPT |
|---|---|---|---|---|
| 2012 | 73,528 | 339,993 | 311,204 | 94,919 |
| 2013 | 79,477 | 370,724 | 329,854 | 105,997 |
| 2014 | 93,587 | 398,824 | 362,228 | 120,287 |
| 2015 | 85,093 | 427,313 | 383,935 | 147,498 |
| 2016 | 72,984 | 439,019 | 391,124 | 175,695 |
| 2017 | 65,631 | 442,746 | 382,953 | 203,462 |
| 2018 | 62,341 | 431,930 | 377,943 | 223,085 |
| 2019 | 58,201 | 419,321 | 374,435 | 223,539 |
| 2020 | 21,151 | 359,787 | 329,272 | 203,885 |
| 2021 | 34,131 | 344,532 | 385,097 | 184,759 |
OPT = optional practical training.
Note(s):
Data include students enrolled in person in the United States and those enrolled online from abroad, regardless of visa status, as well as those on OPT. Undergraduate level includes associate's and bachelor's degrees; graduate level includes master's and doctoral degrees. Data reflect fall enrollment in a given year. Data in this table differ from other tables on international students due to differences in the definition of international student.
Source(s):
Institute of International Education, International Students by Academic Level, Open Doors Report on International Educational Exchange (2022).
Science and Engineering Indicators
Regulatory changes around the optional practical training (OPT) program led to increases in these students prior to the pandemic, but their numbers fell between 2019 and 2021. International student participation in OPT measured 185,000 students in 2021, a 9% decrease from 204,000 in 2020, which was a decline from the 2019 peak of 224,000 (Figure HED-21). OPT is a temporary work permission program that allows eligible international students on F-1 visas to acquire work experience related to their field of study. The STEM OPT extension allows qualified students who have earned degrees in STEM fields to receive an extension on their OPT tenure. The increase in international students on OPT in the years prior to the COVID-19 pandemic followed a 2016 modification of the program that expanded the duration of the STEM OPT extension from 17 months to 24 months (IIE 2022a). According to one analysis, annual approvals of OPT applications for STEM students increased fivefold, from 34,000 in 2008 to 172,000 in 2016 (Ruiz and Budiman 2018).
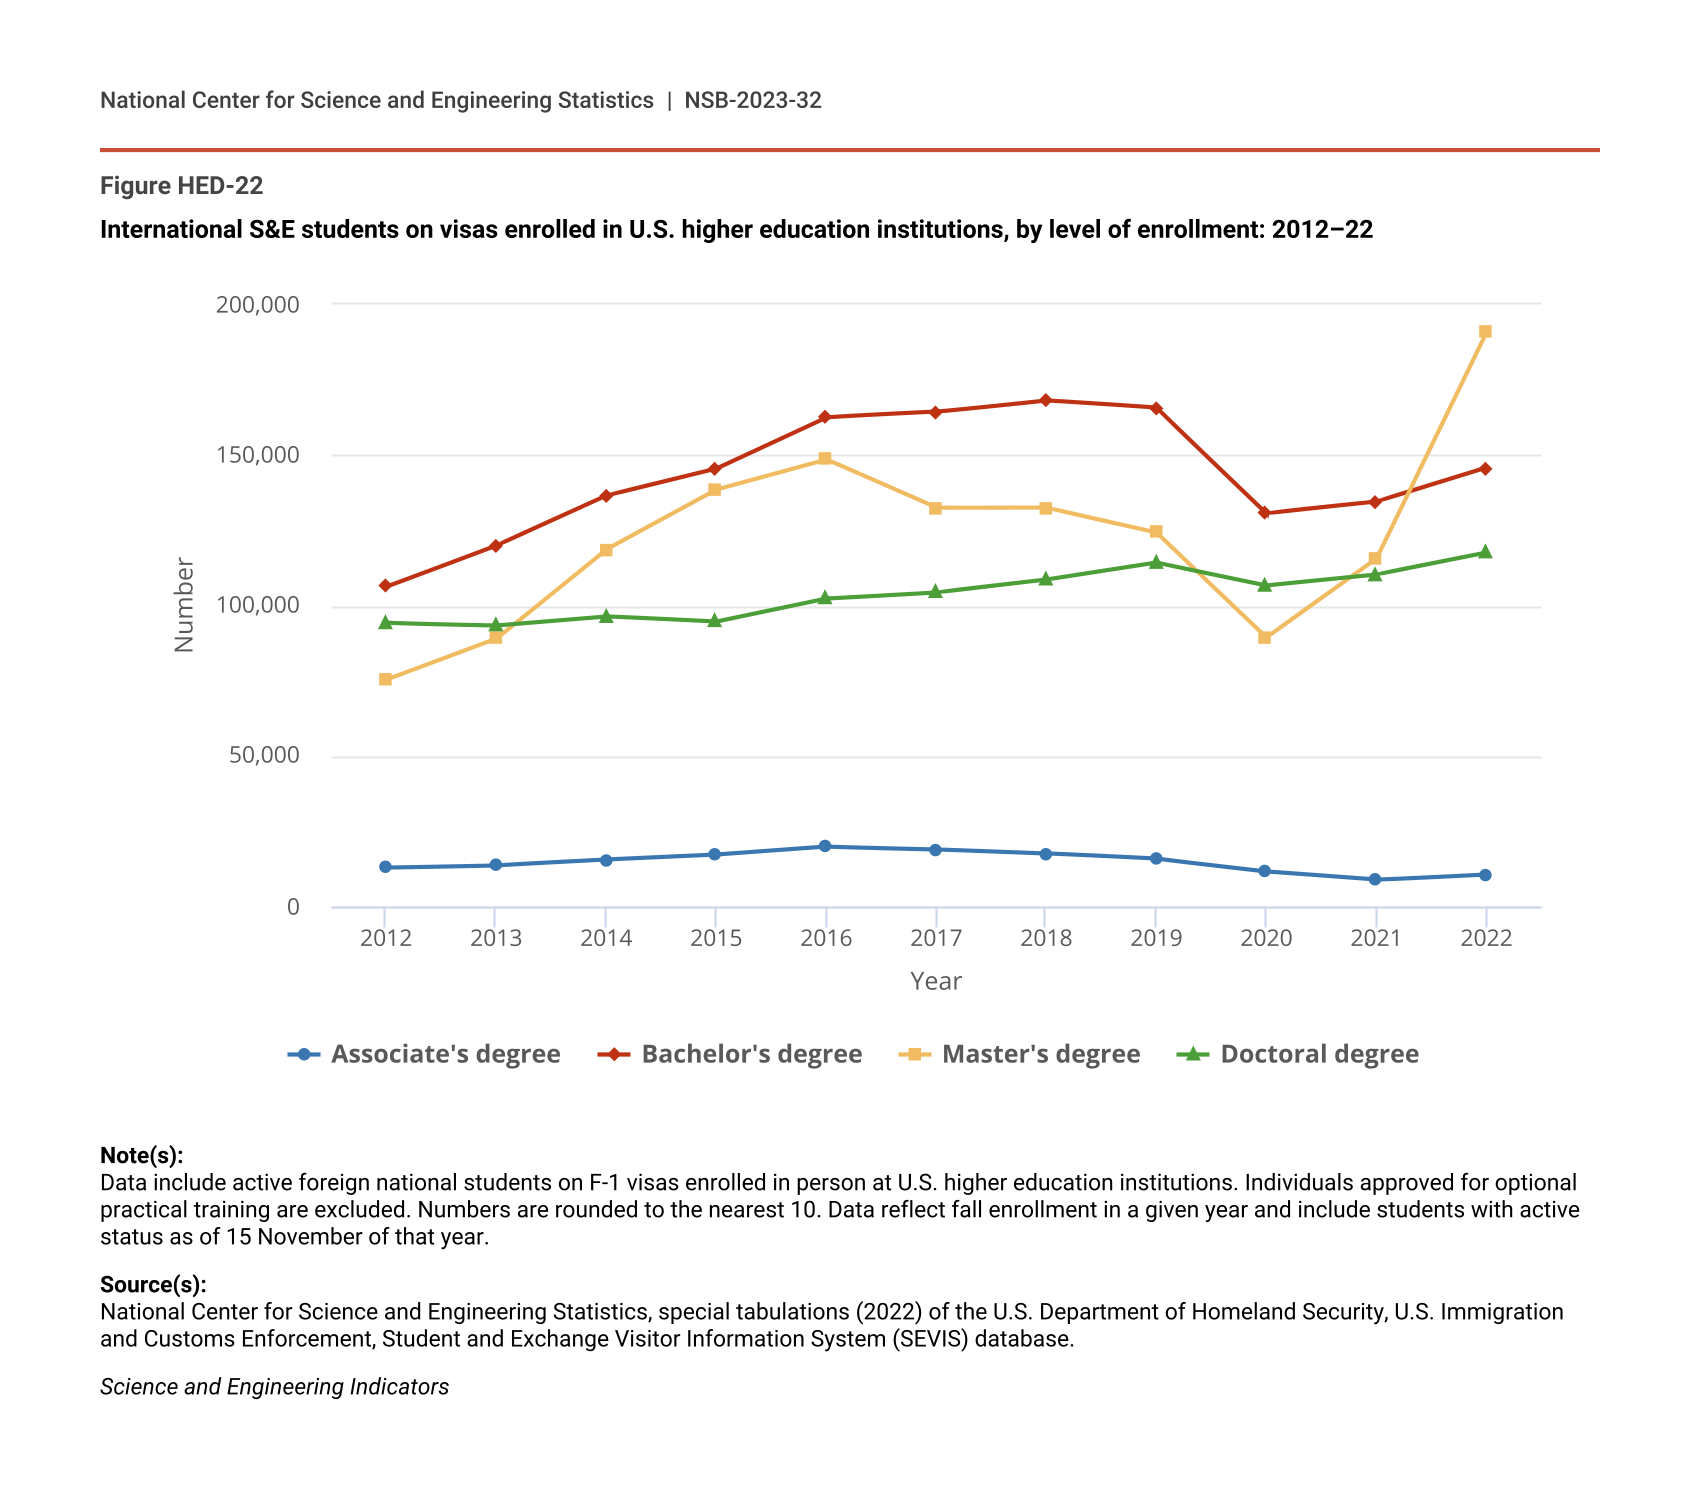
Enrollment of international student visa holders traveling to the United States for postsecondary degrees in S&E fields has increased substantially since fall 2020. In 2022, S&E enrollment of international students on active F-1 visas, excluding those approved for OPT, was 11,000 at the associate’s level, 146,000 at the bachelor’s level, 191,000 at the master’s level, and 117,000 at the doctoral level (Figure HED-22). International S&E master’s enrollment more than doubled from 2020 to 2022; as a result of this sharp increase, total international S&E graduate enrollment reached 308,000 in 2022, the highest level in the past decade. Students on temporary visas have long accounted for much higher shares of total S&E degrees awarded by U.S. institutions at the master’s and doctoral levels than they have at the associate’s and bachelor’s levels. Consequently, compared to international undergraduate enrollment, changes in international graduate enrollment may have a greater impact on U.S. S&E higher education (see section International Degree Recipients).
International S&E students on visas enrolled in U.S. higher education institutions, by level of enrollment: 2012–22
| Year | Associate's degree | Bachelor's degree | Master's degree | Doctoral degree |
|---|---|---|---|---|
| 2012 | 12,910 | 106,290 | 75,280 | 94,130 |
| 2013 | 13,650 | 120,030 | 88,960 | 93,410 |
| 2014 | 15,490 | 136,560 | 118,640 | 96,370 |
| 2015 | 17,130 | 145,530 | 138,460 | 94,590 |
| 2016 | 19,770 | 162,490 | 148,450 | 102,240 |
| 2017 | 18,920 | 164,240 | 132,340 | 104,290 |
| 2018 | 17,520 | 168,090 | 132,460 | 108,490 |
| 2019 | 15,720 | 165,630 | 124,240 | 114,140 |
| 2020 | 11,550 | 130,620 | 89,370 | 106,580 |
| 2021 | 8,830 | 134,370 | 115,530 | 110,150 |
| 2022 | 10,660 | 145,660 | 190,760 | 117,390 |
Note(s):
Data include active foreign national students on F-1 visas enrolled in person at U.S. higher education institutions. Individuals approved for optional practical training are excluded. Numbers are rounded to the nearest 10. Data reflect fall enrollment in a given year and include students with active status as of 15 November of that year.
Source(s):
National Center for Science and Engineering Statistics, special tabulations (2022) of the U.S. Department of Homeland Security, U.S. Immigration and Customs Enforcement, Student and Exchange Visitor Information System (SEVIS) database.
Science and Engineering Indicators
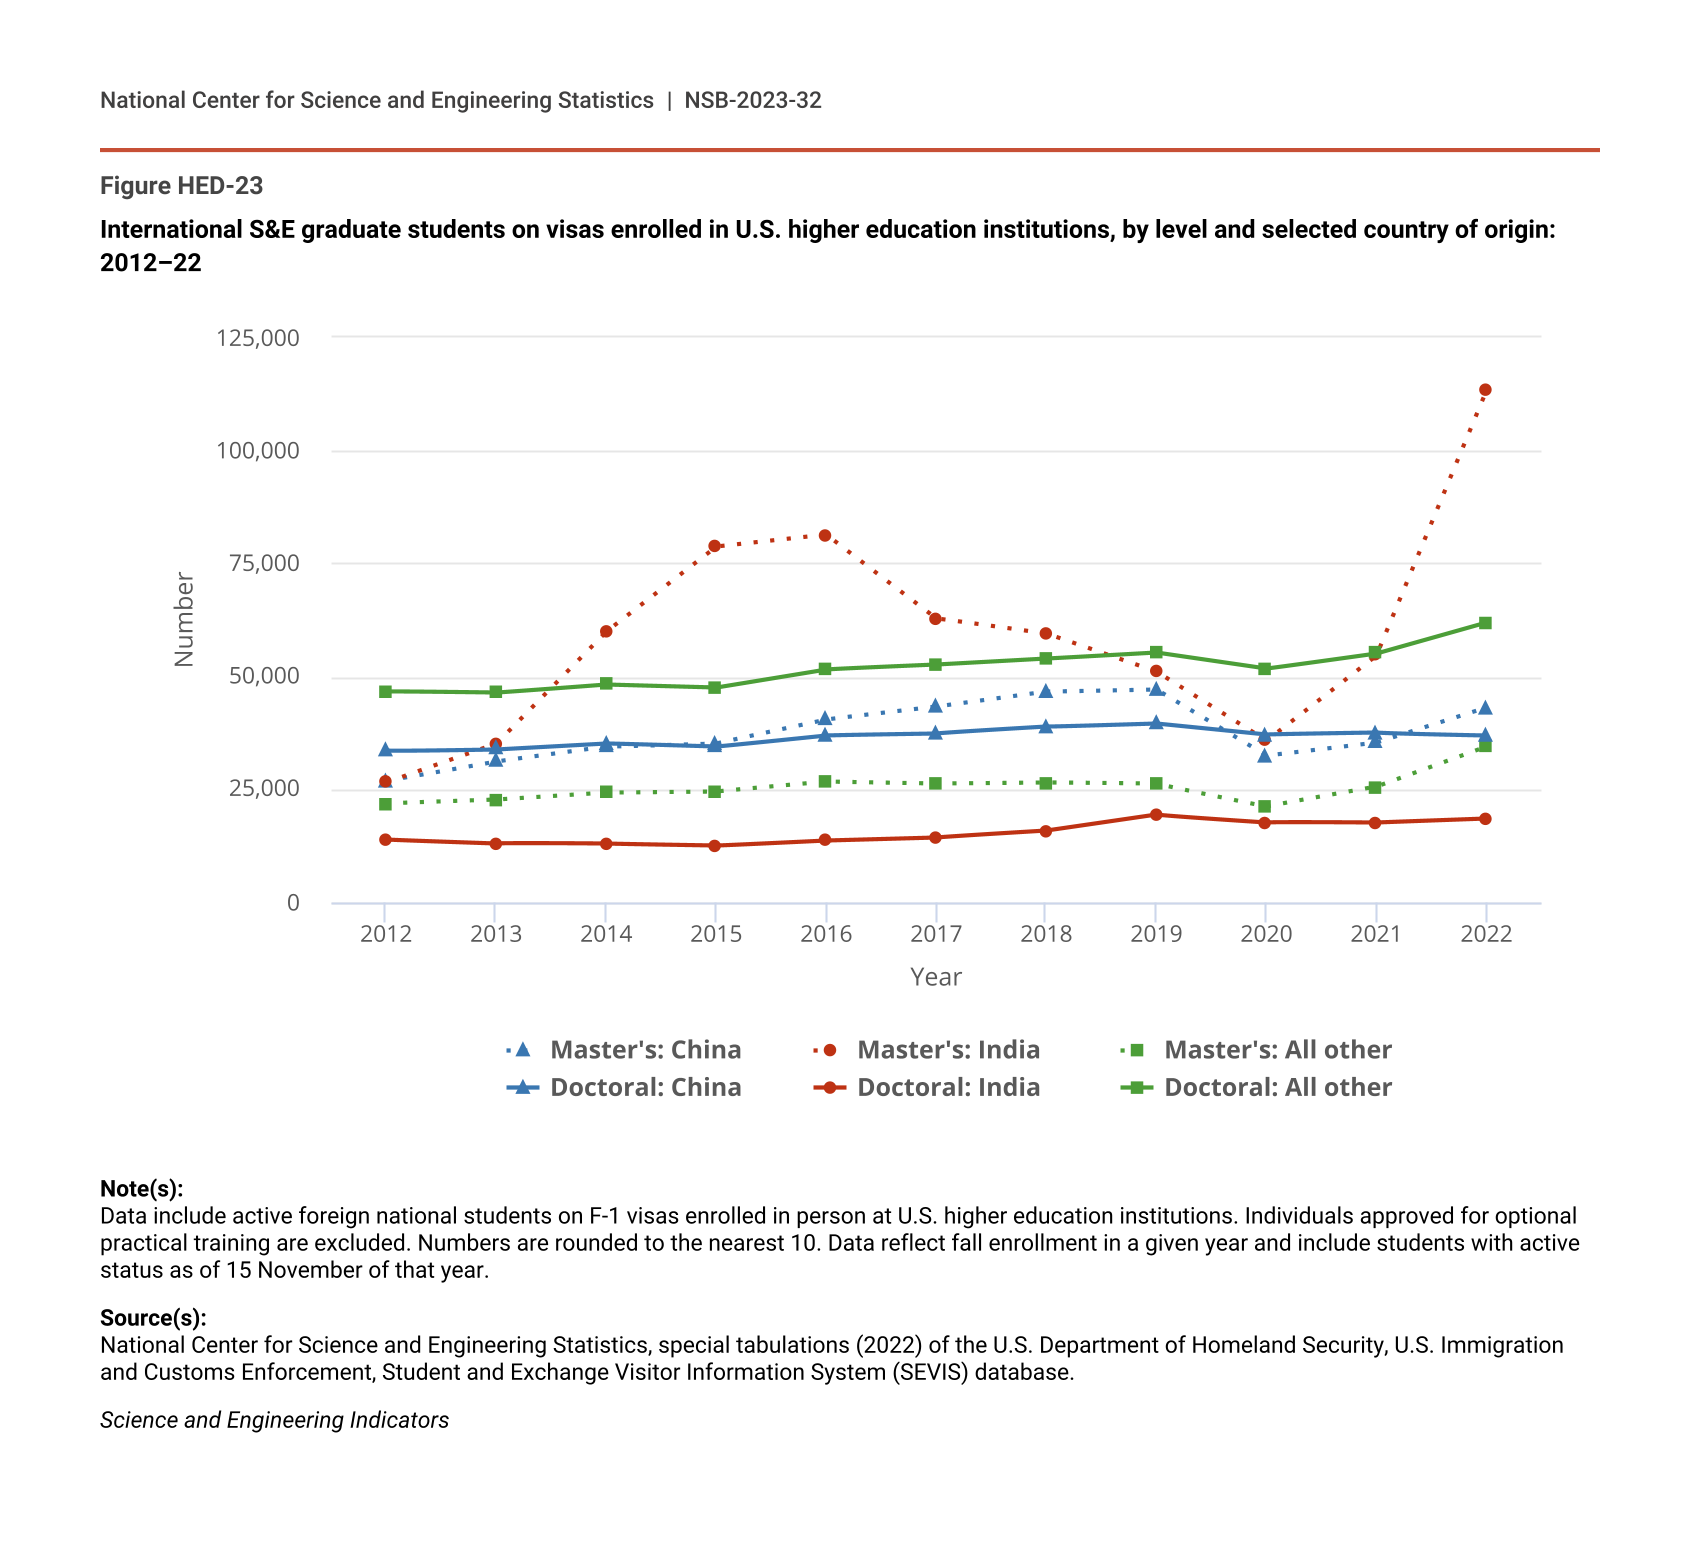
India and China are the most common countries of origin for international S&E graduate students on visas in the United States (Figure HED-23; Table SHED-16, Table SHED-17). In 2022, there were 113,000 S&E master’s students from India and 43,000 from China, each of which was higher than the number of S&E master’s students from all other countries combined (34,000). S&E graduate enrollment from India is predominantly at the master’s level and has varied dramatically in recent years. S&E master’s enrollment from India reached a pre-COVID pandemic peak of 81,000 in 2016 and then bottomed out at 36,000 in 2020; since that time, enrollment has rapidly increased to 113,000 in 2022, by far the highest level in the past decade. Enrollment of graduate students from China has also increased since 2020, but not to the same extent as enrollment of students from India. At the doctoral level, China is the most common country of origin, with 37,000 S&E doctoral students enrolled in U.S. institutions in 2022, followed by India with 18,000 (Figure HED-23).
International S&E graduate students on visas enrolled in U.S. higher education institutions, by level and selected country of origin: 2012–22
| Year | Master's: China | Master's: India | Master's: All other | Doctoral: China | Doctoral: India | Doctoral: All other |
|---|---|---|---|---|---|---|
| 2012 | 26,850 | 26,540 | 21,890 | 33,500 | 13,910 | 46,730 |
| 2013 | 31,180 | 35,100 | 22,690 | 33,910 | 13,090 | 46,410 |
| 2014 | 34,450 | 59,940 | 24,250 | 35,230 | 12,890 | 48,240 |
| 2015 | 35,210 | 78,750 | 24,500 | 34,510 | 12,500 | 47,580 |
| 2016 | 40,420 | 81,390 | 26,640 | 37,000 | 13,660 | 51,580 |
| 2017 | 43,230 | 62,910 | 26,210 | 37,370 | 14,330 | 52,580 |
| 2018 | 46,550 | 59,480 | 26,430 | 38,780 | 15,790 | 53,920 |
| 2019 | 47,050 | 51,040 | 26,160 | 39,540 | 19,340 | 55,270 |
| 2020 | 32,380 | 35,770 | 21,230 | 37,100 | 17,740 | 51,730 |
| 2021 | 35,310 | 54,690 | 25,530 | 37,470 | 17,560 | 55,120 |
| 2022 | 43,050 | 113,300 | 34,420 | 36,980 | 18,430 | 61,990 |
Note(s):
Data include active foreign national students on F-1 visas enrolled in person at U.S. higher education institutions. Individuals approved for optional practical training are excluded. Numbers are rounded to the nearest 10. Data reflect fall enrollment in a given year and include students with active status as of 15 November of that year.
Source(s):
National Center for Science and Engineering Statistics, special tabulations (2022) of the U.S. Department of Homeland Security, U.S. Immigration and Customs Enforcement, Student and Exchange Visitor Information System (SEVIS) database.
Science and Engineering Indicators
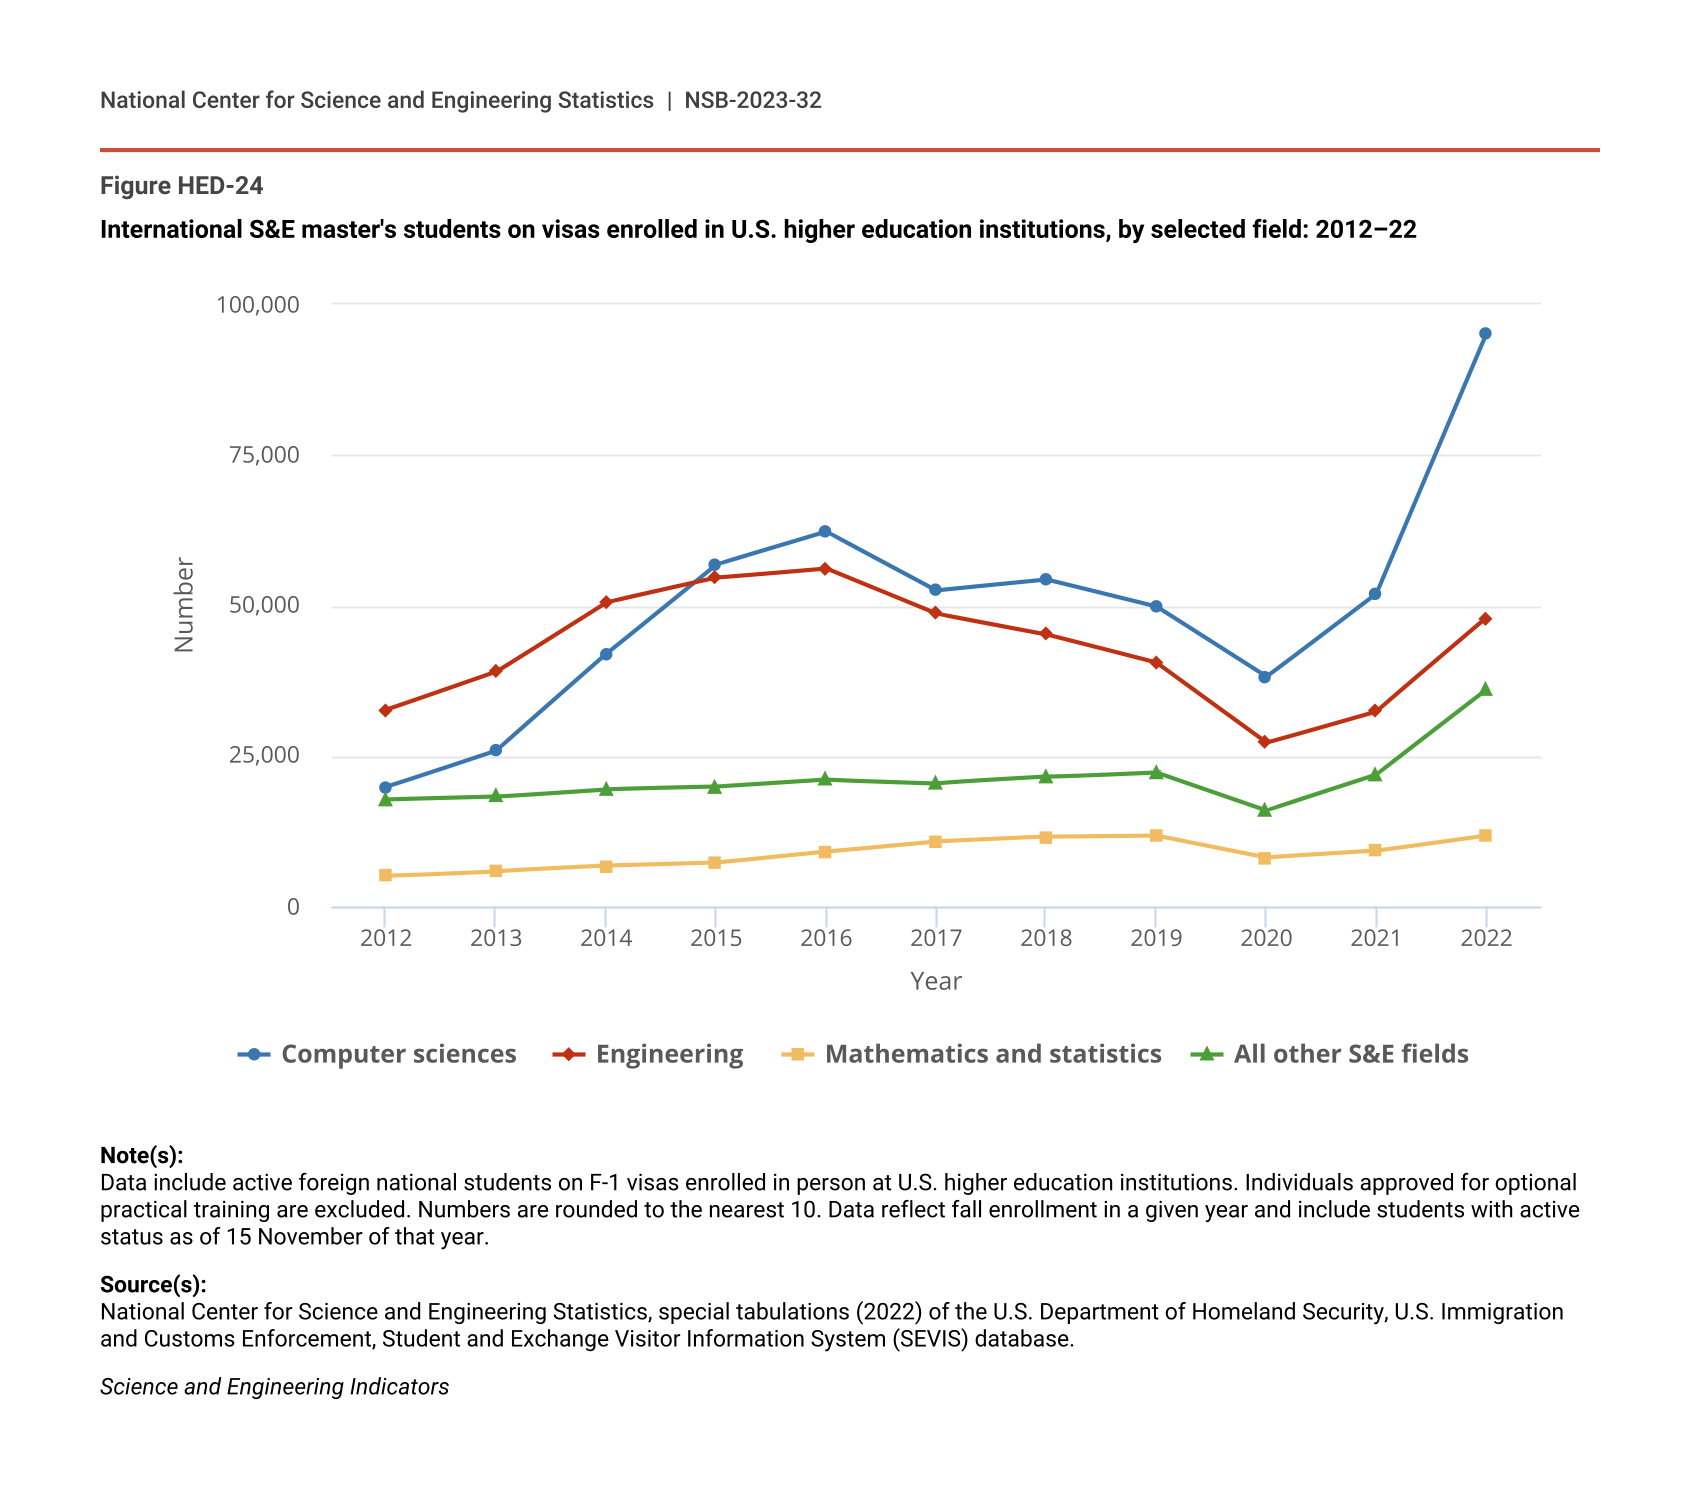
Students from India and China, who drive the overall trends for international S&E graduate student enrollment in the United States, are heavily concentrated in computer and information sciences and in engineering (Table SHED-16, Table SHED-17). Accordingly, the decrease in master’s enrollment from India and China coincided with declining numbers of students in these fields from 2016 to 2020 (Figure HED-24). Likewise, increased master’s enrollment from India and China from 2020 to 2022 has resulted in substantial increases in enrollment in these fields, especially computer and information sciences. In 2022, 72,000 (76%) of the 95,000 international master’s students studying computer and information sciences in the United States originated from India (Table SHED-16).
International S&E master's students on visas enrolled in U.S. higher education institutions, by selected field: 2012–22
| Year | Computer sciences | Engineering | Mathematics and statistics | All other S&E fields |
|---|---|---|---|---|
| 2012 | 19,830 | 32,610 | 5,050 | 17,780 |
| 2013 | 25,920 | 38,980 | 5,840 | 18,240 |
| 2014 | 41,940 | 50,520 | 6,700 | 19,470 |
| 2015 | 56,820 | 54,580 | 7,210 | 19,860 |
| 2016 | 62,250 | 56,120 | 9,050 | 21,040 |
| 2017 | 52,500 | 48,630 | 10,750 | 20,470 |
| 2018 | 54,270 | 45,190 | 11,520 | 21,480 |
| 2019 | 49,750 | 40,480 | 11,740 | 22,270 |
| 2020 | 38,090 | 27,200 | 8,110 | 15,970 |
| 2021 | 51,990 | 32,440 | 9,210 | 21,890 |
| 2022 | 95,130 | 47,900 | 11,770 | 35,950 |
Note(s):
Data include active foreign national students on F-1 visas enrolled in person at U.S. higher education institutions. Individuals approved for optional practical training are excluded. Numbers are rounded to the nearest 10. Data reflect fall enrollment in a given year and include students with active status as of 15 November of that year.
Source(s):
National Center for Science and Engineering Statistics, special tabulations (2022) of the U.S. Department of Homeland Security, U.S. Immigration and Customs Enforcement, Student and Exchange Visitor Information System (SEVIS) database.
Science and Engineering Indicators
U.S. Position in International Student Mobility
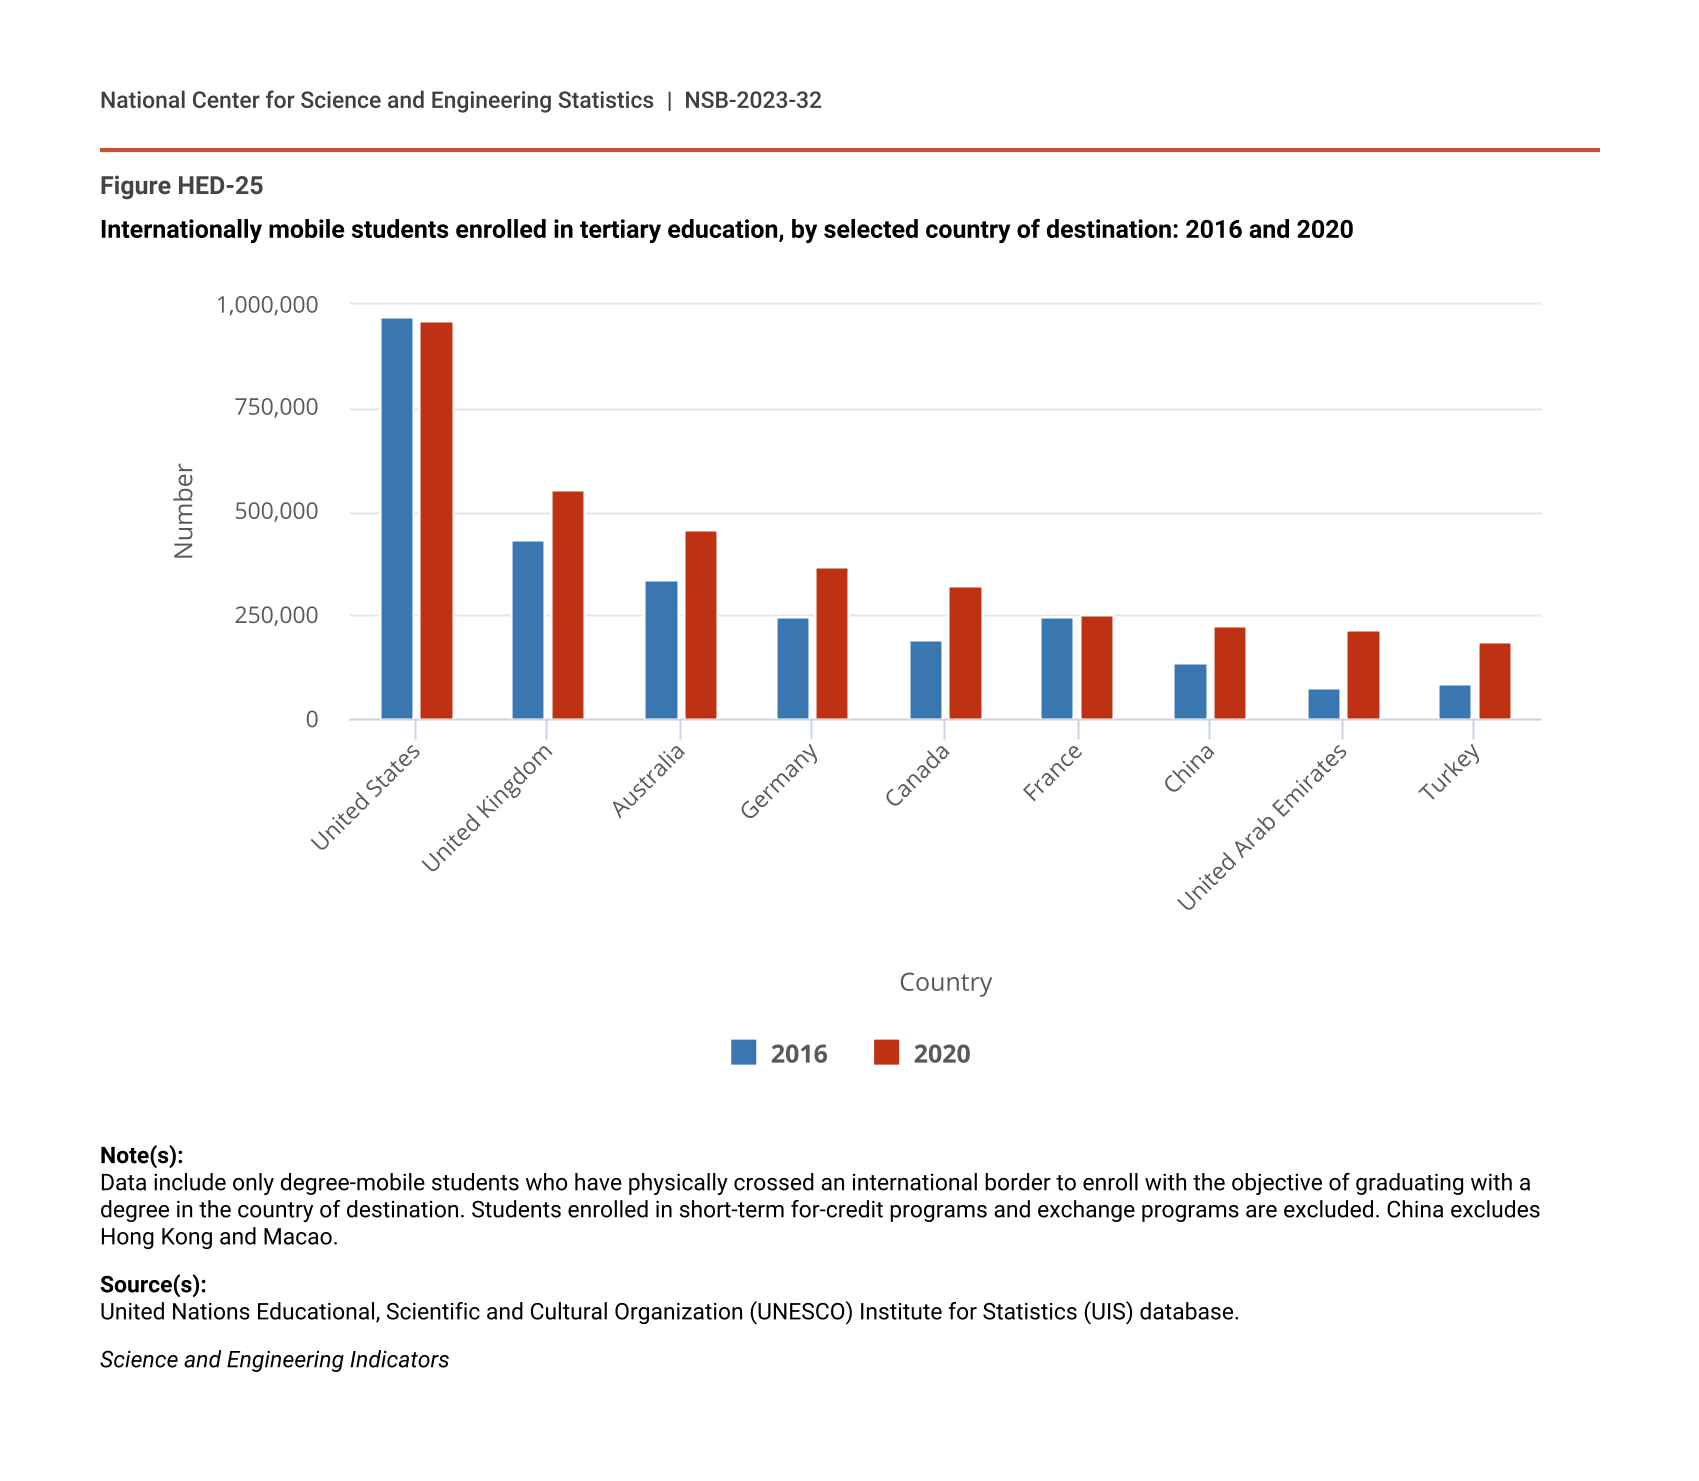
Global S&E connections and research collaboration, which can be facilitated by the international exchange of students, are areas of substantial interest to NSB (NSB 2020). The United States is the most popular destination for internationally mobile tertiary (postsecondary) students, though its share of all international students has declined (see Glossary section for definition of internationally mobile students). The United States enrolled 957,000 international students in 2020, followed by the United Kingdom (551,000), Australia (458,000), Germany (369,000), and Canada (323,000) (Figure HED-25). From 2016 to 2020, the number of international students decreased in the United States, whereas international enrollment increased in all other top countries of destination. The United States hosted 15% of all international students worldwide in 2020 (OECD 2022a), down from 17% in 2010 and 23% in 2000 (OECD 2012).
Internationally mobile students enrolled in tertiary education, by selected country of destination: 2016 and 2020
| Country | 2016 | 2020 |
|---|---|---|
| United States | 971,417 | 957,475 |
| United Kingdom | 432,001 | 550,877 |
| Australia | 335,512 | 458,279 |
| Germany | 244,575 | 368,717 |
| Canada | 189,478 | 323,157 |
| France | 245,349 | 252,444 |
| China | 137,527 | 225,100 |
| United Arab Emirates | 77,463 | 215,975 |
| Turkey | 87,903 | 185,047 |
Note(s):
Data include only degree-mobile students who have physically crossed an international border to enroll with the objective of graduating with a degree in the country of destination. Students enrolled in short-term for-credit programs and exchange programs are excluded. China excludes Hong Kong and Macao.
Source(s):
United Nations Educational, Scientific and Cultural Organization (UNESCO) Institute for Statistics (UIS) database.
Science and Engineering Indicators
International Degree Recipients
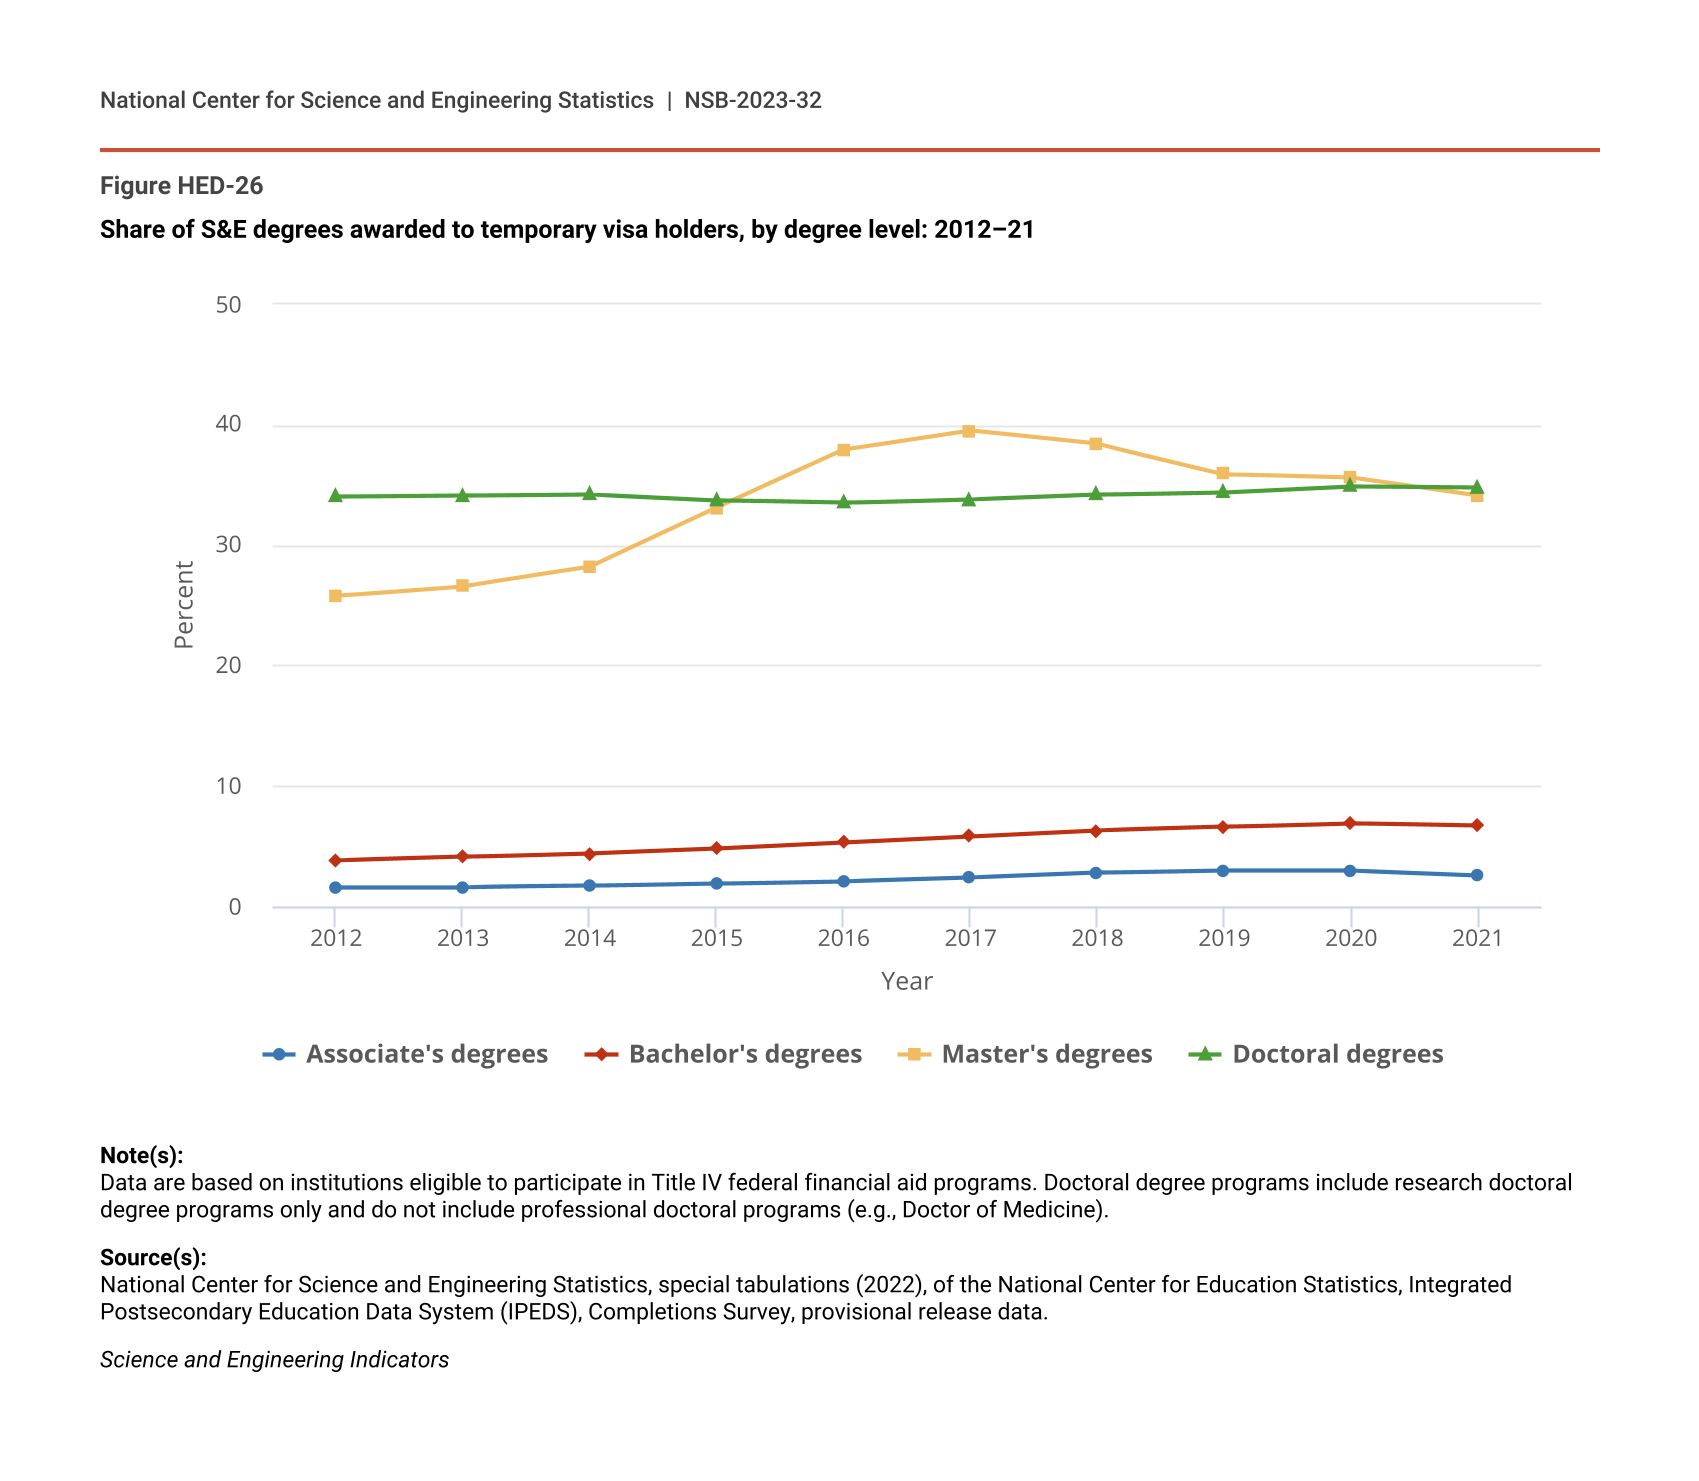
International students in the United States earn low shares of S&E postsecondary degrees at the associate’s and bachelor’s levels and much higher shares of S&E graduate degrees (Figure HED-26). In 2021, temporary visa holders earned 3% of S&E associate’s degrees, 7% of S&E bachelor’s degrees, 34% of S&E master’s degrees, and 35% of S&E doctoral degrees. The high proportion of international students among S&E advanced degree recipients and its potential consequences for the U.S. labor force has been a long-standing topic of interest among policymakers. Surveys of foreign-born S&E doctorate recipients have shown that most of these individuals intend to and ultimately do remain in the United States after graduation (for more information, see the forthcoming Indicators 2024 report “The STEM Labor Force: Scientists, Engineers, and Skilled Technical Workers” section “Stay Rates of U.S.-Trained S&E Doctorates”). The temporary visa holder share of S&E degrees has increased for all degree levels, though most substantially at the master’s level, where the share increased from 26% in 2012 to 34% in 2021—down from its peak level of 39% in 2017.
Share of S&E degrees awarded to temporary visa holders, by degree level: 2012–21
| Year | Associate's degrees | Bachelor's degrees | Master's degrees | Doctoral degrees |
|---|---|---|---|---|
| 2012 | 1.6 | 3.8 | 25.8 | 34.0 |
| 2013 | 1.6 | 4.1 | 26.6 | 34.1 |
| 2014 | 1.7 | 4.4 | 28.2 | 34.2 |
| 2015 | 1.9 | 4.8 | 33.1 | 33.7 |
| 2016 | 2.1 | 5.3 | 37.9 | 33.5 |
| 2017 | 2.4 | 5.8 | 39.5 | 33.8 |
| 2018 | 2.8 | 6.3 | 38.4 | 34.2 |
| 2019 | 3.0 | 6.6 | 35.9 | 34.4 |
| 2020 | 3.0 | 6.9 | 35.6 | 34.9 |
| 2021 | 2.6 | 6.7 | 34.1 | 34.8 |
Note(s):
Data are based on institutions eligible to participate in Title IV federal financial aid programs. Doctoral degree programs include research doctoral degree programs only and do not include professional doctoral programs (e.g., Doctor of Medicine).
Source(s):
National Center for Science and Engineering Statistics, special tabulations (2022), of the National Center for Education Statistics, Integrated Postsecondary Education Data System (IPEDS), Completions Survey, provisional release data.
Science and Engineering Indicators
Postsecondary degree recipients on temporary visas are more concentrated in S&E fields than U.S. citizens and permanent residents are, especially at advanced degree levels. In 2021, at the master’s level, 57% of temporary visa holders earned degrees in S&E fields, compared to 19% of U.S. citizens and permanent residents (Table SHED-13); at the doctoral level, the vast majority (83%) of temporary visa holders earned degrees in S&E fields compared to 59% of U.S. citizens and permanent residents (Table SHED-14). The overall high representation of temporary visa holders among S&E advanced degree recipients varies greatly by S&E field. In 2021, temporary visa holders earned 7% of doctoral degrees in psychology and more than half of doctoral degrees in computer and information sciences (59%), engineering (60%), and mathematics and statistics (54%) (Table SHED-14). Temporary visa holders also accounted for about half of the master’s degrees awarded in each of these three fields (Table SHED-13).
Countries of Origin for Research Doctorate Recipients
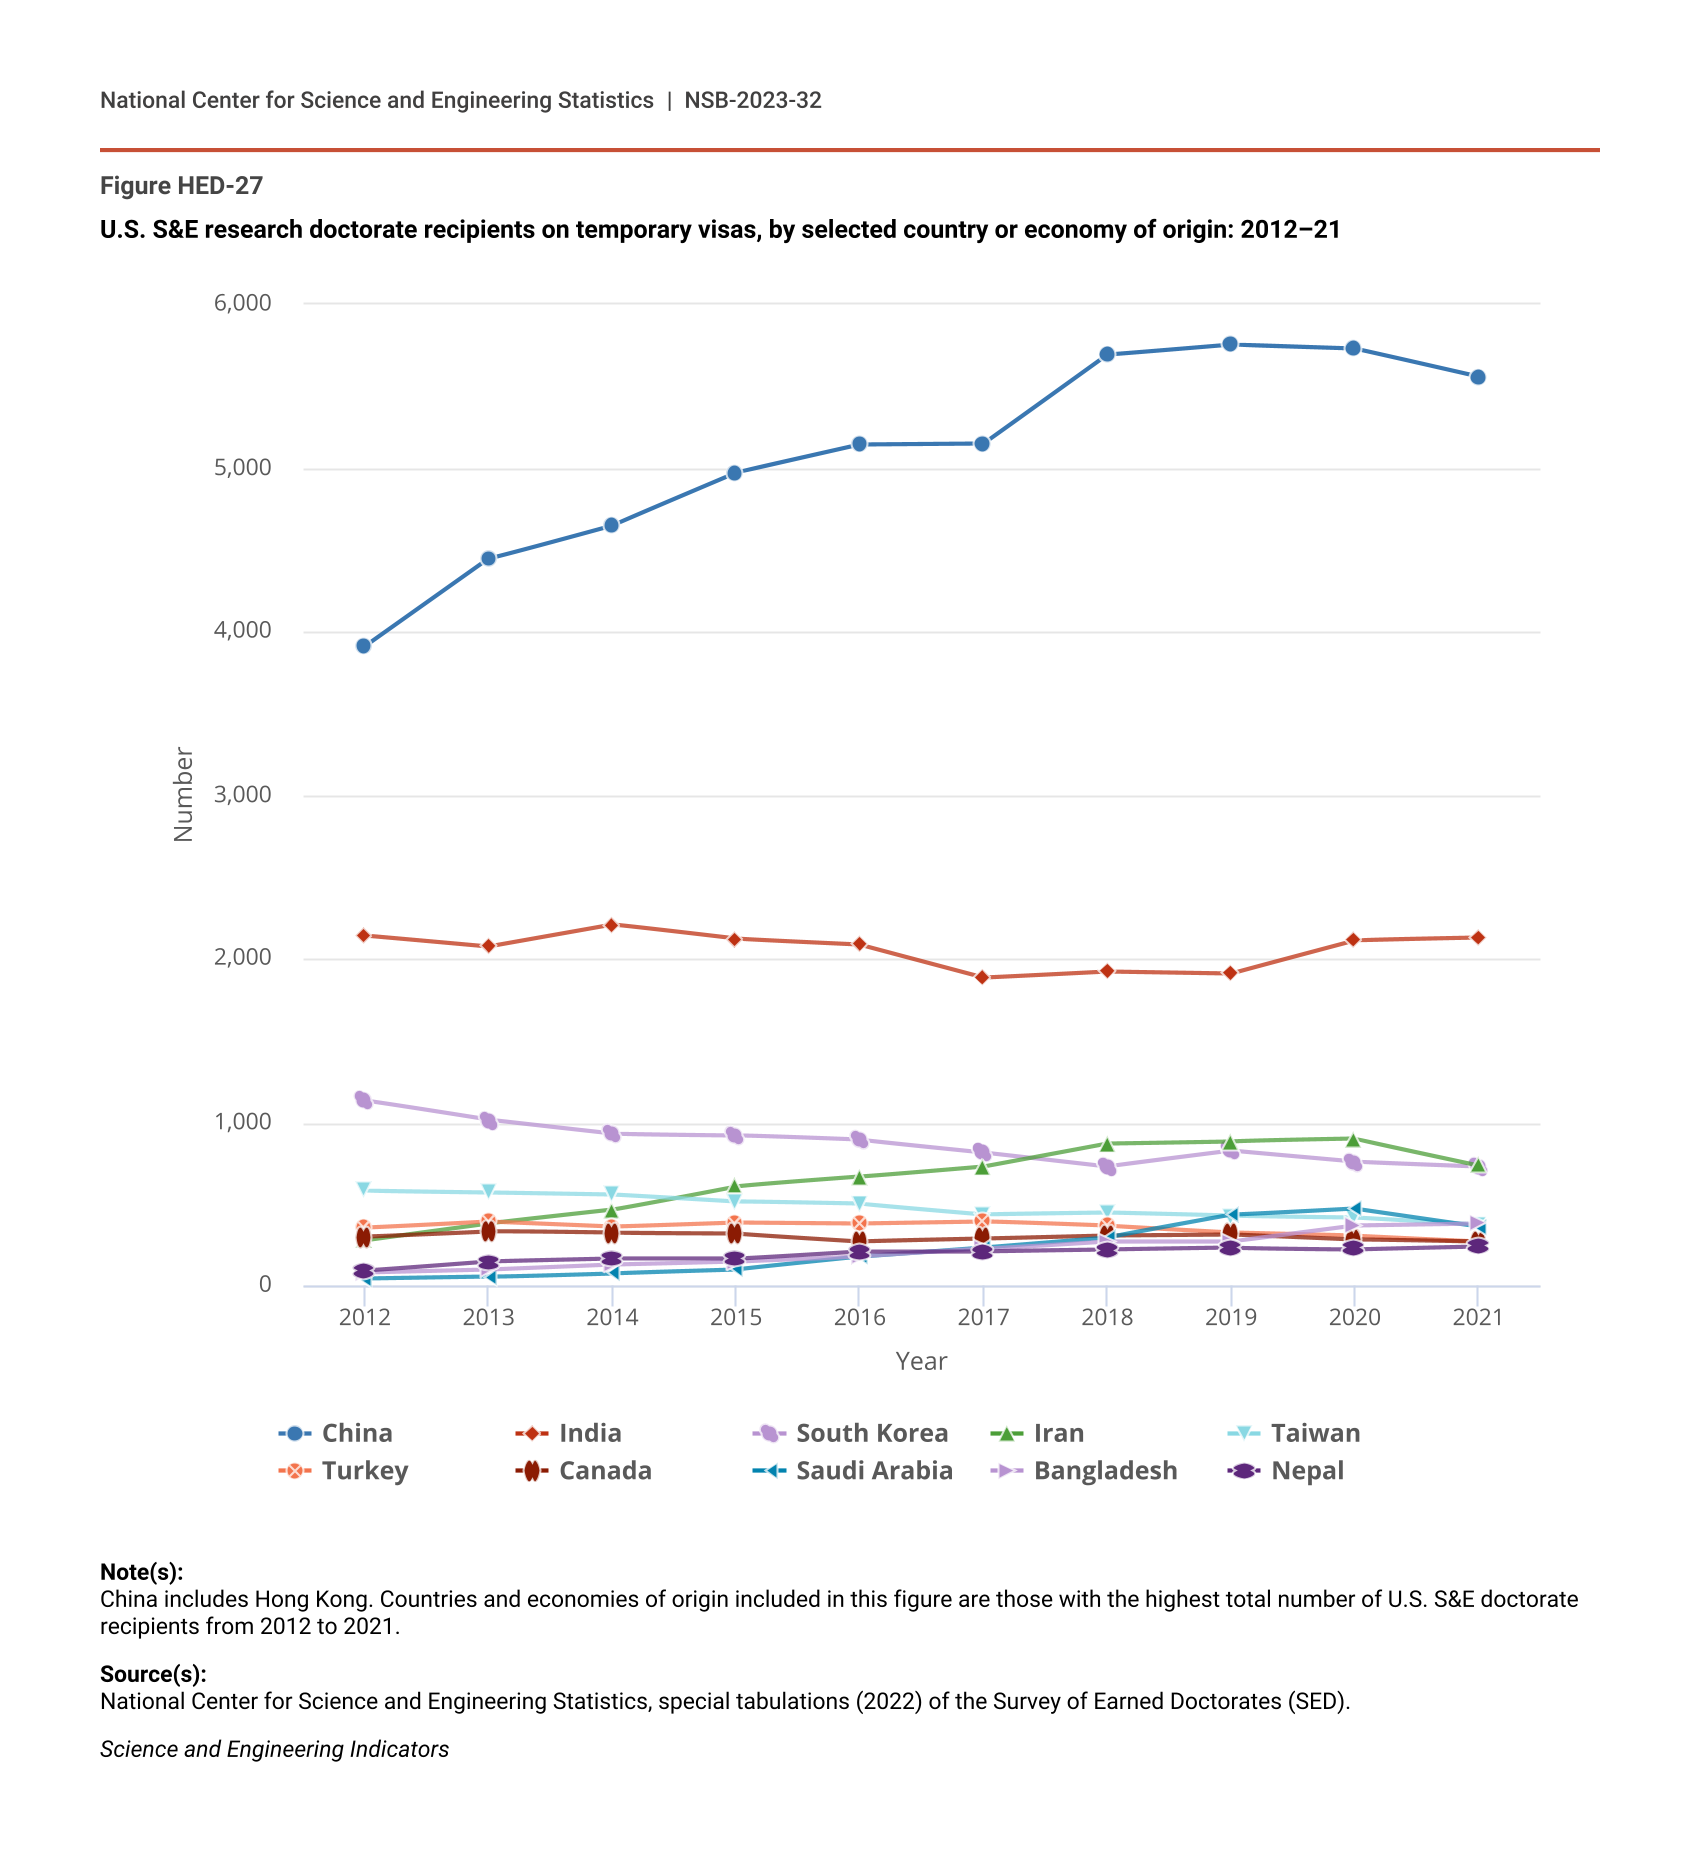
Over the last decade, China and India have consistently been the top countries of origin for U.S. S&E research doctorate recipients on temporary visas (Figure HED-27). S&E doctorate recipients from China increased from 3,900 in 2012 to 5,600 in 2021, which was slightly lower than the pre-pandemic high in 2019. In contrast, S&E doctorate recipients from India remained relatively flat over this period, numbering around 2,000 each year. S&E doctorate recipients from Iran experienced rapid growth (164% increase) from less than 300 recipients in 2012 to more than 700 recipients in 2021, surpassing the number from South Korea, which has declined.
U.S. S&E research doctorate recipients on temporary visas, by selected country or economy of origin: 2012–21
| Year | China | India | South Korea | Iran | Taiwan | Turkey | Canada | Saudi Arabia | Bangladesh | Nepal |
|---|---|---|---|---|---|---|---|---|---|---|
| 2012 | 3,906 | 2,142 | 1,132 | 278 | 581 | 352 | 299 | 41 | 78 | 89 |
| 2013 | 4,443 | 2,074 | 1,012 | 380 | 571 | 391 | 332 | 53 | 96 | 146 |
| 2014 | 4,650 | 2,208 | 928 | 463 | 558 | 360 | 321 | 76 | 127 | 163 |
| 2015 | 4,970 | 2,119 | 920 | 608 | 514 | 386 | 318 | 98 | 146 | 162 |
| 2016 | 5,141 | 2,085 | 891 | 664 | 499 | 380 | 272 | 175 | 178 | 208 |
| 2017 | 5,147 | 1,884 | 815 | 728 | 435 | 392 | 288 | 232 | 224 | 209 |
| 2018 | 5,692 | 1,922 | 729 | 869 | 445 | 364 | 307 | 294 | 271 | 219 |
| 2019 | 5,755 | 1,910 | 824 | 882 | 426 | 324 | 313 | 431 | 271 | 230 |
| 2020 | 5,731 | 2,111 | 757 | 896 | 417 | 305 | 281 | 471 | 369 | 223 |
| 2021 | 5,558 | 2,126 | 729 | 735 | 373 | 271 | 266 | 362 | 381 | 240 |
Note(s):
China includes Hong Kong. Countries and economies of origin included in this figure are those with the highest total number of U.S. S&E doctorate recipients from 2012 to 2021.
Source(s):
National Center for Science and Engineering Statistics, special tabulations (2022) of the Survey of Earned Doctorates (SED).
Science and Engineering Indicators