 An official website of the United States government
Microbusinesses Had More Than $6.7 billion in R&D Costs in the United States in 2017, According to New Annual Business Survey
Microbusinesses contribute to the U.S. economy by bringing growth and innovation and being more adaptable to changes. However, relatively little is known about the R&D activities of these businesses. This InfoBrief presents R&D and other data on microbusinesses, defined here as those with one to nine domestic employees. In 2017, microbusinesses spent $6.7 billion on research and development costs in the United States (table 1), of which $5.7 billion was performed by the microbusinesses themselves (table 2).
Data for this InfoBrief are from the inaugural Annual Business Survey (ABS), developed and cosponsored by the National Center for Science and Engineering Statistics within the National Science Foundation and by the U.S. Census Bureau. The ABS is the primary source of information on R&D expenditures for microbusinesses. The ABS also collects data related to innovation, intellectual property, technology, and business owner characteristics from businesses with one or more employees. Data from selected industries are highlighted in this InfoBrief.
The ABS combines multiple surveys that were previously separate: the Survey of Business Owners, the Annual Survey of Entrepreneurs, the 2016 Microbusiness R&D and Innovation Survey, and an innovation survey modeled on Eurostat’s Community Innovation Survey. This InfoBrief and related data tables are the result of the collaboration on the ABS between the National Center for Science and Engineering Statistics and the U.S. Census Bureau.
Total R&D cost for companies with 1–9 employees, by selected industry and type of R&D: 2017
r = relative standard error > 50%; S = data withheld to avoid disclosing operations of individual companies.
NAICS = 2017 North American Industry Classification System.
Note(s):
Detail may not add to total because of rounding. Industry classification based on dominant establishment payroll. Statistics are representative of microbusinesses located in the United States that performed or funded R&D.
Source(s):
National Center for Science and Engineering Statistics and U.S. Census Bureau, Annual Business Survey, 2017.
Total R&D performance and cost for companies with 1–9 employees, by selected industry and type of cost: 2017
r = relative standard error > 50%; S = data withheld to avoid disclosing operations of individual companies.
NAICS = 2017 North American Industry Classification System.
Note(s):
Detail may not add to total because of rounding. Industry classification based on dominant establishment payroll. Statistics are representative of microbusinesses located in the United States that performed or funded R&D.
Source(s):
National Center for Science and Engineering Statistics and U.S. Census Bureau, Annual Business Survey, 2017.
Characteristics of Microbusiness R&D
By Industry
Microbusiness R&D is highly concentrated within a few industries. In 2017, microbusinesses in the United States spent $6.7 billion on R&D costs (table 1). Of this total, nonmanufacturing industries accounted for $5.9 billion in R&D (89% overall).
The ABS found that three-quarters (76%) of all microbusiness R&D costs in 2017 were incurred by microbusinesses classified as professional, scientific, and technical services (North American Industry Classification System [NAICS] code 54). The NAICS 54 sector includes the following three R&D intensive industries: architectural, engineering, and related services (NAICS 5413), computer systems design and related services (NAICS 5415), and scientific research and development services (NAICS 5417).
By Type
There are three types of R&D: basic research, applied research, and development. More than one-half (53%) of microbusiness R&D in 2017 was spent on development, 34% on applied research, and 14% on basic research (table 1). These proportions were nearly identical for both manufacturing and nonmanufacturing sectors. Only four industries spent more than one-half of their R&D on applied research: food, beverage, and tobacco products (52%, NAICS 311–12), chemicals, excluding pharmaceuticals (56%, NAICS 325 excluding 3254), plastics and rubber products (63%, NAICS 326), and electrical equipment, appliances, and components (50%, NAICS 335). Only wholesale trade (NAICS 42) spent more than one-quarter (30%) of their R&D on basic research.
By Source of Funds
Four-fifths (80%) of the funding for microbusiness R&D was from the companies’ own funds; 11% was from federal, state, or local governments combined; and 5% came from other businesses (including businesses located within and outside the United States) (table 3). In the architectural, engineering, and related services industry (NAICS 5413), 61% of their R&D was self-funded and 24% was funded by federal, state, or local governments combined. In the scientific research and development services (NAICS 5417), 68% of their R&D was self-funded and 20% was funded by federal, state, or local governments combined. Almost two-thirds (64%) of all government funding ($718 million) for microbusiness R&D went to companies in the scientific research and development industry group (NAICS 5417).
By State
Microbusiness R&D is concentrated within a small number of states. Five states (California, New York, Massachusetts, Texas, and Florida) accounted for one-half of all microbusiness R&D in 2017 (table 4). California led all states in R&D activity, accounting for 28% of the U.S. microbusiness R&D total. In each of these five states, self-funding accounted for approximately four-fifths of R&D sources of support. Self-funding accounted for 89% of R&D support for microbusinesses located in Florida.
Whereas $1 out of every $9 (11%) in microbusiness R&D in the United States is funded by federal, state, or local governments combined, microbusinesses in several states received a considerably larger share of its R&D dollars from government: Microbusinesses in Kentucky receive 31%, Montana 30%, and Indiana 29% of their R&D funding from these government sources combined. However, these states are not R&D-intensive states, with R&D in each state accounting for less than 1% of the $6.7 billion in microbusiness R&D costs in the United States.
Total R&D cost for companies with 1–9 employees, by selected industry and source of funds: 2017
r = relative standard error > 50%; S = data withheld to avoid disclosing operations of individual companies.
NAICS = 2017 North American Industry Classification System.
Note(s):
Detail may not add to total because of rounding. Industry classification based on dominant establishment payroll. Statistics are representative of microbusinesses located in the United States that performed or funded R&D.
Source(s):
National Center for Science and Engineering Statistics and U.S. Census Bureau, Annual Business Survey, 2017.
Total R&D cost for companies with 1–9 employees, by state and source of funds: 2017
r = relative standard error > 50%; S = data withheld to avoid disclosing operations of individual companies.
Note(s):
Detail may not add to total because of rounding. Statistics are representative of microbusinesses located in the United States that performed or funded R&D.
Source(s):
National Center for Science and Engineering Statistics and U.S. Census Bureau, Annual Business Survey, 2017.
By Demographics
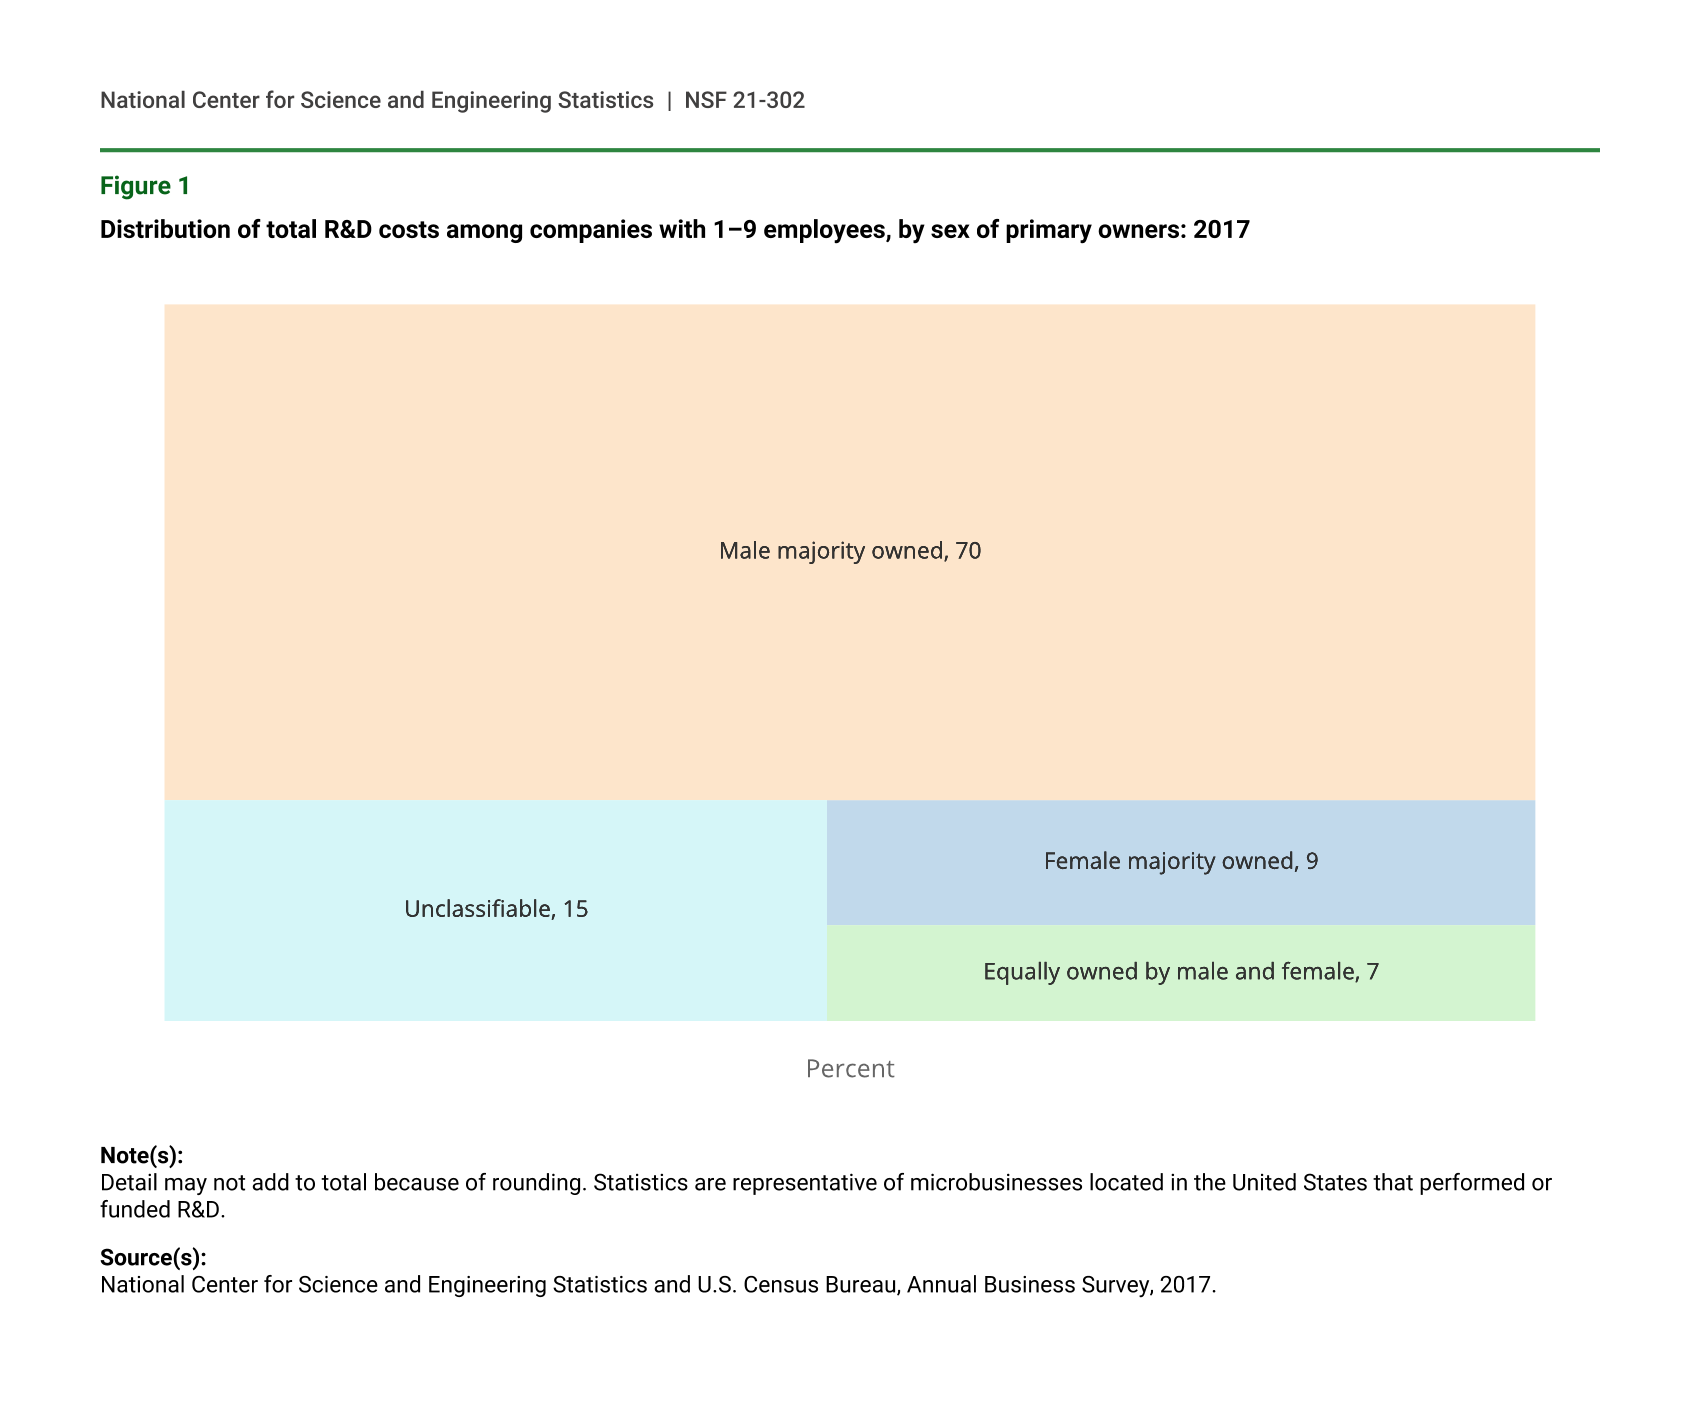
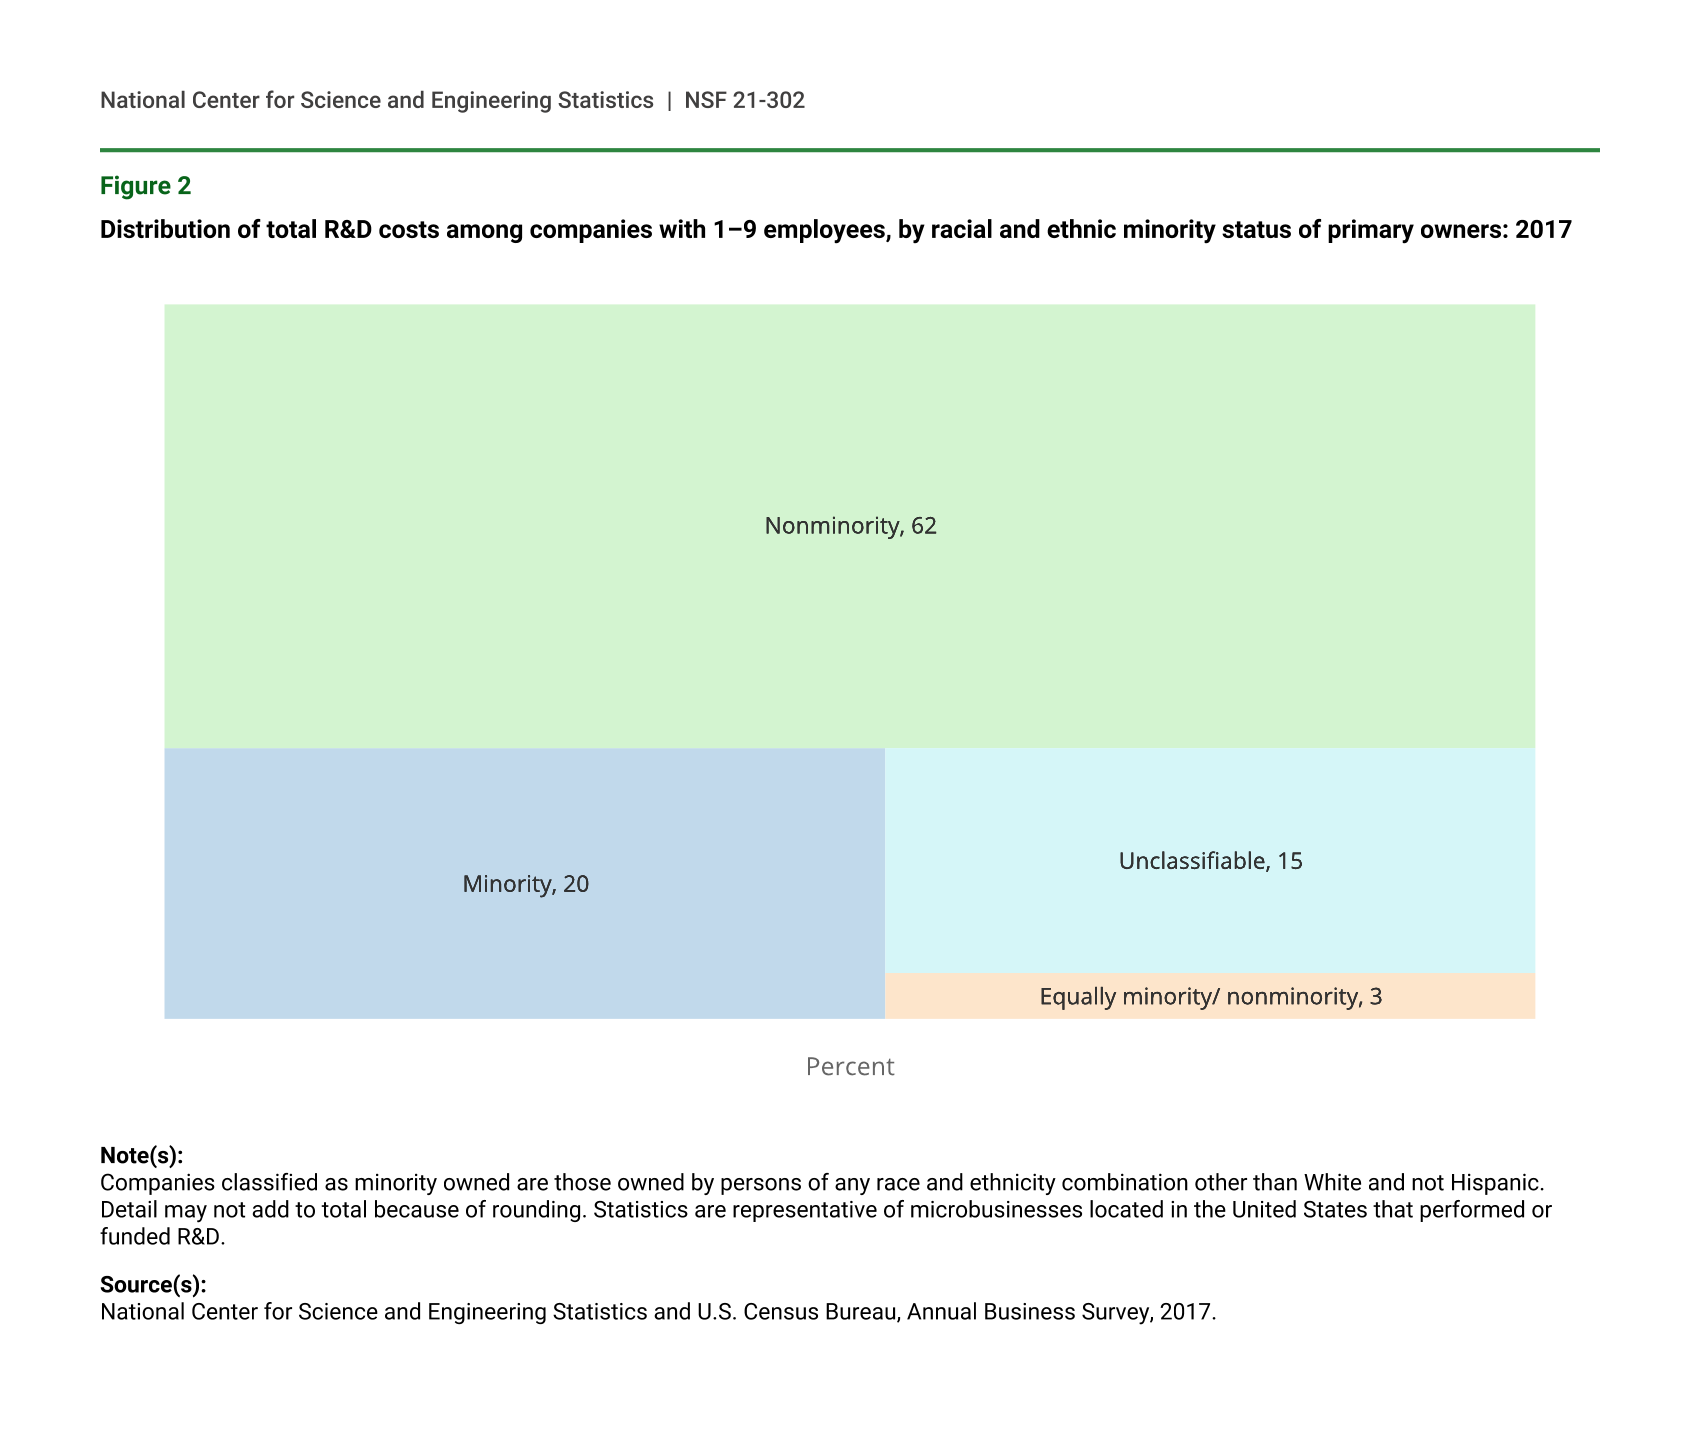
Seventy percent of R&D costs were in microbusinesses that are male majority owned (figure 1). Female majority-owned microbusinesses accounted for 9% of R&D, and microbusinesses that are equally owned by men and women accounted for 7% of R&D costs. Almost two-thirds (62%) of R&D costs are spent by microbusinesses that are primarily owned by persons who are White and not Hispanic (non-minority owners) (figure 2). Companies that are primarily owned by persons of a racial or ethnic minority group (any race and ethnicity combination other than White and not Hispanic) accounted for 20% of microbusinesses R&D costs in 2017.
Distribution of total R&D costs among companies with 1–9 employees, by sex of primary owners: 2017
| Sex of owners | Distribution of total R&D cost |
|---|---|
| Female majority owned | 9 |
| Male majority owned | 70 |
| Equally owned by male and female | 7 |
| Unclassifiable | 15 |
Note(s):
Detail may not add to total because of rounding. Statistics are representative of microbusinesses located in the United States that performed or funded R&D.
Source(s):
National Center for Science and Engineering Statistics and U.S. Census Bureau, Annual Business Survey, 2017.
Distribution of total R&D costs among companies with 1–9 employees, by racial and ethnic minority status of primary owners: 2017
| Minority status of owners | Distribution of total R&D cost |
|---|---|
| Minority | 20 |
| Equally minority/ nonminority | 3 |
| Nonminority | 62 |
| Unclassifiable | 15 |
Note(s):
Companies classified as minority owned are those owned by persons of any race and ethnicity combination other than White and not Hispanic. Detail may not add to total because of rounding. Statistics are representative of microbusinesses located in the United States that performed or funded R&D.
Source(s):
National Center for Science and Engineering Statistics and U.S. Census Bureau, Annual Business Survey, 2017.
R&D by Type of Costs and R&D Performance
Over one-half (55%) of R&D costs were for salaries, wages, and fringe benefits; 9% each was used for materials and supplies and for purchasing R&D services; 5% was for payment to collaborative partners; and 4% was used for machinery and equipment (table 2). An additional 17% of R&D costs was for other expenses. Software publishers (NAICS 5112) and computer systems design and related services (NAICS 5415) spent 73% and 71%, respectively, of their R&D on salaries, wages, and fringe benefits. Pharmaceuticals and medicines (NAICS 3254) spent only 31% of their R&D dollars on salaries, wages, and benefits; 18% on materials and supplies; and 17% on purchasing R&D services.
Of the $6.7 billion in R&D costs for microbusinesses, $5.7 billion (85%) were for R&D performance by the companies themselves. R&D performance is equal to total R&D costs minus payments to other businesses partners for collaborative R&D and minus costs for purchased R&D services.
Total Employment and R&D Employees
There were approximately 45,000 domestic R&D employees working for microbusinesses in 2017 (table 5), and 87% of those employees were in nonmanufacturing microbusinesses. This proportion is close to the proportion of total R&D costs that were spent by nonmanufacturing businesses. Among all domestic R&D employees, 46% worked in the computer systems design and related services industry (NAICS 5415) and 23% worked in the scientific research and development services industry (NAICS 5417).
R&D employee occupations included the following: researchers (including R&D scientists, engineers, and their managers), R&D technicians and equivalent staff, and R&D support staff (clerical and other). Among domestic R&D employees only, nearly two-thirds (64%) were researchers, 27% were R&D technicians, and the remaining 9% were R&D support staff. Almost one-quarter (23%) of the domestic researchers have doctoral degrees.
Domestic R&D employees working for companies with 1–9 employees, by selected industry and R&D occupation: 2017
r = relative standard error > 50%; S = data withheld to avoid disclosing operations of individual companies.
NAICS = 2017 North American Industry Classification System.
Note(s):
Detail may not add to total because of rounding. Statistics are representative of microbusinesses located in the United States that performed or funded R&D.
Source(s):
National Center for Science and Engineering Statistics and U.S. Census Bureau, Annual Business Survey, 2017.
Survey Information and Data Availability
In this InfoBrief, R&D costs are expressed in current U.S. dollars and are not adjusted for inflation. In the ABS, a microbusiness is defined as a business organization located in the United States, either U.S. owned or a U.S. affiliate of a foreign parent company, of one or more establishments under common ownership or control with one to nine domestic employees.
The survey was administered to companies regardless of whether they were known to have R&D activity. The ABS collected detailed statistics from businesses located in the United States on R&D expenditures, R&D employees, intellectual property, company and primary owner characteristics, and innovation activities.
Only microbusinesses (those with one to nine employees) are asked the R&D questions and only information from those microbusinesses are presented in this InfoBrief.
The statistics from the survey are based on a sample, and as such, they are subject to both sampling and nonsampling errors (see technical notes in the data tables report Annual Business Survey: 2017 that will be available at https://www.nsf.gov/statistics/srvyabs/). Microbusinesses with less than $50,000 in R&D are excluded from the ABS national estimates and this InfoBrief. This amounted to an estimated $200 million being excluded.
For the microbusiness population, approximately 580,000 microbusinesses were sampled to represent the population of 3.5 million microbusinesses. The unit response rate for businesses eligible to report the R&D module was 69.4%. For the full 2017 Annual Business Survey, a total of 849,970 employer companies were sampled to represent the population of 5.3 million employer companies. For the full 2017 ABS, the unit response rate was 69.0%.
The full set of data tables on R&D, company demographics, innovation, technology, and patent and intellectual property protection from this survey will be available in the report Annual Business Survey: 2017 (https://www.nsf.gov/statistics/srvyabs/). Individual data tables and tables with relative standard errors and imputation rates from the 2017 survey are available in advance of the full report.
Notes
1For a discussion of the relation among company size, R&D performance, and innovation, see Knott AM and Vieregger C. 2020. Reconciling the firm size and innovation puzzle. Center for Economic Studies. Available at https://www2.census.gov/ces/wp/2016/CES-WP-16-20.pdf.
2Employees are individuals who worked for the business and received a W-2 issued by the business for salary or wages.
3R&D costs include the amount of money that businesses spent of their own money and from other sources on R&D performance, plus the amount that they paid others to perform R&D. Most of the statistics reported here, and collected by the inaugural ABS survey, are for R&D costs. Table 2 provides industry-specific R&D performance totals.
4R&D questions were asked only of manufacturing industries and certain selected nonmanufacturing industries. Previous NCSES surveys (Microbusiness R&D and Innovation Survey and Business R&D and Innovation Survey) found that these groups represented almost all R&D of microbusinesses in the United States.
5As defined by the Frascati Manual (Organisation for Economic Co-operation and Development. 2015. Frascati Manual 2015: Guidelines for Collecting and Reporting Data on Research and Experimental Development, The Measurement of Scientific, Technological and Innovation Activities. OECD Publishing, Paris.), basic research is experimental or theoretical work undertaken primarily to acquire new knowledge of the underlying foundations of phenomena and observable facts, without any particular application or use in view. Applied research is original investigation undertaken to acquire new knowledge. It is, however, directed primarily toward a specific, practical aim or objective. Development is systematic work, drawing on knowledge gained from research and practical experience and producing additional knowledge, which is directed to producing new products or processes or to improving existing products or processes.
Suggested Citation
Kindlon A; National Center for Science and Engineering Statistics (NCSES). 2020. Microbusinesses Had More Than $6.7 billion in R&D Costs in the United States in 2017, According to New Annual Business Survey. NSF 21-302. Alexandria, VA: National Science Foundation. Available at https://ncses.nsf.gov/pubs/nsf21302/.
Contact Us
NCSES
National Center for Science and Engineering Statistics
Directorate for Social, Behavioral and Economic Sciences
National Science Foundation
2415 Eisenhower Avenue, Suite W14200
Alexandria, VA 22314
Tel: (703) 292-8780
FIRS: (800) 877-8339
TDD: (800) 281-8749
E-mail: ncsesweb@nsf.gov