 An official website of the United States government
Universities Report 5.7% Growth in R&D Spending in FY 2019, Reaching $84 Billion
Total R&D expenditures at U.S. academic institutions reached $83.7 billion in FY 2019, an increase of almost $4.5 billion (5.7%) from FY 2018 (table 1). R&D expenditures funded from federal and nonfederal sources have risen in both current and constant dollars for four straight years (figure 1). Consequently, from FY 2015 to FY 2019, total R&D expenditures increased 13% in constant dollars, with federal sources up 10% and nonfederal sources up 18%. The data discussed in this report are from the Higher Education Research and Development (HERD) Survey, sponsored by the National Center for Science and Engineering Statistics (NCSES) within the National Science Foundation (NSF). For more information on the survey, see “Data Sources, Limitations, and Availability.”
Higher education R&D expenditures, by source of funds: FYs 2011–19
Note(s):
Because of rounding, detail may not add to total. Includes all institutions surveyed in the fiscal years shown.
Source(s):
National Center for Science and Engineering Statistics, Higher Education Research and Development Survey.
Higher education R&D expenditures, by source of funds: FYs 1972–2019
| Fiscal year | All R&D | Federally funded | Nonfederally funded |
|---|---|---|---|
| 1972 | 11.1 | 7.6 | 3.5 |
| 1973 | 11.5 | 7.9 | 3.6 |
| 1974 | 11.1 | 7.4 | 3.6 |
| 1975 | 11.4 | 7.7 | 3.8 |
| 1976 | 11.8 | 8.0 | 3.9 |
| 1977 | 12.2 | 8.1 | 4.0 |
| 1978 | 12.9 | 8.5 | 4.4 |
| 1979 | 13.8 | 9.3 | 4.6 |
| 1980 | 14.3 | 9.7 | 4.6 |
| 1981 | 14.8 | 9.9 | 4.9 |
| 1982 | 14.9 | 9.7 | 5.2 |
| 1983 | 15.4 | 9.8 | 5.7 |
| 1984 | 16.3 | 10.3 | 6.0 |
| 1985 | 17.8 | 11.1 | 6.6 |
| 1986 | 19.6 | 12.1 | 7.6 |
| 1987 | 21.3 | 12.9 | 8.4 |
| 1988 | 22.8 | 13.9 | 8.9 |
| 1989 | 24.4 | 14.7 | 9.8 |
| 1990 | 25.6 | 15.1 | 10.4 |
| 1991 | 26.7 | 15.6 | 11.2 |
| 1992 | 28.0 | 16.5 | 11.5 |
| 1993 | 29.0 | 17.4 | 11.6 |
| 1994 | 29.9 | 18.0 | 11.9 |
| 1995 | 30.9 | 18.6 | 12.3 |
| 1996 | 31.5 | 18.9 | 12.6 |
| 1997 | 32.7 | 19.2 | 13.5 |
| 1998 | 34.4 | 20.1 | 14.2 |
| 1999 | 36.1 | 21.1 | 15.0 |
| 2000 | 38.5 | 22.5 | 16.1 |
| 2001 | 41.1 | 24.1 | 17.0 |
| 2002 | 44.9 | 27.0 | 17.9 |
| 2003 | 50.2 | 30.7 | 18.6 |
| 2004 | 52.9 | 33.4 | 18.4 |
| 2005 | 54.4 | 34.3 | 19.0 |
| 2006 | 55.1 | 34.3 | 19.6 |
| 2007 | 55.8 | 33.8 | 20.6 |
| 2008 | 57.4 | 34.0 | 21.9 |
| 2009 | 60.3 | 35.2 | 23.5 |
| 2010 | 63.8 | 39.0 | 24.8 |
| 2011 | 66.5 | 41.5 | 25.0 |
| 2012 | 65.9 | 40.2 | 25.7 |
| 2013 | 66.0 | 38.8 | 27.2 |
| 2014 | 65.0 | 36.7 | 28.3 |
| 2015 | 65.7 | 36.2 | 29.4 |
| 2016 | 68.0 | 36.7 | 31.3 |
| 2017 | 69.9 | 37.4 | 32.5 |
| 2018 | 71.8 | 38.0 | 33.8 |
| 2019 | 74.5 | 39.7 | 34.8 |
Note(s):
Because of rounding, detail may not add to total. Includes all institutions surveyed in the fiscal years shown. Prior to FY 2003, totals did not include R&D expenditures in non-science and engineering fields.
Source(s):
National Center for Science and Engineering Statistics, Higher Education Research and Development Survey.
R&D Expenditures, by Source of Funding
Federally funded R&D at universities increased 6.3% to $44.5 billion in FY 2019. This total was $2.6 billion greater than the FY 2018 total and is the largest percentage increase since FYs 2010–11. The share of higher education R&D supported by the federal government remained about 53% for the third consecutive year after declining gradually from 62% in FY 2011. Fiscal year 2011 was the peak year for higher education R&D expenditures funded by the American Recovery and Reinvestment Act of 2009.
Institutions’ own funding, which rose $900 million (4.4%) from FY 2018 to FY 2019, accounted for the second largest share of R&D funding (25%). Also increased from FY 2018 are expenditures funded by businesses ($337 million or 7.1%), state and local governments ($194 million or 4.5%), nonprofit organizations ($242 million or 4.4%), and all other sources ($191 million or 7.6%).
The largest federal source of R&D expenditures for higher education institutions was the Department of Health and Human Services (HHS)—which includes the National Institutes of Health—at $24.4 billion, up almost $1.6 billion from FY 2018 (table 2). HHS accounted for 55% of FY 2019 federal funding and 60% of the increase in overall federal funding from FY 2018. The Department of Defense ($761 million increase), the National Aeronautics and Space Administration ($129 million increase), and the Department of Energy ($126 million increase) together accounted for most of the remaining federally funded expenditure increases. R&D expenditures funded by the National Science Foundation ($61 million increase) and the Department of Agriculture ($37 million increase) also contributed to the growth. All other federal sources declined 2.4% or $79 million.
Foreign sources of R&D funding are also collected in the HERD Survey. About $1.3 billion in foreign funds supported R&D at higher education institutions in FY 2019, an increase of 2.1% from FY 2018. These stemmed from the following foreign sources:
- Businesses: $587.5 million
- Nonprofit organizations: $274.5 million
- Foreign governments: $272.7 million
- Higher education institutions: $108.6 million
- All other sources: $36.4 million
Higher education R&D expenditures, by source of funds: FYs 2011–19
DOD = Department of Defense; DOE = Department of Energy; HHS = Department of Health and Human Services; NASA = National Aeronautics and Space Administration; NSF = National Science Foundation; USDA = Department of Agriculture.
Note(s):
Because of rounding, detail may not add to total. Beginning in FY 2012, institutions reporting less than $1 million in total R&D expenditures completed a shorter version of the survey questionnaire and those totals are not reflected here.
Source(s):
National Center for Science and Engineering Statistics, Higher Education Research and Development Survey.
R&D Expenditures, by Field
R&D expenditures in all science fields increased $3.4 billion (5.5%) from FY 2018, reaching $65.4 billion. Engineering R&D expenditures ($13.2 billion total) increased 6.9% and non-science and engineering ($4.9 billion total) increased 4.9% (table 3). Over half of the total growth in R&D expenditures for FY 2019 stemmed from increases in the life sciences subfields of biological and biomedical sciences (up $874 million to $15.4 billion) and health sciences (up $1.5 billion to $27.3 billion). While this share of total growth is substantial, these two subfields accounted for an even greater share of the total R&D increase (66%) between FYs 2017 and 2018. HHS funding increases were, as usual, a large contributor to the life sciences R&D growth.
Higher education R&D expenditures, by R&D field: FYs 2018–19
nec = not elsewhere classified; S&E = science and engineering.
Note(s):
This table includes only institutions reporting $1 million or more in total R&D expenditures in FY 2018. Institutions reporting less than $1 million in total R&D expenditures in FY 2018 completed a shorter version of the survey form in FY 2019 that did not include this question.
Source(s):
National Center for Science and Engineering Statistics, Higher Education Research and Development Survey.
R&D expenditures in computer and information sciences were also significantly greater in FY 2019, increasing 10.0% ($240 million) to $2.6 billion. Additionally, R&D in several subfields increased about $100 million or more from FY 2018 to FY 2019, including aerospace, aeronautical, and astronautical engineering (up $159 million or 15.8%), physics (up $121 million or 5.5%), bioengineering and biomedical engineering (up $107 million or 8.0%), and chemistry (up $99 million or 5.3%).
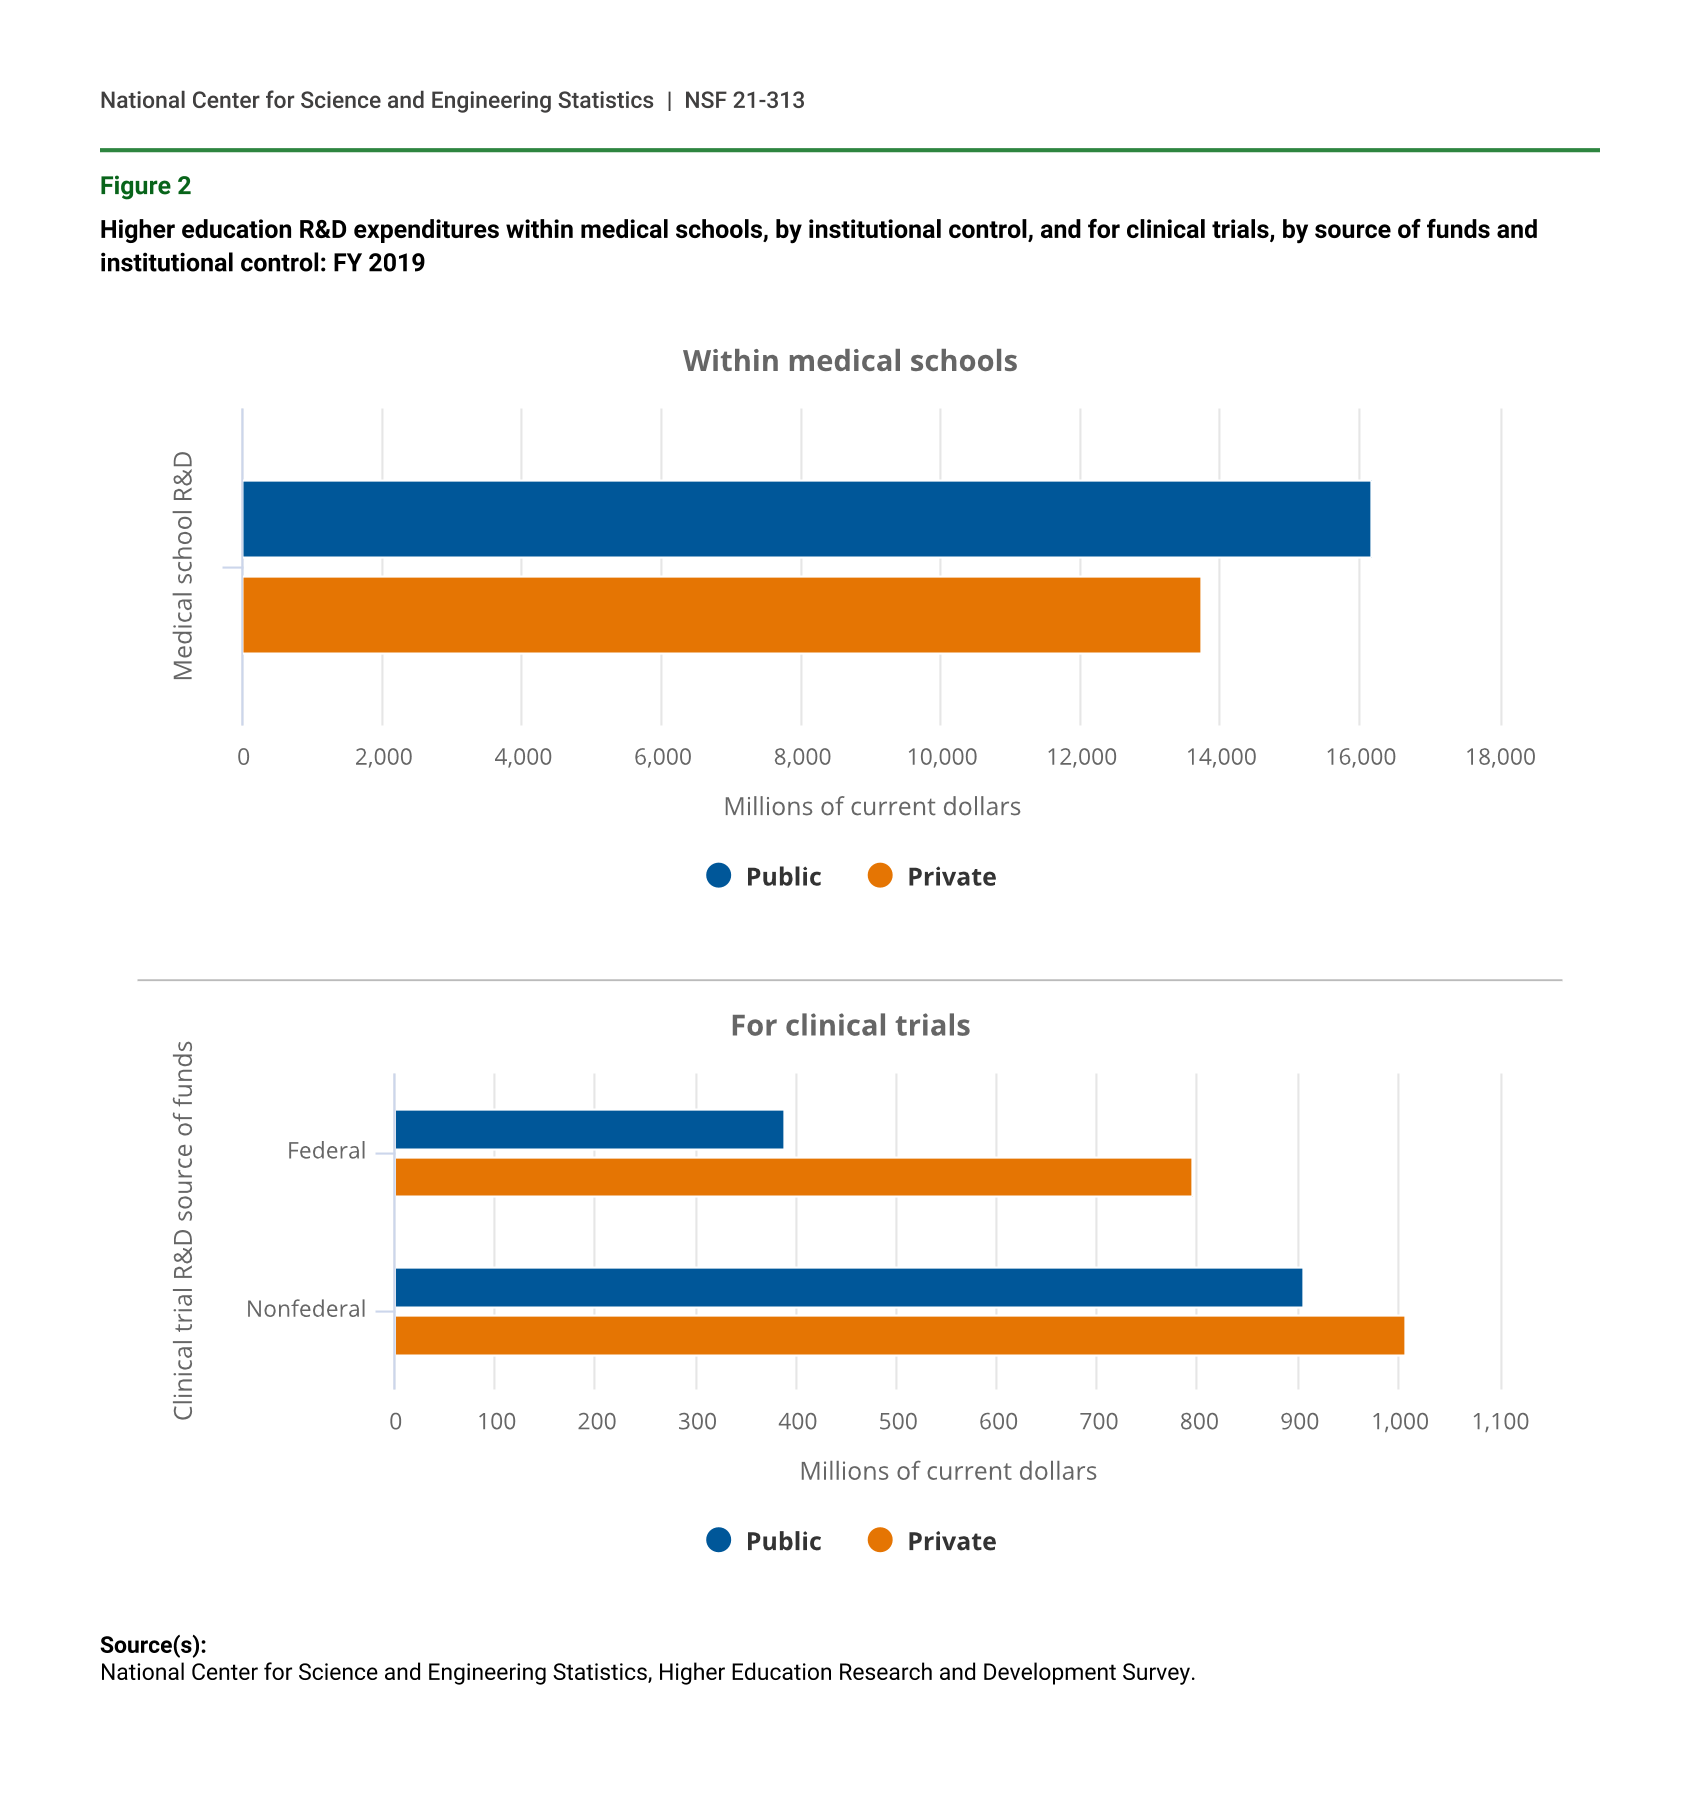
A significant portion of R&D at academic institutions is conducted by medical schools ($29.9 billion) and through Phase I, Phase II, or Phase III clinical trials ($3.1 billion) (figure 2). In FY 2019, 99 public institutions and 60 private institutions reported medical school R&D expenditures. One hundred and twenty-three public institutions and 66 private institutions reported clinical trials R&D in FY 2019. The shares of total public (54%) and private (46%) medical school expenditures have remained steady over the past decade, while the shares of total public (42%) and private (58%) clinical trial expenditures have gradually shifted four percentage points toward the public institutions since FY 2010.
Higher education R&D expenditures within medical schools, by institutional control, and for clinical trials, by source of funds and institutional control: FY 2019
| Medical school R&D | Public | Private |
|---|---|---|
| R&D expenditures | 16,173 | 13,742 |
| Clinical trial R&D source of funds | Public | Private |
|---|---|---|
| Federal | 388 | 795 |
| Nonfederal | 904 | 1,006 |
Source(s):
National Center for Science and Engineering Statistics, Higher Education Research and Development Survey.
Top University Research Performers Remain the Same
The top 30 institutions in terms of R&D expenditures accounted for 42% of the total spent on R&D within the higher education sector in FY 2019, virtually the same share as in FY 2018 and FY 2017 (table 4). Nineteen institutions reported at least $1 billion in R&D during FY 2019. Twelve institutions crossed that reporting threshold in FY 2017. Seventeen of the top 30 were public institutions, accounting for $19.5 billion in total R&D expenditures, and 13 were private institutions accounting for $15.9 billion. Institutions with medical schools were well-represented in this group; 27 of the top 30 reported medical school R&D expenditures.
The most notable change to the list of 30 institutions with the largest R&D expenditures is the inclusion of the University of Maryland at number 14. This ranking reflects the merger of the Baltimore and College Park campuses through the University of Maryland Strategic Partnership Act passed by the Maryland General Assembly in 2016. Prior to 2019, both campuses reported to the HERD Survey as separate institutions. Except for the University of Southern California moving from number 23 in FY 2018 to number 27 in FY 2019, no other institutions changed more than two positions on this list from the previous year.
Thirty institutions reporting the largest FY 2019 R&D expenditures in all fields: FYs 2017–19
na = not applicable; institution did not exist or did not exist as a separate entity.
a Johns Hopkins University includes the Applied Physics Laboratory, with $1,725 million in total R&D expenditures in FY 2019.
b The University of Maryland includes expenditures from the University of Maryland, Baltimore and University of Maryland, College Park campuses. In FY 2019, the two campuses began reporting as one research unit to reflect their new strategic partnership. This relationship was codified through the University of Maryland Strategic Partnership Act passed by the Maryland General Assembly in 2016. Prior to 2019, both campuses reported to the survey as separate institutions.
Note(s):
Because of rounding, detail may not add to total. This table reflects the leading 30 institutions for FY 2019; the institutions listed may not be in the top 30 of prior fiscal years.
Source(s):
National Center for Science and Engineering Statistics, Higher Education Research and Development Survey.
Data Sources, Limitations, and Availability
The fiscal year referred to throughout this report is the academic fiscal year. For most academic institutions, FY 2019 represents 1 July 2018 through 30 June 2019. The higher education R&D expenditures data were collected from a census of 916 universities and colleges that grant a bachelor’s degree or higher and expended at least $150,000 in R&D in FY 2018. To reduce respondent burden, the HERD Survey was revised in FY 2012 to request abbreviated data from institutions reporting less than $1 million in R&D expenditures during the previous fiscal year. Except for the totals reported in table 1 and figure 1, all other totals shown in this InfoBrief exclude expenditures from the 269 institutions that completed a short-form version of the survey. The institutions completing the short-form survey accounted for $157 million (0.2%) of total higher education R&D expenditures in FY 2019.
The amounts reported include all funds expended for activities specifically organized to produce research outcomes and sponsored by an outside organization or separately accounted for using institution funds. R&D expenditures at university-administered federally funded research and development centers (FFRDCs) are collected in a separate survey, the FFRDC Research and Development Survey, available at https://www.nsf.gov/statistics/ffrdc/.
The full set of data tables and technical information from this survey are available at https://ncses.nsf.gov/pubs/nsf21314.
Notes
1For more details on expenditures funded by the American Recovery and Reinvestment Act of 2009, see the NCSES InfoBrief Higher Education R&D Expenditures Resume Slow Growth in FY 2013, and table 12 in the HERD FY 2014 data tables.
2All other sources includes such sources as funds from foreign governments, foreign or other U.S. universities, and gifts designated by donors for research.
3R&D expenditures funded by foreign sources are included in the totals for the business, nonprofit organizations, and all other sources sectors presented in table 1. The details on foreign sources provided here are also collected separately in the HERD Survey.
4For FYs 2010–19 R&D expenditures at medical schools and for clinical trials, see tables 18 and 19 in the HERD FY 2019 data tables. For more information on medical school and clinical trial R&D data and definitions, please see the HERD questionnaire and technical notes at https://www.nsf.gov/statistics/srvyherd/.
Suggested Citation
Gibbons, MT; National Center for Science and Engineering Statistics (NCSES). 2021. Universities Report 5.7% Growth in R&D Spending in FY 2019, Reaching $84 Billion. NSF 21-313. Alexandria, VA: National Science Foundation. Available at https://ncses.nsf.gov/pubs/nsf21313/.
Contact Us
NCSES
National Center for Science and Engineering Statistics
Directorate for Social, Behavioral and Economic Sciences
National Science Foundation
2415 Eisenhower Avenue, Suite W14200
Alexandria, VA 22314
Tel: (703) 292-8780
FIRS: (800) 877-8339
TDD: (800) 281-8749
E-mail: ncsesweb@nsf.gov