 An official website of the United States government
U.S. R&D Increased by $51 Billion, to $606 Billion, in 2018; Estimate for 2019 Indicates a Further Rise to $656 Billion
New data from the National Center for Science and Engineering Statistics (NCSES) within the National Science Foundation, indicate that research and experimental development (R&D) performed in the United States totaled $606.1 billion in 2018 (table 1). The estimated total for 2019, based on performer-reported expectations, is $656.0 billion. These numbers compare with U.S. R&D totals of $494.5 billion in 2015 and $406.6 billion in 2010. (All amounts and calculations are reported in current dollars, unless otherwise noted.)
The U.S. R&D system consists of the activities of a diverse group of R&D performers and sources of funding. Included here are private businesses, the federal government, nonfederal governments, higher education institutions, and nonprofit organizations. The organizations that perform R&D often receive significant levels of outside funding, and organizations that fund R&D may also themselves be performers. The data for this InfoBrief mainly derive from NCSES surveys of the annual R&D expenditures of these performers and funders (see “Data Sources and Availability” for additional information).
U.S. R&D expenditures, by performing sector and source of funds: 2010–19
FFRDC = federally funded research and development center.
a The data for 2019 are estimates and will later be revised.
b Federal intramural includes expenditures of federal intramural R&D as well as costs associated with administering extramural R&D procurements.
c R&D performed by nonprofit organizations are estimated and may later be revised.
Note(s):
Data are based on annual reports by performers, except for the nonprofit sector. Expenditure levels for higher education, federal government, and nonfederal government performers are calendar year approximations based on fiscal year data.
Source(s):
National Center for Science and Engineering Statistics, National Patterns of R&D Resources (annual series).
Current Trends in U.S. Total R&D and R&D Intensity
U.S. Total R&D
The 2010–17 period saw sizable year-over-year increases in U.S. R&D expenditures, averaging $21 billion annually—a stark contrast with essentially no change between 2008 and 2010, a period marked by the impacts of the Great Recession. The increase in 2018 was $51 billion over the 2017 level. The estimated level for 2019 similarly is $50 billion more than in 2018. These sustained annual increases in U.S. total R&D are due mainly to consistently higher levels of business R&D performance, which accounted for about 80% of the increase each year (table 1).
Adjusted for inflation, growth in U.S. total R&D averaged 3.3% annually over the 2010–18 period, moderately higher than the 2.3% average growth of U.S. gross domestic product (GDP). By comparison, average annual growth of U.S. total R&D in the prior decade (2000–10), was lower at 2.1%, although it still outpaced the 1.7% rate of GDP expansion. The estimate for 2019 shows R&D growing at 6.3%, compared to GDP at 4.0%.
R&D-to-GDP Ratio
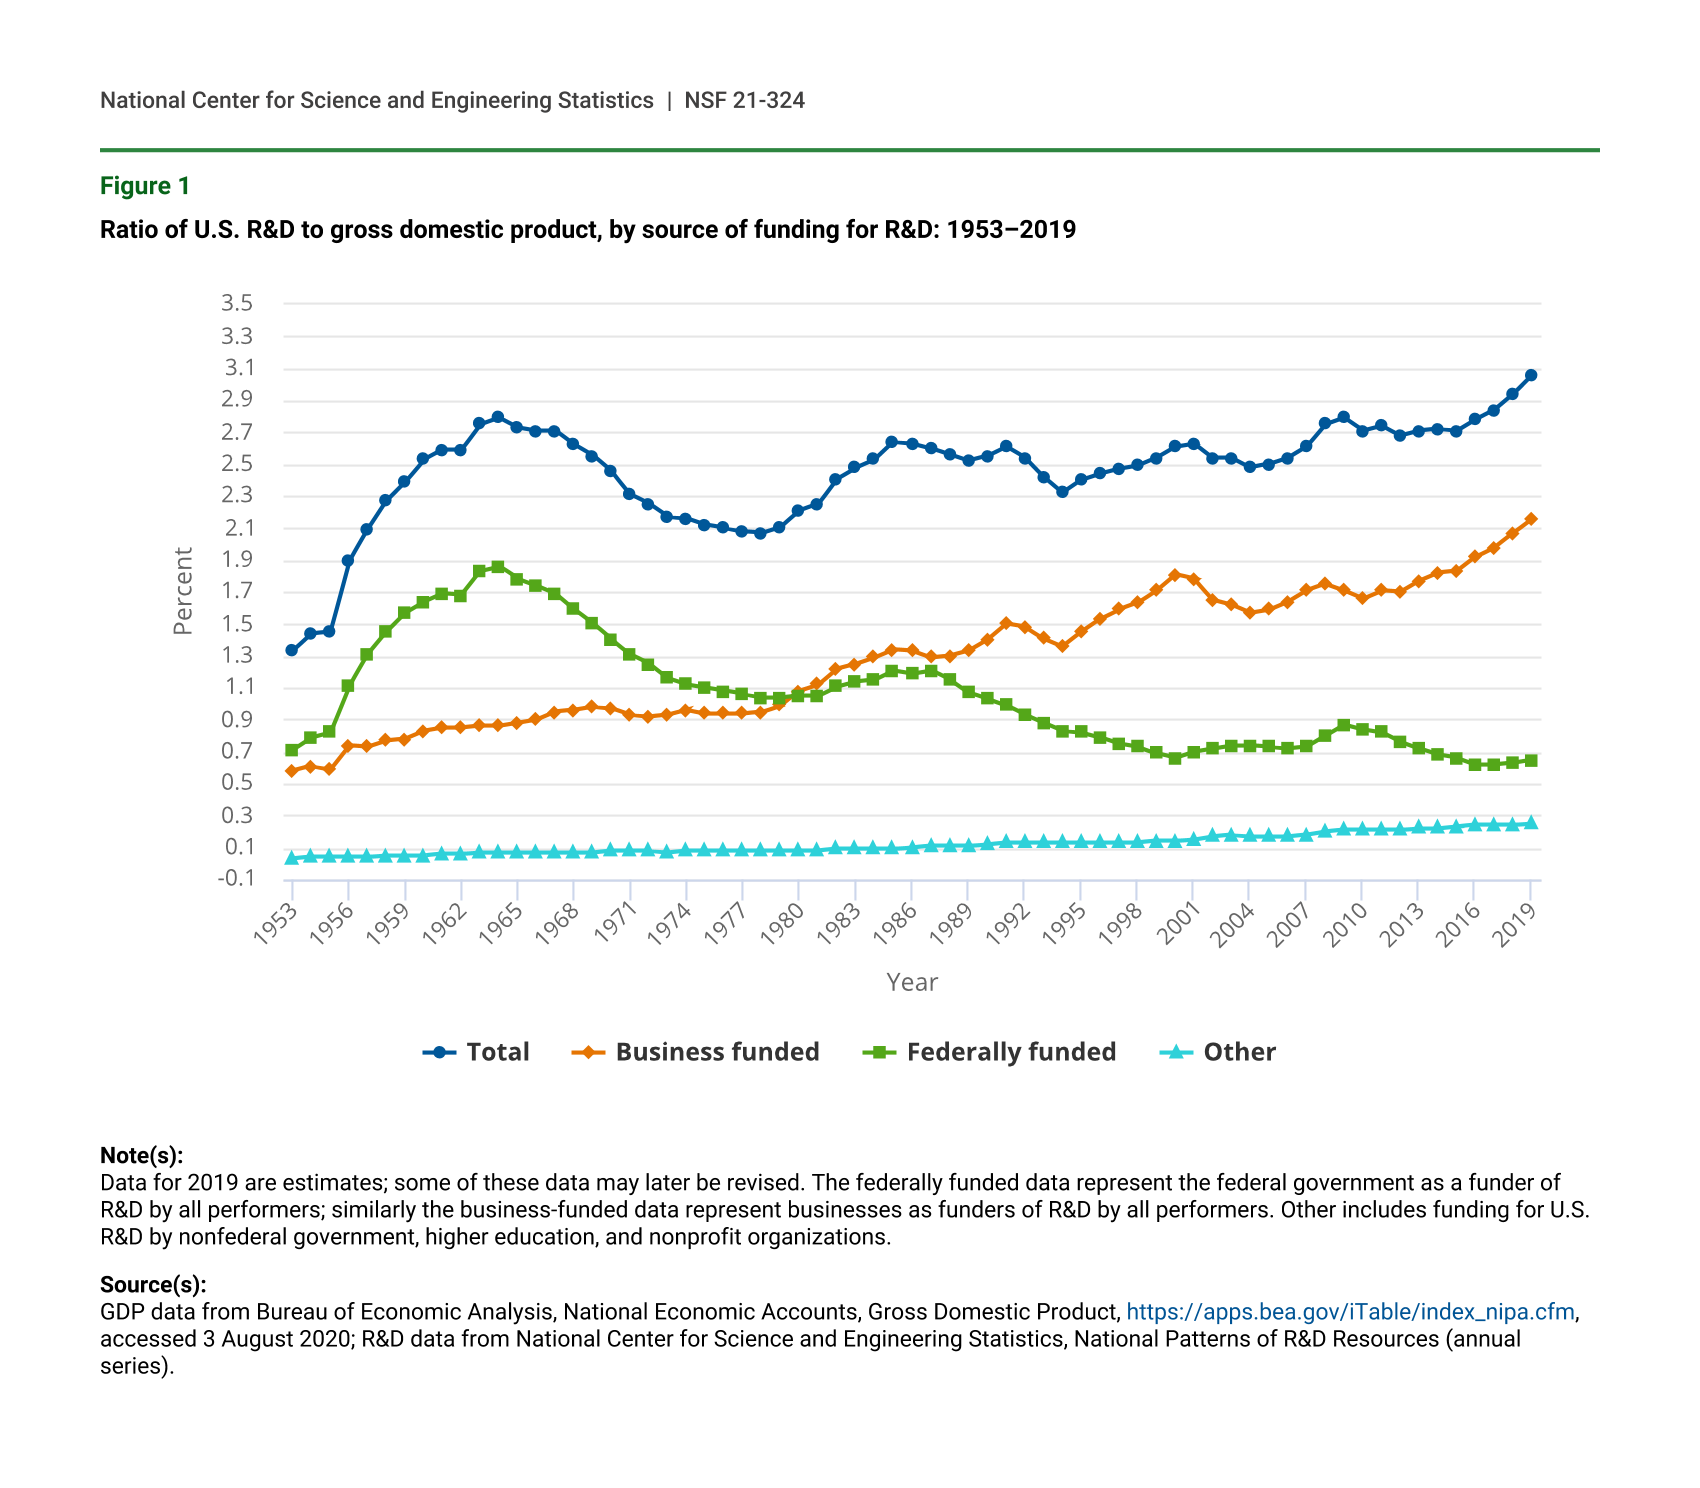
The ratio of total national R&D expenditures to GDP is widely used by national statistical offices and other policy analysts as an overall gauge of the intensity of a nation’s R&D effort. In this new edition of the National Patterns data, the ratio of U.S. R&D to GDP was 2.94% in 2018 and estimated to be 3.06% in 2019.
The U.S. ratio generally has been rising since the mid-1990s, though with some periods of decline (figure 1). The highest U.S. ratios recorded are 2.79% in 1964, 2.79% in 2009, 2.84% in 2017, 2.94% in 2018, and estimated to reach 3.06% in 2019.
Most of the rise in R&D-to-GDP ratio over the past several decades owes to the increase of nonfederal spending on R&D, particularly by the business sector. This arises largely from the growing role of business R&D in the national R&D system, which in turn reflects the increase of R&D-reliant goods and services in the national and global economies. By contrast, the share of federally funded R&D expenditures declined from the mid-1980s to the late 1990s, notably from cuts in defense-related R&D. This was followed by a gradual uptick through 2009, driven by increased federal spending on biomedical and national security R&D and the one-time incremental funding for R&D provided by the American Recovery and Reinvestment Act of 2009 (ARRA). The federally funded share, however, has mostly declined since 2010 (figure 1).
Ratio of U.S. R&D to gross domestic product, by source of funding for R&D: 1953–2019
| Year | Total | Business funded | Federally funded | Other |
|---|---|---|---|---|
| 1953 | 1.33 | 0.58 | 0.71 | 0.03 |
| 1954 | 1.44 | 0.61 | 0.79 | 0.04 |
| 1955 | 1.45 | 0.59 | 0.82 | 0.04 |
| 1956 | 1.89 | 0.74 | 1.11 | 0.04 |
| 1957 | 2.09 | 0.73 | 1.31 | 0.04 |
| 1958 | 2.27 | 0.77 | 1.45 | 0.05 |
| 1959 | 2.39 | 0.78 | 1.57 | 0.05 |
| 1960 | 2.53 | 0.83 | 1.64 | 0.05 |
| 1961 | 2.59 | 0.85 | 1.69 | 0.06 |
| 1962 | 2.59 | 0.85 | 1.68 | 0.06 |
| 1963 | 2.75 | 0.86 | 1.83 | 0.07 |
| 1964 | 2.79 | 0.86 | 1.86 | 0.07 |
| 1965 | 2.73 | 0.88 | 1.78 | 0.07 |
| 1966 | 2.71 | 0.90 | 1.74 | 0.07 |
| 1967 | 2.71 | 0.95 | 1.69 | 0.07 |
| 1968 | 2.62 | 0.96 | 1.59 | 0.07 |
| 1969 | 2.55 | 0.98 | 1.50 | 0.07 |
| 1970 | 2.45 | 0.97 | 1.40 | 0.08 |
| 1971 | 2.31 | 0.93 | 1.31 | 0.08 |
| 1972 | 2.25 | 0.92 | 1.25 | 0.08 |
| 1973 | 2.17 | 0.93 | 1.16 | 0.07 |
| 1974 | 2.16 | 0.96 | 1.12 | 0.08 |
| 1975 | 2.12 | 0.94 | 1.10 | 0.08 |
| 1976 | 2.10 | 0.94 | 1.08 | 0.08 |
| 1977 | 2.08 | 0.94 | 1.06 | 0.08 |
| 1978 | 2.07 | 0.95 | 1.04 | 0.08 |
| 1979 | 2.11 | 0.99 | 1.04 | 0.08 |
| 1980 | 2.21 | 1.08 | 1.05 | 0.08 |
| 1981 | 2.25 | 1.12 | 1.05 | 0.08 |
| 1982 | 2.41 | 1.22 | 1.11 | 0.09 |
| 1983 | 2.48 | 1.25 | 1.14 | 0.09 |
| 1984 | 2.53 | 1.29 | 1.15 | 0.09 |
| 1985 | 2.64 | 1.34 | 1.21 | 0.09 |
| 1986 | 2.63 | 1.33 | 1.19 | 0.10 |
| 1987 | 2.60 | 1.29 | 1.21 | 0.11 |
| 1988 | 2.56 | 1.30 | 1.15 | 0.11 |
| 1989 | 2.52 | 1.33 | 1.07 | 0.11 |
| 1990 | 2.55 | 1.40 | 1.03 | 0.12 |
| 1991 | 2.61 | 1.50 | 0.99 | 0.13 |
| 1992 | 2.54 | 1.48 | 0.93 | 0.13 |
| 1993 | 2.42 | 1.41 | 0.88 | 0.13 |
| 1994 | 2.32 | 1.36 | 0.83 | 0.13 |
| 1995 | 2.40 | 1.45 | 0.82 | 0.13 |
| 1996 | 2.44 | 1.53 | 0.79 | 0.13 |
| 1997 | 2.47 | 1.59 | 0.75 | 0.13 |
| 1998 | 2.49 | 1.63 | 0.73 | 0.13 |
| 1999 | 2.54 | 1.71 | 0.69 | 0.14 |
| 2000 | 2.61 | 1.81 | 0.66 | 0.14 |
| 2001 | 2.63 | 1.78 | 0.70 | 0.15 |
| 2002 | 2.54 | 1.65 | 0.72 | 0.17 |
| 2003 | 2.54 | 1.62 | 0.74 | 0.18 |
| 2004 | 2.48 | 1.57 | 0.74 | 0.17 |
| 2005 | 2.50 | 1.59 | 0.73 | 0.17 |
| 2006 | 2.54 | 1.64 | 0.72 | 0.17 |
| 2007 | 2.61 | 1.71 | 0.73 | 0.18 |
| 2008 | 2.75 | 1.75 | 0.80 | 0.20 |
| 2009 | 2.79 | 1.71 | 0.87 | 0.21 |
| 2010 | 2.71 | 1.66 | 0.84 | 0.21 |
| 2011 | 2.74 | 1.71 | 0.82 | 0.21 |
| 2012 | 2.68 | 1.70 | 0.76 | 0.21 |
| 2013 | 2.71 | 1.77 | 0.72 | 0.22 |
| 2014 | 2.72 | 1.82 | 0.68 | 0.22 |
| 2015 | 2.71 | 1.83 | 0.66 | 0.23 |
| 2016 | 2.78 | 1.92 | 0.62 | 0.24 |
| 2017 | 2.84 | 1.98 | 0.62 | 0.24 |
| 2018 | 2.94 | 2.07 | 0.63 | 0.24 |
| 2019 | 3.06 | 2.16 | 0.65 | 0.25 |
Note(s):
Data for 2019 are estimates; some of these data may later be revised. The federally funded data represent the federal government as a funder of R&D by all performers; similarly the business-funded data represent businesses as funders of R&D by all performers. Other includes funding for U.S. R&D by nonfederal government, higher education, and nonprofit organizations.
Source(s):
GDP data from Bureau of Economic Analysis, National Economic Accounts, Gross Domestic Product, https://apps.bea.gov/iTable/index_nipa.cfm, accessed 3 August 2020; R&D data from National Center for Science and Engineering Statistics, National Patterns of R&D Resources (annual series).
R&D by Type of Work
In 2018, basic research activities accounted for $101.1 billion, or 17% of total U.S. R&D expenditures (table 2). Applied research was $116.3 billion, or 19% of the total. Most of the total of U.S. R&D expenditures was experimental development at $388.6 billion, or 64%.
Higher education accounted for somewhat under half (46%) of the $101.1 billion of basic research in 2018 (table 2). The business sector was the second largest basic research performer (29%). Business was the majority performer (57%) of the $116.3 billion of applied research in 2018. Higher education was second at 18%; federal intramural performers plus FFRDCs amounted to 17% of the applied research total. Business continued to dominate experimental development, accounting for 90% of the $388.6 billion of that category in 2018.
Federal funding accounted for 41% of the $101.1 billion of basic research in 2018. But federal funds were less prominent for applied research (34% of $116.3 billion) and experimental development (12% of $388.6 billion). The business sector provided the greatest share of funding for applied research (54%) and the predominant share for experimental development (86%). It also accounted for a sizable share (30%) of funding for basic research.
U.S. R&D expenditures, by performing sector, source of funds, and type of work: 2018
* = small to negligible amount, included as part of the funding provided by other sectors.
FFRDC = federally funded research and development center.
Note(s):
R&D performed by nonprofit organizations are estimated and may later be revised.
Source(s):
National Center for Science and Engineering Statistics, National Patterns of R&D Resources (annual series).
Data Sources and Availability
The statistics on U.S. R&D presented in this report derive mainly from integrating the data on R&D expenditures and funding collected by NCSES’s annual national surveys on the organizations that perform and fund the vast majority of U.S. R&D. In some cases, the primary data from these surveys are adjusted to enable consistent integration of the statistics across these separately conducted surveys. In addition, preliminary or otherwise estimated values may be used where final data from one or more of the surveys are not yet available but can reasonably be calculated.
The R&D surveys involved include NCSES’s annual surveys of business R&D (the Business Research and Development Survey, for 2017–18; the preceding Business R&D and Innovation Survey, for 2008–16; and the Survey of Industrial R&D, for 2007 and earlier years). In addition, for the first time in National Patterns, the business R&D data include the R&D expenditures reported by micro companies (generally, companies with fewer than 10 employees) through NCSES surveys fielded for 2016 and onward (the 2016 Business R&D and Innovation Survey—Microbusiness, which collected statistics on the R&D activities of businesses with 1–5 employees, and for 2017–18, the Annual Business Survey, which collected statistics on the R&D activities of businesses with 1–9 employees). Other NCSES surveys involved are the Higher Education Research and Development Survey (for FYs 2010–19), and the preceding Survey of R&D Expenditures at Universities and Colleges, (for FY 2009 and earlier years); the Survey of Federal Funds for Research and Development (FYs 2019–20 and earlier years), the FFRDC Research and Development Survey (FY 2019 and earlier years), and the Survey of State Government Research and Development (for FYs 2006–19). Amounts for the R&D performed by nonprofit organizations with funding from the nonprofit sector and from business sources are estimated, based on parameters from the 1996–97 Survey of R&D Funding and Performance by Nonprofit Organizations.
A full set of detailed statistical tables associated with the National Patterns data will be available in the report National Patterns of R&D Resources: 2018–19 Data Update, at https://www.nsf.gov/statistics/natlpatterns/. This supplementary report provides further details on the nature of the data and the National Patterns methodologies. For further information and questions, contact the author.
Notes
1Research and experimental development comprise creative and systematic work undertaken in order to increase the stock of knowledge—including knowledge of humankind, culture, and society—and to devise new applications of available knowledge. Basic research: Experimental or theoretical work undertaken primarily to acquire new knowledge of the underlying foundations of phenomena and observable facts, without any particular application or use in view. Applied research: Original investigation undertaken in order to acquire new knowledge; directed primarily toward a specific, practical aim or objective. Experimental development: Systematic work, drawing on knowledge gained from research and practical experience and producing additional knowledge, which is directed to producing new products or processes or to improving existing products or processes (Organisation for Economic Co-Operation and Development, Frascati Manual 2015: Guidelines for Collecting and Reporting Data on Research and Experimental Development. 7th ed. Paris.)
2For further details on the 2008–10 trends, please see an earlier report in the National Patterns series: Boroush M; National Center for Science and Engineering Statistics (NCSES). 2013. U.S. R&D Resumes Growth in 2011 and 2012, Ahead of the Pace of the Gross Domestic Product. NSF 14-307. Arlington, VA: National Science Foundation. Available at: https://www.nsf.gov/statistics/infbrief/nsf14307/.
3In this report, dollars adjusted for inflation (i.e., constant dollars) are based on the GDP implicit price deflator (currently in 2012 dollars) as published by the Department of Commerce, Bureau of Economic Analysis (BEA) (https://www.bea.gov/iTable/index_nipa.cfm). Note that GDP deflators are calculated on an economy-wide scale and do not explicitly focus on R&D.
4Data on U.S. R&D and GDP prior to 2010 appear in the companion report, National Patterns of R&D Resources: 2018–19 Data Update.
5The 2010–18 R&D total data in table 1 suggest the trend in year-over-year increases may be shifting toward a higher average annual increase starting in 2017, or perhaps 2016. But the next edition of the National Patterns series—which will provide final 2019 data and an estimate for 2020—likely will be needed to confirm this shift.
6Due to sample variability in the data for the business R&D component, the calculated R&D-to-GDP ratios for 1965, 2009, and 2017 are not significantly different from one another at a 90% confidence level.
7For a further discussion, see: National Science Board, National Science Foundation. 2020. “Recent Trends in U.S. R&D Performance,” in Research and Development: U.S. Trends and International Comparisons. Science and Engineering Indicators 2020. NSB-2020-3. Alexandria, VA. Available at https://ncses.nsf.gov/pubs/nsb20203/recent-trends-in-u-s-r-d-performance.
8Estimates from the NCSES business R&D surveys mentioned are all derived from sample data and thereby contain sampling error. Consequently, estimates of total U.S. R&D also contain sampling error. For more information on this topic and other surveys used in the National Patterns tabulations, please see the technical notes in the accompanying Data Update at https://www.nsf.gov/statistics/natlpatterns/.
Suggested Citation
Boroush M; National Center for Science and Engineering Statistics (NCSES). 2021. U.S. R&D Increased by $51 Billion in 2018, to $606 Billion; Estimate for 2019 Indicates a Further Rise to $656 Billion. NSF 21-324. Alexandria, VA: National Science Foundation. Available at https://ncses.nsf.gov/pubs/nsf21324/.
Contact Us
NCSES
National Center for Science and Engineering Statistics
Directorate for Social, Behavioral and Economic Sciences
National Science Foundation
2415 Eisenhower Avenue, Suite W14200
Alexandria, VA 22314
Tel: (703) 292-8780
FIRS: (800) 877-8339
TDD: (800) 281-8749
E-mail: ncsesweb@nsf.gov