 An official website of the United States government
 Postgraduation trends
A graduate’s first position after earning the doctoral degree may reflect broad economic conditions and can shape later career opportunities, earnings, and choices. Over the longer term, the early career patterns of doctorate recipients may influence the decisions of future students considering careers as scientists, engineers, scholars, and researchers.
Job market
At any given time, the job market for new doctorate recipients will be better in some fields of study than in others. Though all fields tend to follow patterns that generally reflect overall trends in economic conditions, definite commitments at graduation are likely to be influenced by many factors.
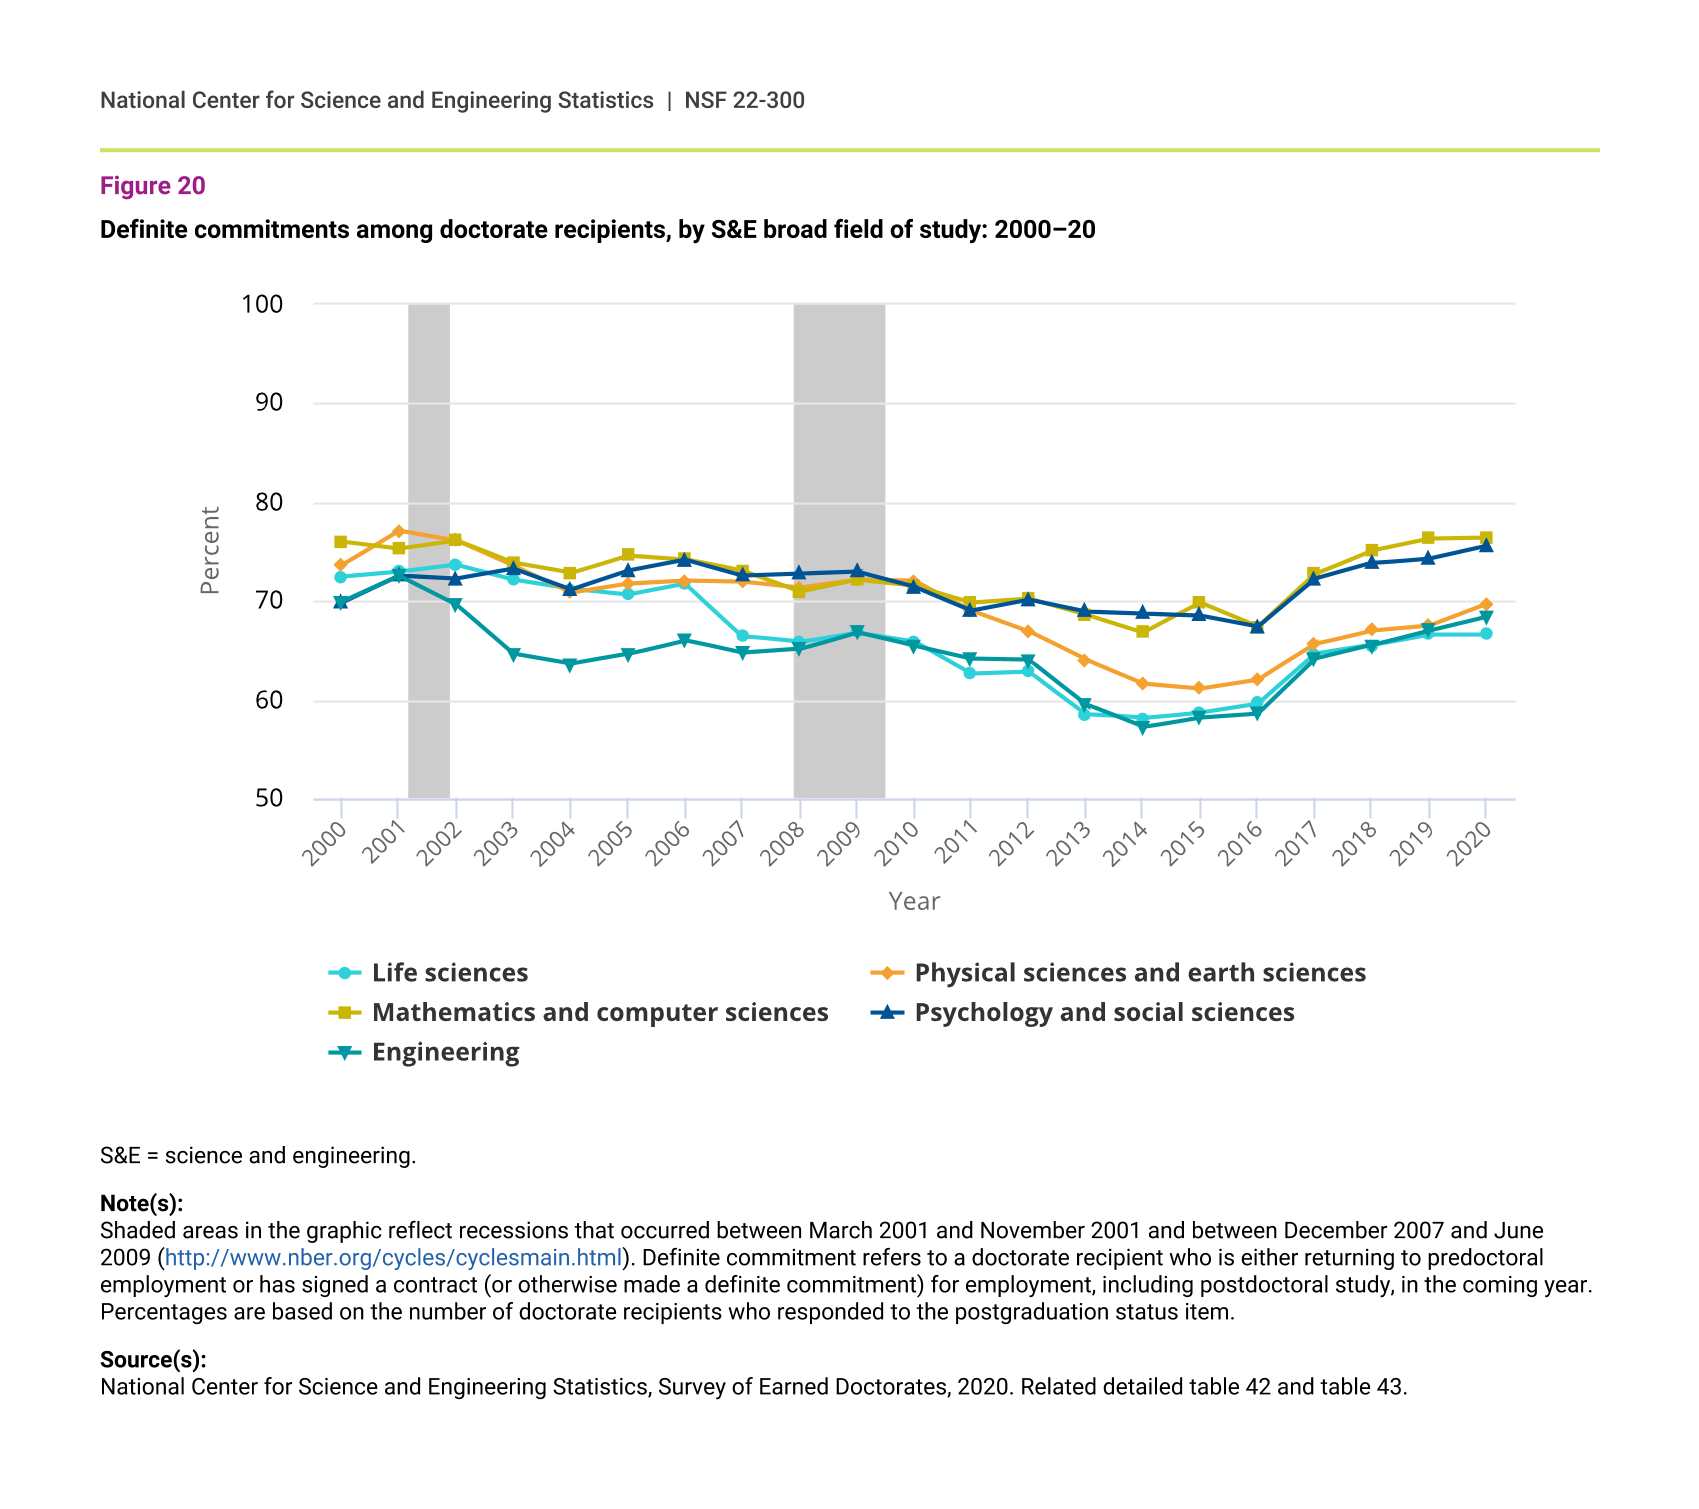
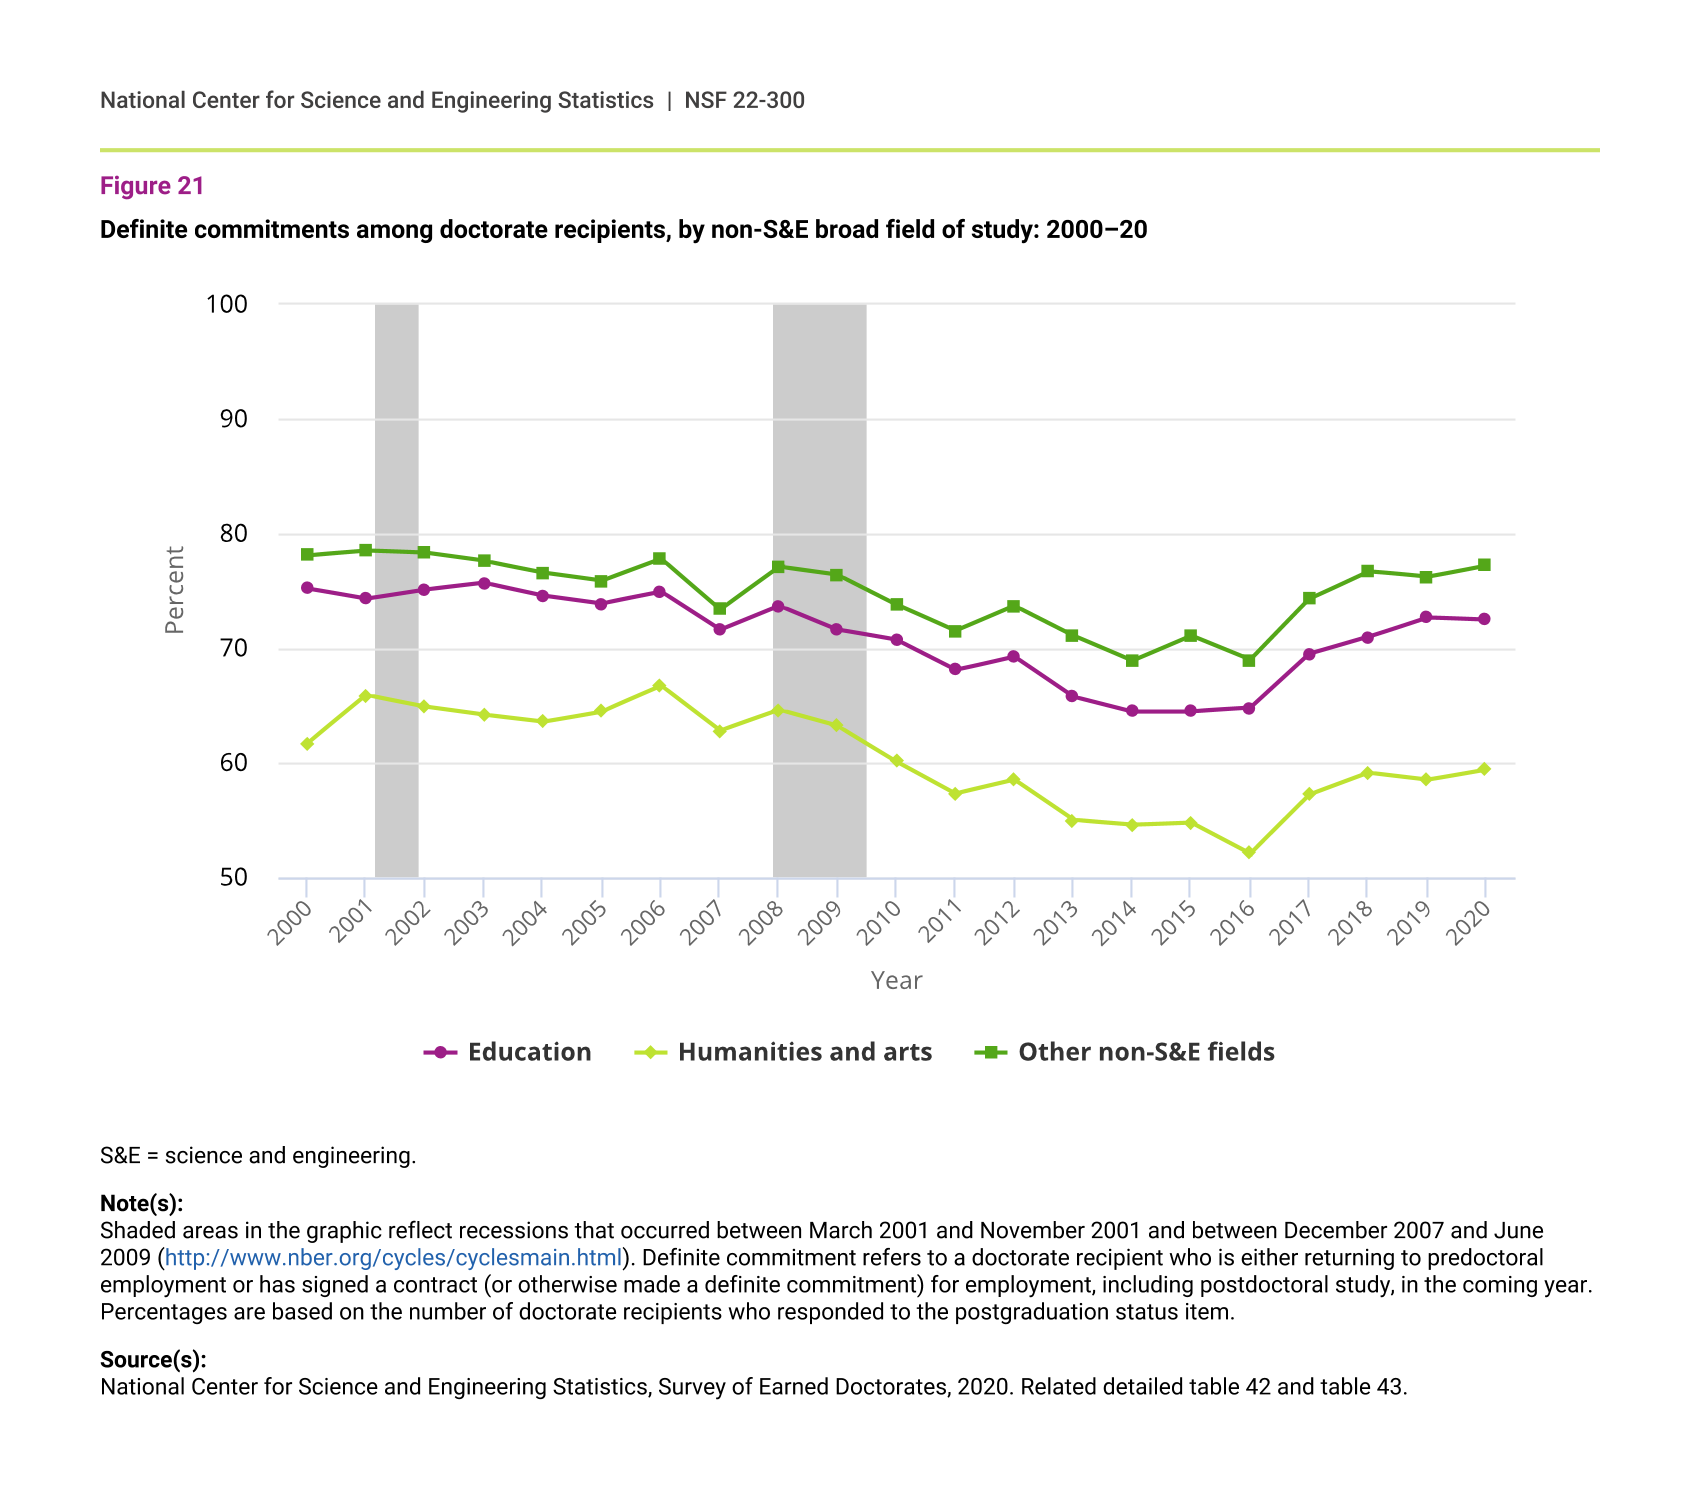
In life sciences, physical sciences and earth sciences, and engineering, the proportions of doctorate recipients reporting definite commitments, including postdoctoral positions (postdocs), have declined since 2000. These fields hit low points from about 2014 to 2016, depending on the field, but have since rebounded. In 2020, the proportion of doctorate recipients in mathematics and computer sciences and in psychology and social sciences who had definite commitments reached their highest points in the past 20 years (76% in each field) (figure 20). Non-science and engineering (non-S&E) fields similarly have recovered from lows in 2014–16 (figure 21).
Definite commitments among doctorate recipients, by S&E broad field of study: 2000–20
| Year | Life sciences | Physical sciences and earth sciences | Mathematics and computer sciences | Psychology and social sciences | Engineering |
|---|---|---|---|---|---|
| 2000 | 72.4 | 73.6 | 76.0 | 69.8 | 69.9 |
| 2001 | 72.9 | 77.1 | 75.3 | 72.5 | 72.5 |
| 2002 | 73.6 | 76.1 | 76.1 | 72.2 | 69.6 |
| 2003 | 72.1 | 73.5 | 73.8 | 73.2 | 64.6 |
| 2004 | 71.2 | 70.8 | 72.8 | 71.1 | 63.6 |
| 2005 | 70.6 | 71.7 | 74.6 | 73.0 | 64.6 |
| 2006 | 71.7 | 72.0 | 74.2 | 74.1 | 66.0 |
| 2007 | 66.4 | 71.9 | 73.0 | 72.5 | 64.7 |
| 2008 | 65.8 | 71.3 | 70.9 | 72.7 | 65.1 |
| 2009 | 66.8 | 72.1 | 72.1 | 72.9 | 66.8 |
| 2010 | 65.9 | 72.0 | 71.5 | 71.4 | 65.4 |
| 2011 | 62.6 | 69.0 | 69.8 | 69.0 | 64.1 |
| 2012 | 62.8 | 66.9 | 70.2 | 70.1 | 64.0 |
| 2013 | 58.5 | 64.0 | 68.6 | 68.9 | 59.5 |
| 2014 | 58.1 | 61.6 | 66.8 | 68.7 | 57.2 |
| 2015 | 58.7 | 61.1 | 69.8 | 68.5 | 58.2 |
| 2016 | 59.6 | 62.0 | 67.4 | 67.4 | 58.6 |
| 2017 | 64.6 | 65.6 | 72.7 | 72.2 | 64.1 |
| 2018 | 65.5 | 67.0 | 75.1 | 73.8 | 65.5 |
| 2019 | 66.6 | 67.5 | 76.3 | 74.3 | 67.0 |
| 2020 | 66.6 | 69.7 | 76.4 | 75.6 | 68.4 |
S&E = science and engineering.
Note(s):
Shaded areas in the graphic reflect recessions that occurred between March 2001 and November 2001 and between December 2007 and June 2009 (http://www.nber.org/cycles/cyclesmain.html). Definite commitment refers to a doctorate recipient who is either returning to predoctoral employment or has signed a contract (or otherwise made a definite commitment) for employment, including postdoctoral study, in the coming year. Percentages are based on the number of doctorate recipients who responded to the postgraduation status item.
Definite commitments among doctorate recipients, by non-S&E broad field of study: 2000–20
| Year | Education | Humanities and arts | Other non-S&E fields |
|---|---|---|---|
| 2000 | 75.2 | 61.7 | 78.1 |
| 2001 | 74.3 | 65.9 | 78.5 |
| 2002 | 75.1 | 64.9 | 78.3 |
| 2003 | 75.7 | 64.2 | 77.6 |
| 2004 | 74.6 | 63.6 | 76.6 |
| 2005 | 73.9 | 64.5 | 75.9 |
| 2006 | 74.9 | 66.7 | 77.8 |
| 2007 | 71.6 | 62.8 | 73.4 |
| 2008 | 73.7 | 64.6 | 77.1 |
| 2009 | 71.6 | 63.2 | 76.4 |
| 2010 | 70.7 | 60.1 | 73.8 |
| 2011 | 68.1 | 57.3 | 71.5 |
| 2012 | 69.3 | 58.5 | 73.7 |
| 2013 | 65.8 | 55.0 | 71.1 |
| 2014 | 64.5 | 54.6 | 68.9 |
| 2015 | 64.5 | 54.8 | 71.1 |
| 2016 | 64.8 | 52.1 | 69.0 |
| 2017 | 69.5 | 57.2 | 74.3 |
| 2018 | 71.0 | 59.1 | 76.7 |
| 2019 | 72.7 | 58.5 | 76.2 |
| 2020 | 72.5 | 59.4 | 77.2 |
S&E = science and engineering.
Note(s):
Shaded areas in the graphic reflect recessions that occurred between March 2001 and November 2001 and between December 2007 and June 2009 (http://www.nber.org/cycles/cyclesmain.html). Definite commitment refers to a doctorate recipient who is either returning to predoctoral employment or has signed a contract (or otherwise made a definite commitment) for employment, including postdoctoral study, in the coming year. Percentages are based on the number of doctorate recipients who responded to the postgraduation status item.
First postgraduate position
Academic employment
In 2020, 40% of all doctorate recipients with definite employment commitments (excluding postdoc positions) in the United States reported that their principal job would be in academe, down from 49% in 2000.
The highest rates of academic employment commitments were reported by doctorate recipients in humanities and arts and in other non-S&E fields (70% and 72%, respectively); the lowest rates were in engineering (10%) and in physical sciences and earth sciences (16%). In the past 20 years, the rate of academic employment commitments declined in all fields except for education, where it increased (figure 22).
Definite employment commitments in academe in the United States, by broad field of study: 2000 and 2020
| Year | Life sciences | Physical sciences and earth sciences | Mathematics and computer sciences | Psychology and social sciences | Engineering | Education | Humanities and arts | Other non-S&E fields |
|---|---|---|---|---|---|---|---|---|
| 2000 | 46.0 | 21.9 | 47.5 | 52.0 | 14.8 | 47.9 | 78.0 | 73.0 |
| 2020 | 36.7 | 16.3 | 26.5 | 51.0 | 10.3 | 54.6 | 69.9 | 71.9 |
S&E = science and engineering.
Note(s):
Definite employment commitment refers to a doctorate recipient who is either returning to predoctoral employment or has signed a contract (or otherwise made a definite commitment) for employment other than a postdoctoral position in the coming year. Percentages are based on the number of doctorate recipients who reported definite commitments (including those missing employer type) and plans to stay in the United States.
Postdoc positions
Historically, postdoc study positions have been a customary part of the early career paths of doctorate recipients in life sciences and in physical sciences and earth sciences, making up over half of definite commitments. Since 2000, postdocs also have become more prevalent in mathematics and computer sciences, psychology and social sciences, engineering, and non-S&E fields, though their rates in these fields are not as high.
After a decade of growth between 2000 and 2010, the overall proportion of S&E doctorate recipients taking postdoc positions in the United States immediately after graduation declined from 55% to 46%. The proportions of doctorate recipients taking postdoc positions in life sciences, physical sciences and earth sciences, mathematics and computer sciences, and engineering declined during this period, but the proportions in psychology and social sciences and in non-S&E fields increased (figure 23).
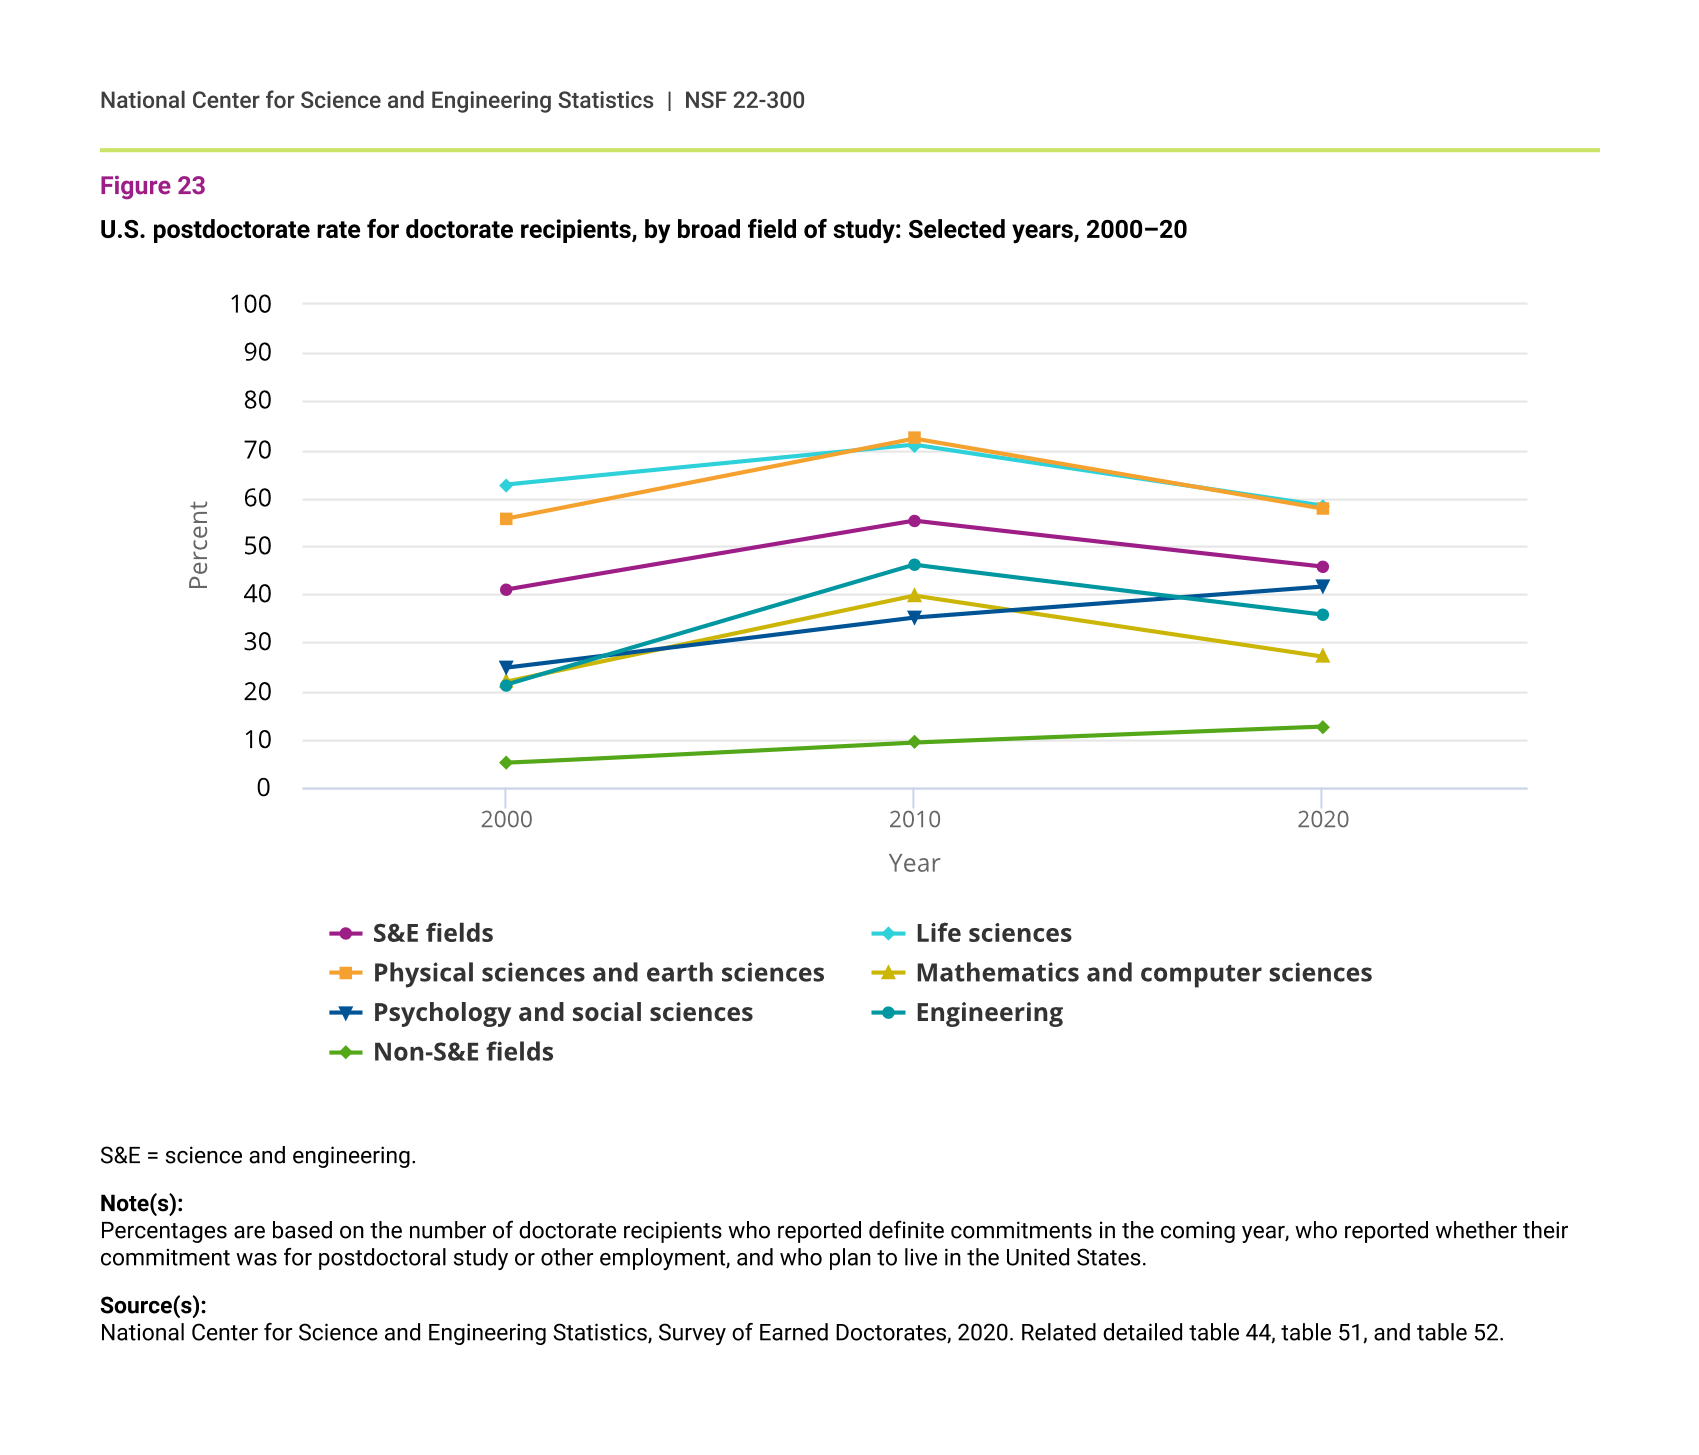
U.S. postdoctorate rate for doctorate recipients, by broad field of study: Selected years, 2000–20
| Year | S&E fields | Life sciences | Physical sciences and earth sciences | Mathematics and computer sciences | Psychology and social sciences | Engineering | Non-S&E fields |
|---|---|---|---|---|---|---|---|
| 2000 | 41.0 | 62.7 | 55.6 | 21.9 | 24.8 | 21.3 | 5.1 |
| 2010 | 55.2 | 70.9 | 72.2 | 39.7 | 35.2 | 46.1 | 9.4 |
| 2020 | 45.8 | 58.4 | 57.7 | 27.1 | 41.6 | 35.9 | 12.7 |
S&E = science and engineering.
Note(s):
Percentages are based on the number of doctorate recipients who reported definite commitments in the coming year, who reported whether their commitment was for postdoctoral study or other employment, and who plan to live in the United States.
Median salaries
In 2020, doctorate recipients who had definite commitments for a postdoc or other employed position in the United States in the coming year reported basic annual salaries that varied by their field of study and the type of position to which they committed.
In every field, median expected salaries for doctorate recipients committing to jobs in industry or business were higher than those in postdocs and academe (figure 24). The median salaries for postdocs in almost all broad fields were relatively similar, ranging from $50,000 to $55,000. Postdocs in mathematics and computer sciences were the exception, with a median salary of $61,000. Doctorate recipients in engineering and those in other non-S&E fields, such as industry or business, reported the highest median academic salaries ($85,000 and $90,000, respectively). Those in mathematics and computer sciences reported the highest median salaries in industry or business positions ($144,000).
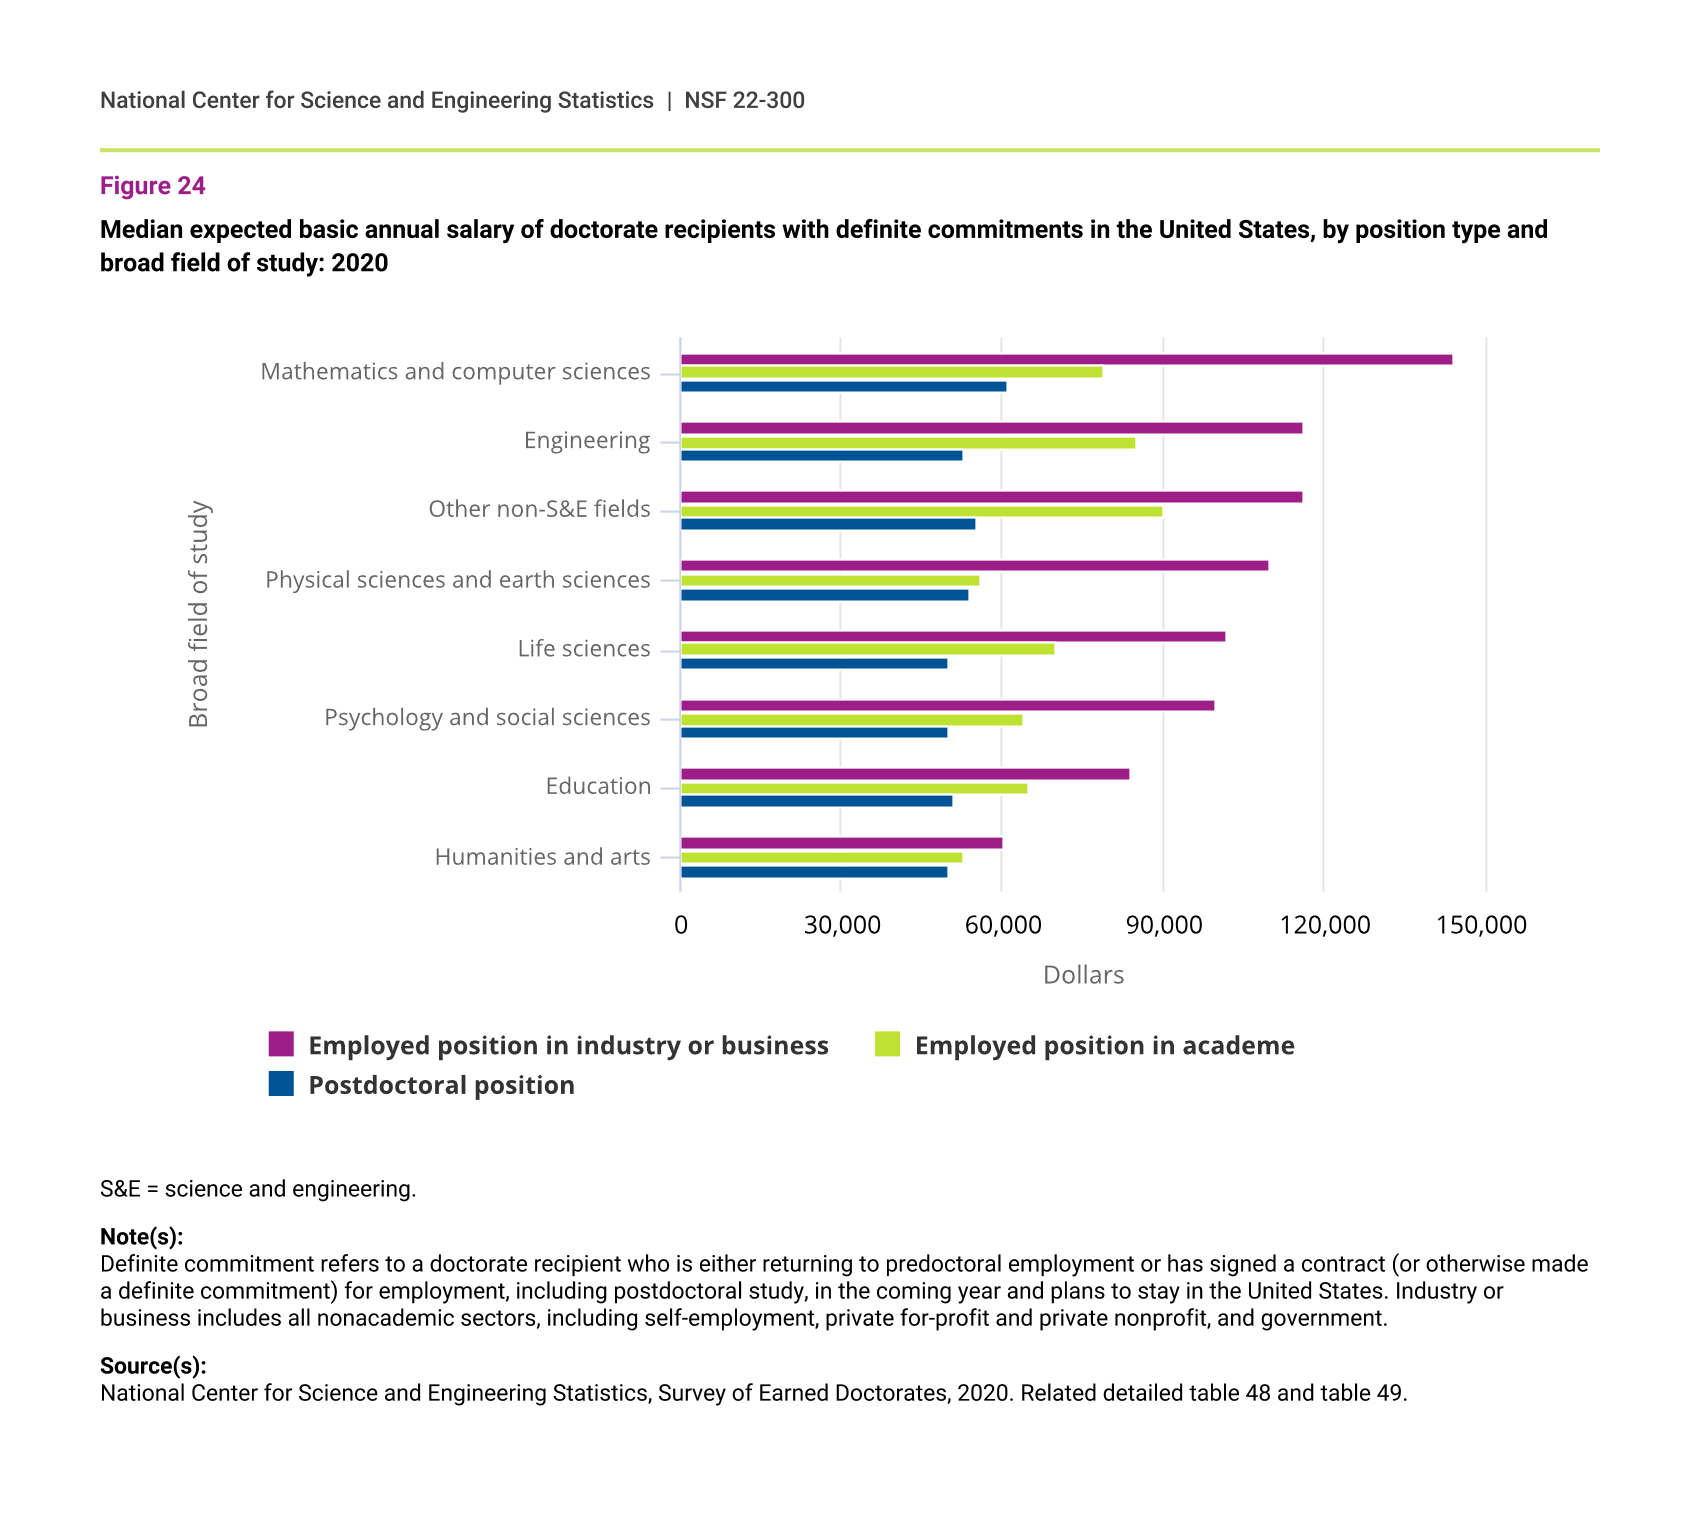
Median expected basic annual salary of doctorate recipients with definite commitments in the United States, by position type and broad field of study: 2020
| Broad field of study | Employed position in industry or business | Employed position in academe | Postdoctoral position |
|---|---|---|---|
| Mathematics and computer sciences | 144,000 | 79,000 | 61,200 |
| Engineering | 116,050 | 85,000 | 52,701 |
| Other non-S&E fields | 116,000 | 90,000 | 55,000 |
| Physical sciences and earth sciences | 110,000 | 56,000 | 54,000 |
| Life sciences | 102,000 | 70,000 | 50,004 |
| Psychology and social sciences | 100,000 | 64,000 | 50,000 |
| Education | 84,000 | 65,000 | 50,760 |
| Humanities and arts | 60,250 | 53,000 | 50,000 |
Note(s):
Definite commitment refers to a doctorate recipient who is either returning to predoctoral employment or has signed a contract (or otherwise made a definite commitment) for employment, including postdoctoral study, in the coming year and plans to stay in the United States. Industry or business includes all nonacademic sectors, including self-employment, private for-profit and private nonprofit, and government.