 An official website of the United States government
 Special focus: Temporary visa holder doctorate recipients and postgraduation plans
In an integrated global economy, knowledge is an increasingly valued national resource. By studying abroad, international students expand their employment opportunities, and many end up choosing between employment opportunities in different countries.
This special focus section examines the top countries of origin and fields of temporary visa holders who earned a doctorate in the United States.
Overview
This section reports on how many intend to stay in the United States, where they have jobs lined up, and compares their patterns to those of their U.S. citizen or permanent resident counterparts. International doctoral recipients, led by those from China and India, outnumber American students in many science and engineering (S&E) fields, particularly in the fields of engineering, computer science, mathematics and statistics, and economics. Most of these doctorate recipients want to stay in the United States if they had the opportunity, and they end up working in industry or business at higher rates than their U.S. citizen or permanent resident counterparts.
Top fields of temporary visa holder doctorate recipients
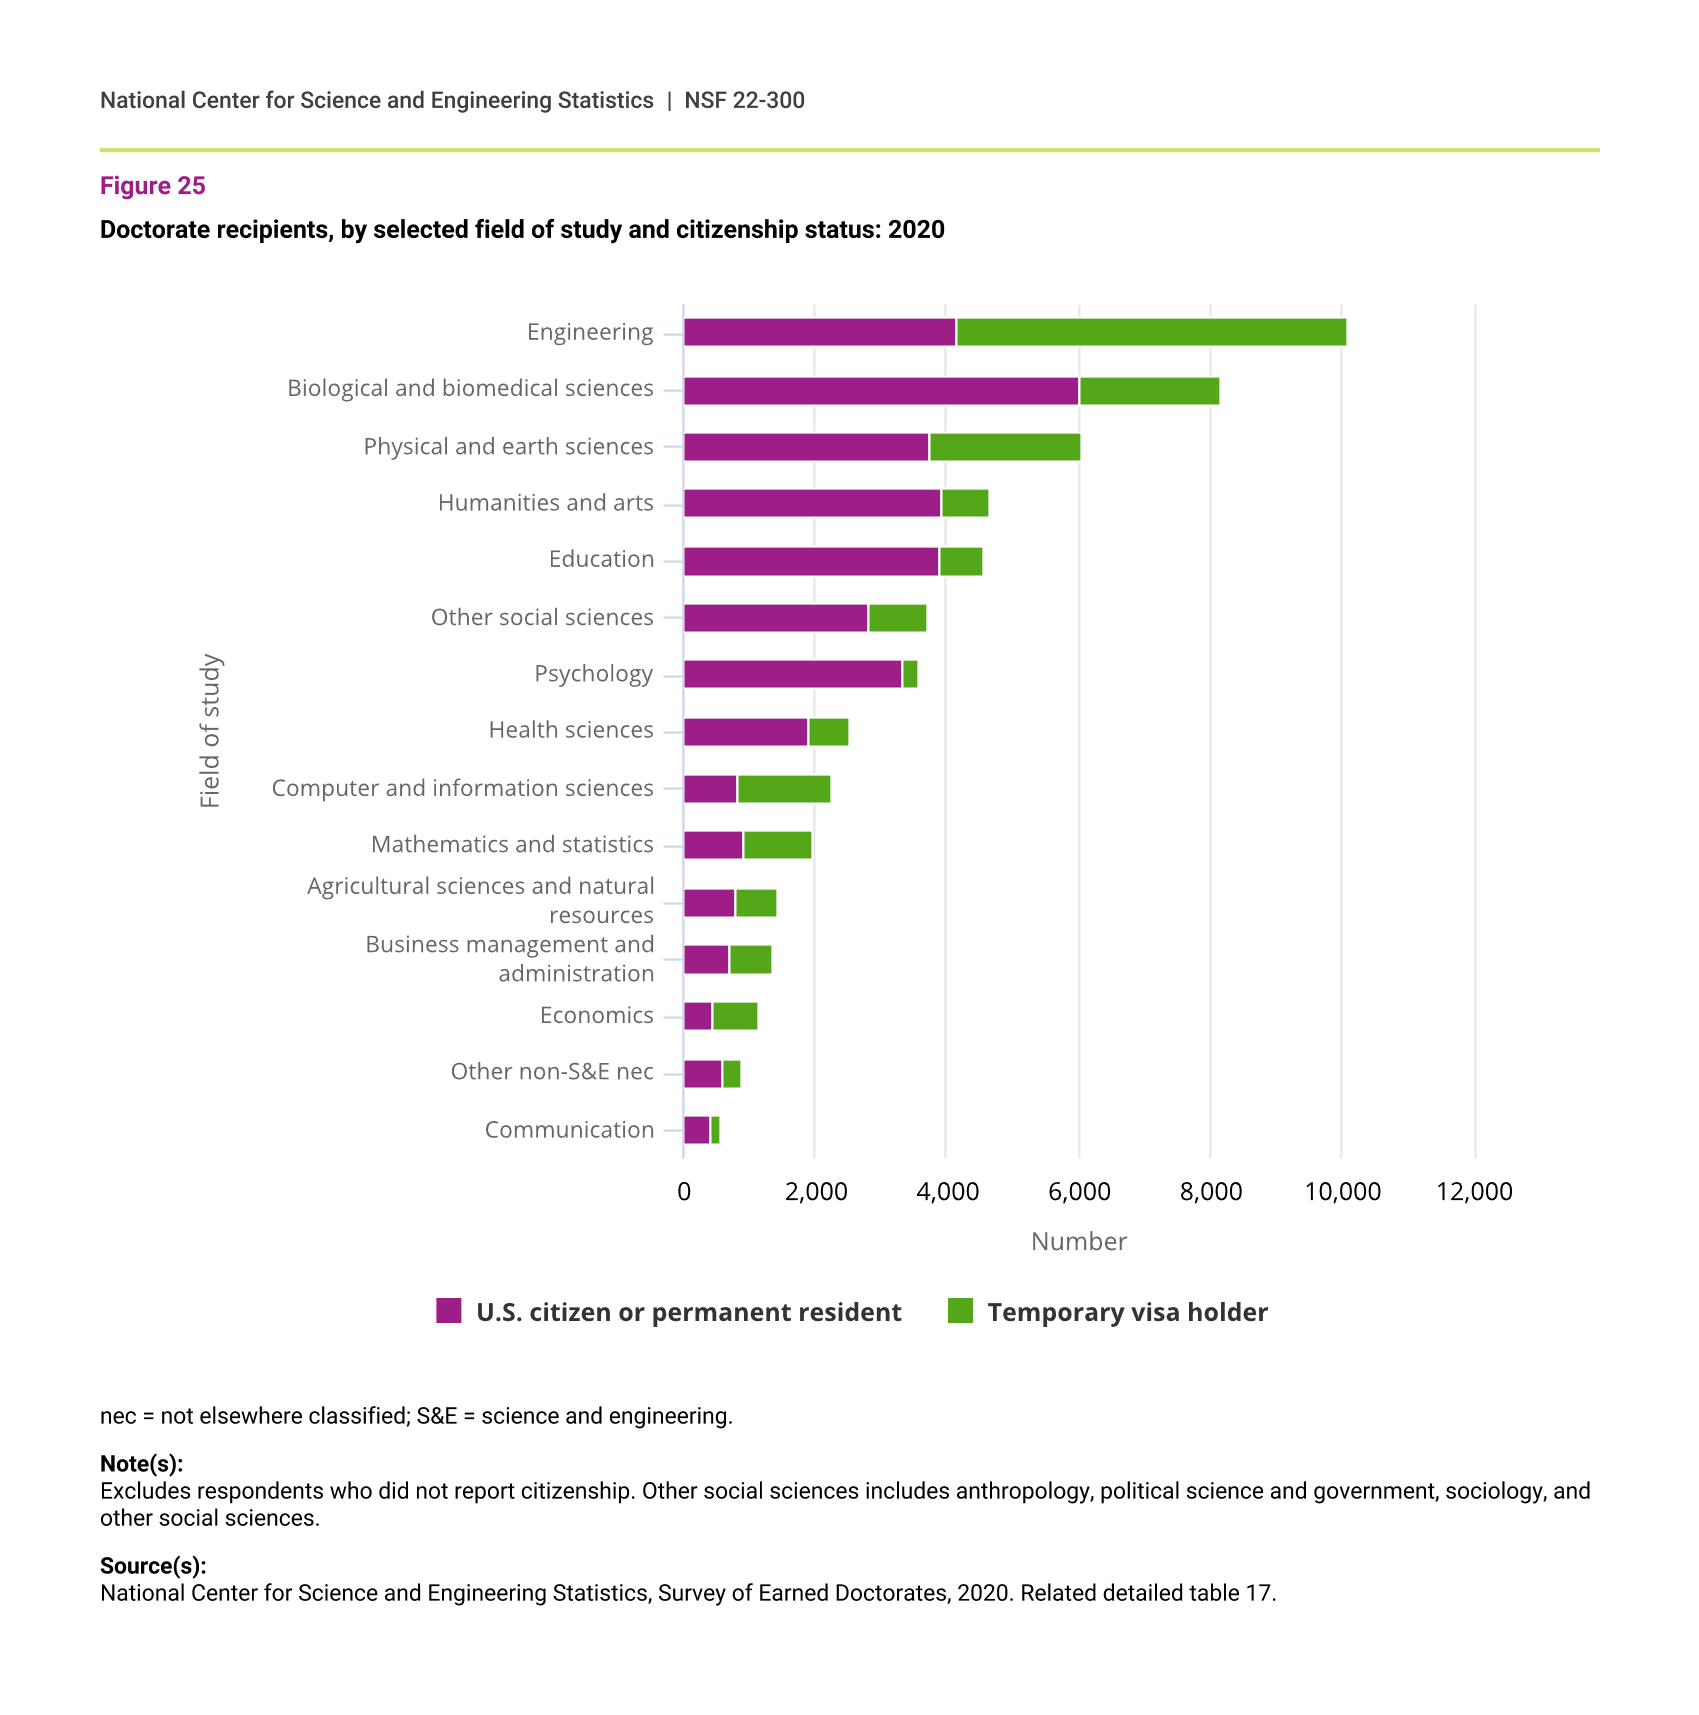
Since 2010, temporary visa holders earned nearly 180,000 out of 585,000 doctorates in the United States and 56% of these doctorates were in science fields and 31% were in engineering fields. In 2020, the number of temporary visa holders earning a doctoral degree exceeded the number of their U.S. citizen and permanent resident counterparts in engineering, computer and information sciences, mathematics and statistics, and economics (figure 25). Within engineering, temporary visa holders accounted for about two thirds of doctorate recipients in electrical, electronics, and communications engineering (68%), industrial and manufacturing engineering (66%), and civil engineering (64%) (table C).
The proportion of temporary visa holder doctorate recipients was lowest in psychology (7%), humanities and arts (16%), and education (15%) (figure 25).
Doctorate recipients, by selected field of study and citizenship status: 2020
| Field of study | U.S. citizen or permanent resident | Temporary visa holder |
|---|---|---|
| Engineering | 4,154 | 5,955 |
| Biological and biomedical sciences | 6,008 | 2,176 |
| Physical and earth sciences | 3,741 | 2,311 |
| Humanities and arts | 3,915 | 742 |
| Education | 3,896 | 661 |
| Other social sciences | 2,829 | 884 |
| Psychology | 3,317 | 257 |
| Health sciences | 1,903 | 621 |
| Computer and information sciences | 808 | 1,452 |
| Mathematics and statistics | 928 | 1,023 |
| Agricultural sciences and natural resources | 796 | 633 |
| Business management and administration | 709 | 658 |
| Economics | 459 | 691 |
| Other non-S&E nec | 617 | 264 |
| Communication | 412 | 154 |
nec = not elsewhere classified; S&E = science and engineering.
Note(s):
Excludes respondents who did not report citizenship. Other social sciences includes anthropology, political science and government, sociology, and other social sciences.
Source(s):
National Center for Science and Engineering Statistics, Survey of Earned Doctorates, 2020. Related detailed table 17.
Doctorate recipients in engineering, by citizenship status and fine field: 2020
a Includes respondents who did not report citizenship status.
Note(s):
See table A-6 in the Technical Notes for a listing of major fields and their constituent subfields.
Source(s):
National Center for Science and Engineering Statistics, Survey of Earned Doctorates, 2020.
Top countries of origin
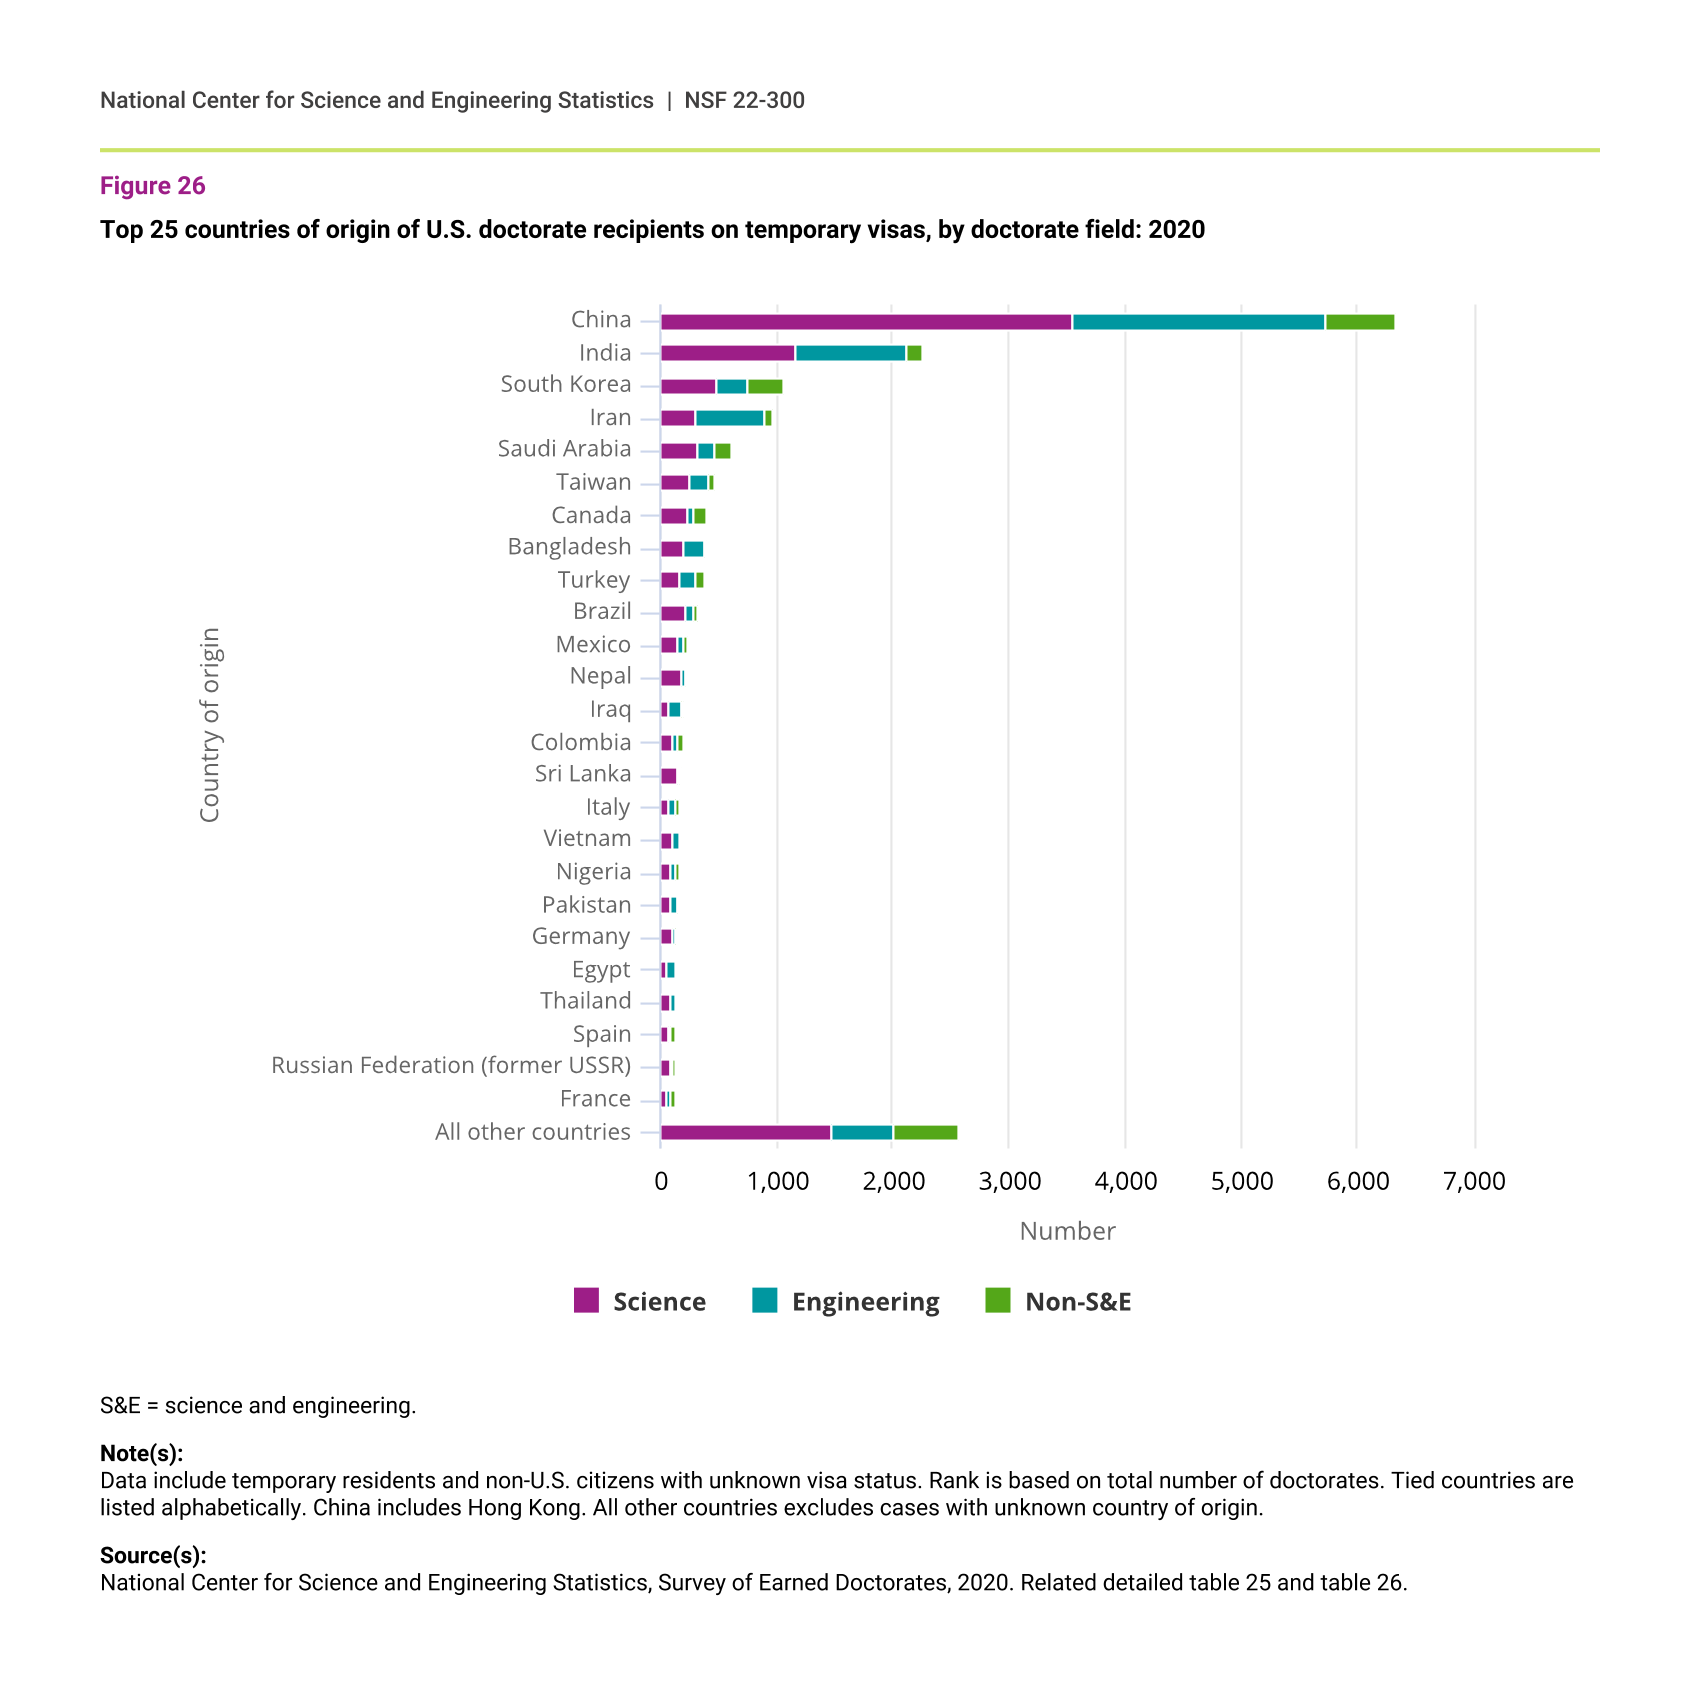
In 2020, doctorate recipients from the top 25 countries of origin accounted for 86% of all doctorate recipients awarded to temporary visa holders. The top three countries, China, India, and South Korea, accounted for more than half (figure 26).
The vast majority of the doctorate recipients from China and India (90% and 94%, respectively) earned their degrees in S&E. A larger proportion of doctoral recipients from South Korea (28%) than from China or India earned their degree in a non-S&E field. Over half of the doctorate recipients from Iran, Iraq, and Egypt earned a doctorate in engineering.
Top 25 countries of origin of U.S. doctorate recipients on temporary visas, by doctorate field: 2020
| Country of origin | Science | Engineering | Non-S&E |
|---|---|---|---|
| China | 3,552 | 2,178 | 607 |
| India | 1,164 | 952 | 140 |
| South Korea | 489 | 267 | 298 |
| Iran | 312 | 583 | 67 |
| Saudi Arabia | 332 | 140 | 143 |
| Taiwan | 257 | 160 | 51 |
| Canada | 241 | 40 | 117 |
| Bangladesh | 201 | 168 | 23 |
| Turkey | 165 | 138 | 66 |
| Brazil | 213 | 75 | 30 |
| Mexico | 144 | 52 | 40 |
| Nepal | 187 | 36 | 3 |
| Iraq | 78 | 104 | 10 |
| Colombia | 102 | 49 | 40 |
| Sri Lanka | 139 | 29 | 6 |
| Italy | 80 | 44 | 46 |
| Vietnam | 103 | 50 | 16 |
| Nigeria | 92 | 42 | 27 |
| Pakistan | 85 | 59 | 13 |
| Germany | 104 | 19 | 27 |
| Egypt | 55 | 68 | 4 |
| Thailand | 92 | 25 | 9 |
| Spain | 64 | 24 | 34 |
| Russian Federation (former USSR) | 89 | 11 | 20 |
| France | 60 | 31 | 27 |
| All other countries | 1,473 | 537 | 548 |
S&E = science and engineering.
Note(s):
Data include temporary residents and non-U.S. citizens with unknown visa status. Rank is based on total number of doctorates. Tied countries are listed alphabetically. China includes Hong Kong. All other countries excludes cases with unknown country of origin.
Intention to stay in the United States after graduation
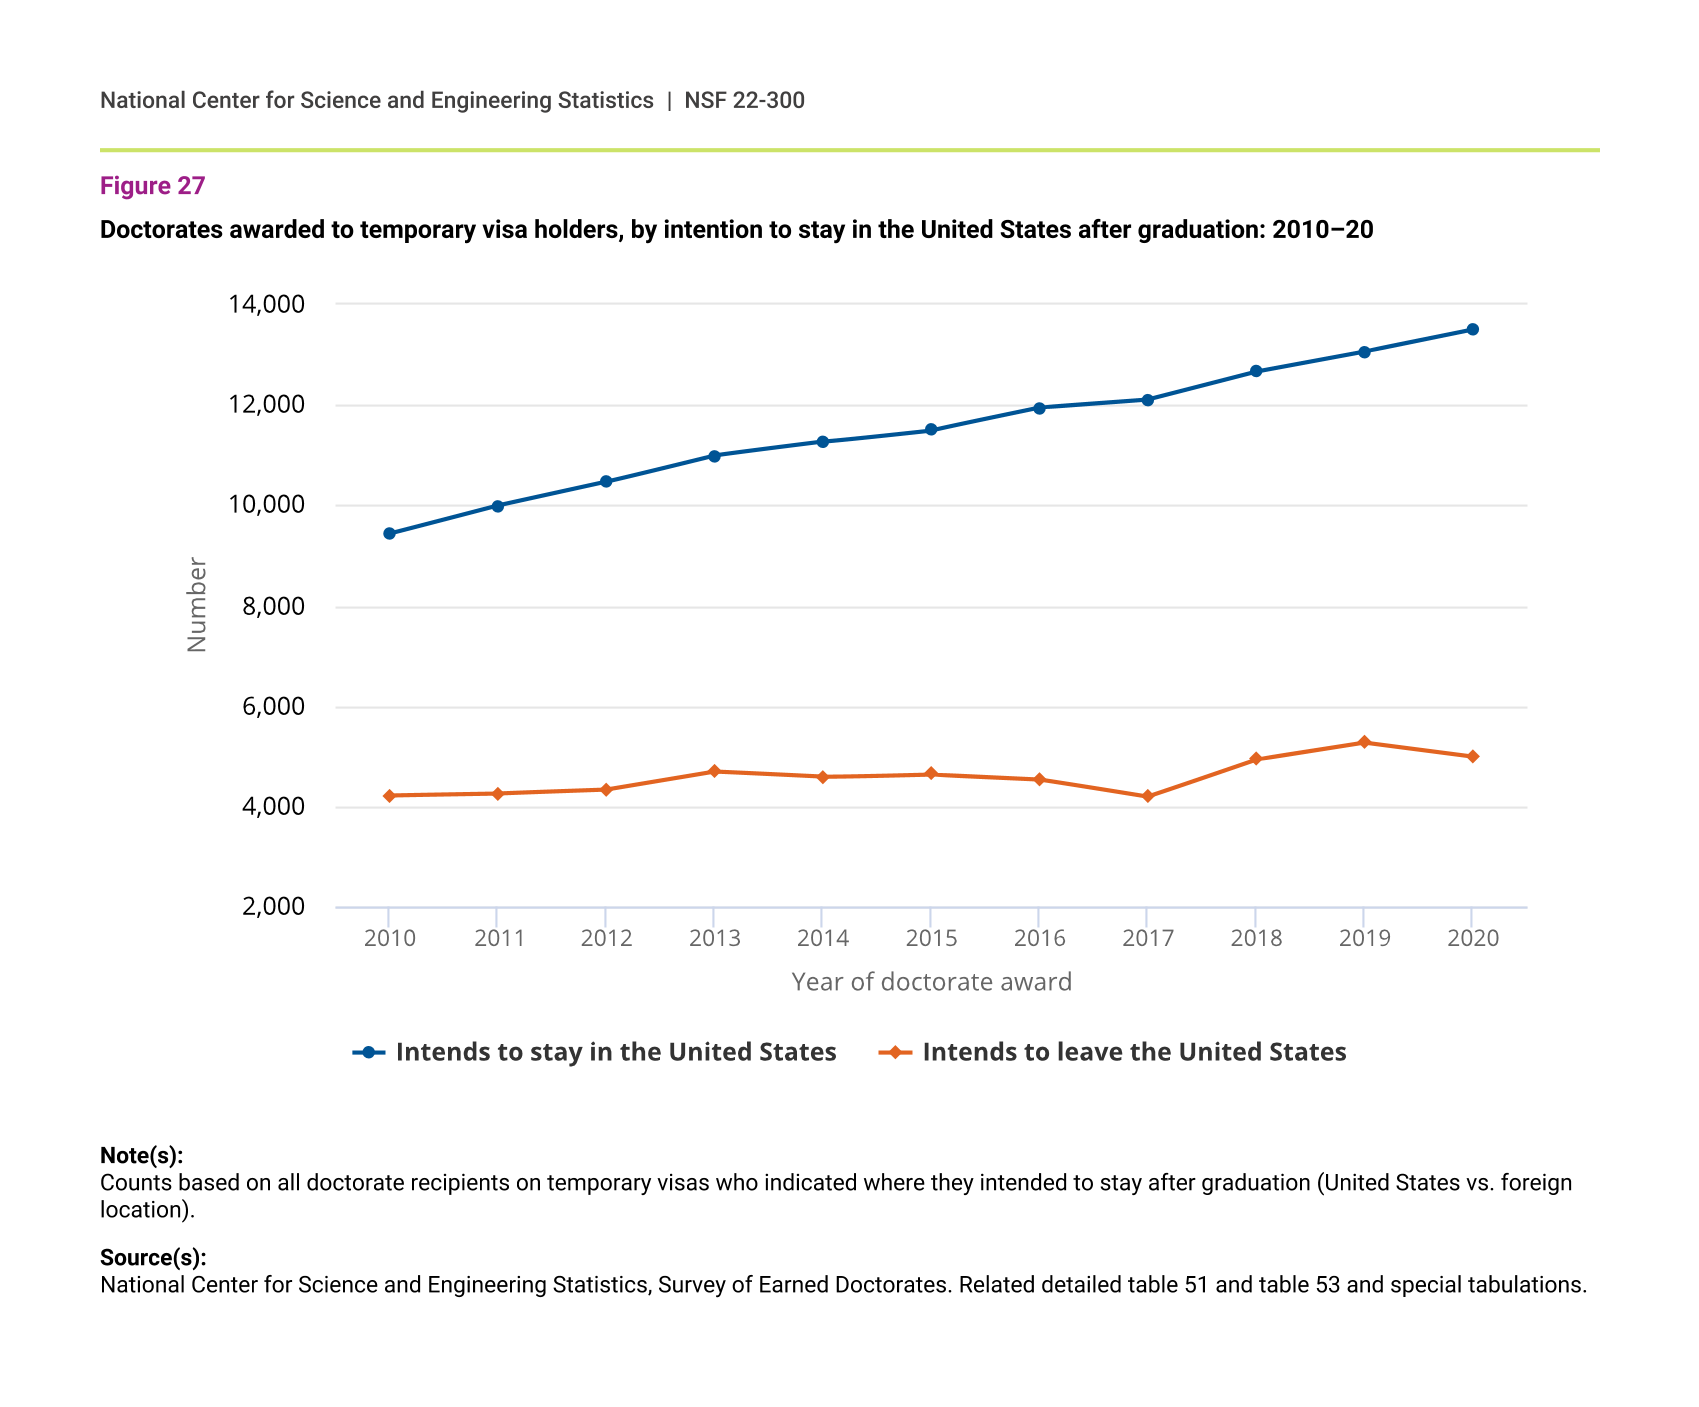
In 2020, 73% of doctorates on temporary visas intended to stay in the United States after graduating (figure 27). This proportion has increased from 69% in 2010, suggesting that the appeal of the United States for highly educated individuals has remained strong.
Doctorates awarded to temporary visa holders, by intention to stay in the United States after graduation: 2010–20
| Year of doctorate award | Intends to stay in the United States | Intends to leave the United States |
|---|---|---|
| 2010 | 9,421 | 4,215 |
| 2011 | 9,984 | 4,251 |
| 2012 | 10,458 | 4,326 |
| 2013 | 10,989 | 4,685 |
| 2014 | 11,258 | 4,581 |
| 2015 | 11,492 | 4,637 |
| 2016 | 11,939 | 4,538 |
| 2017 | 12,098 | 4,190 |
| 2018 | 12,654 | 4,932 |
| 2019 | 13,054 | 5,270 |
| 2020 | 13,492 | 4,990 |
Note(s):
Counts based on all doctorate recipients on temporary visas who indicated where they intended to stay after graduation (United States vs. foreign location).
Intentions and definite plans to stay in the United States, by country
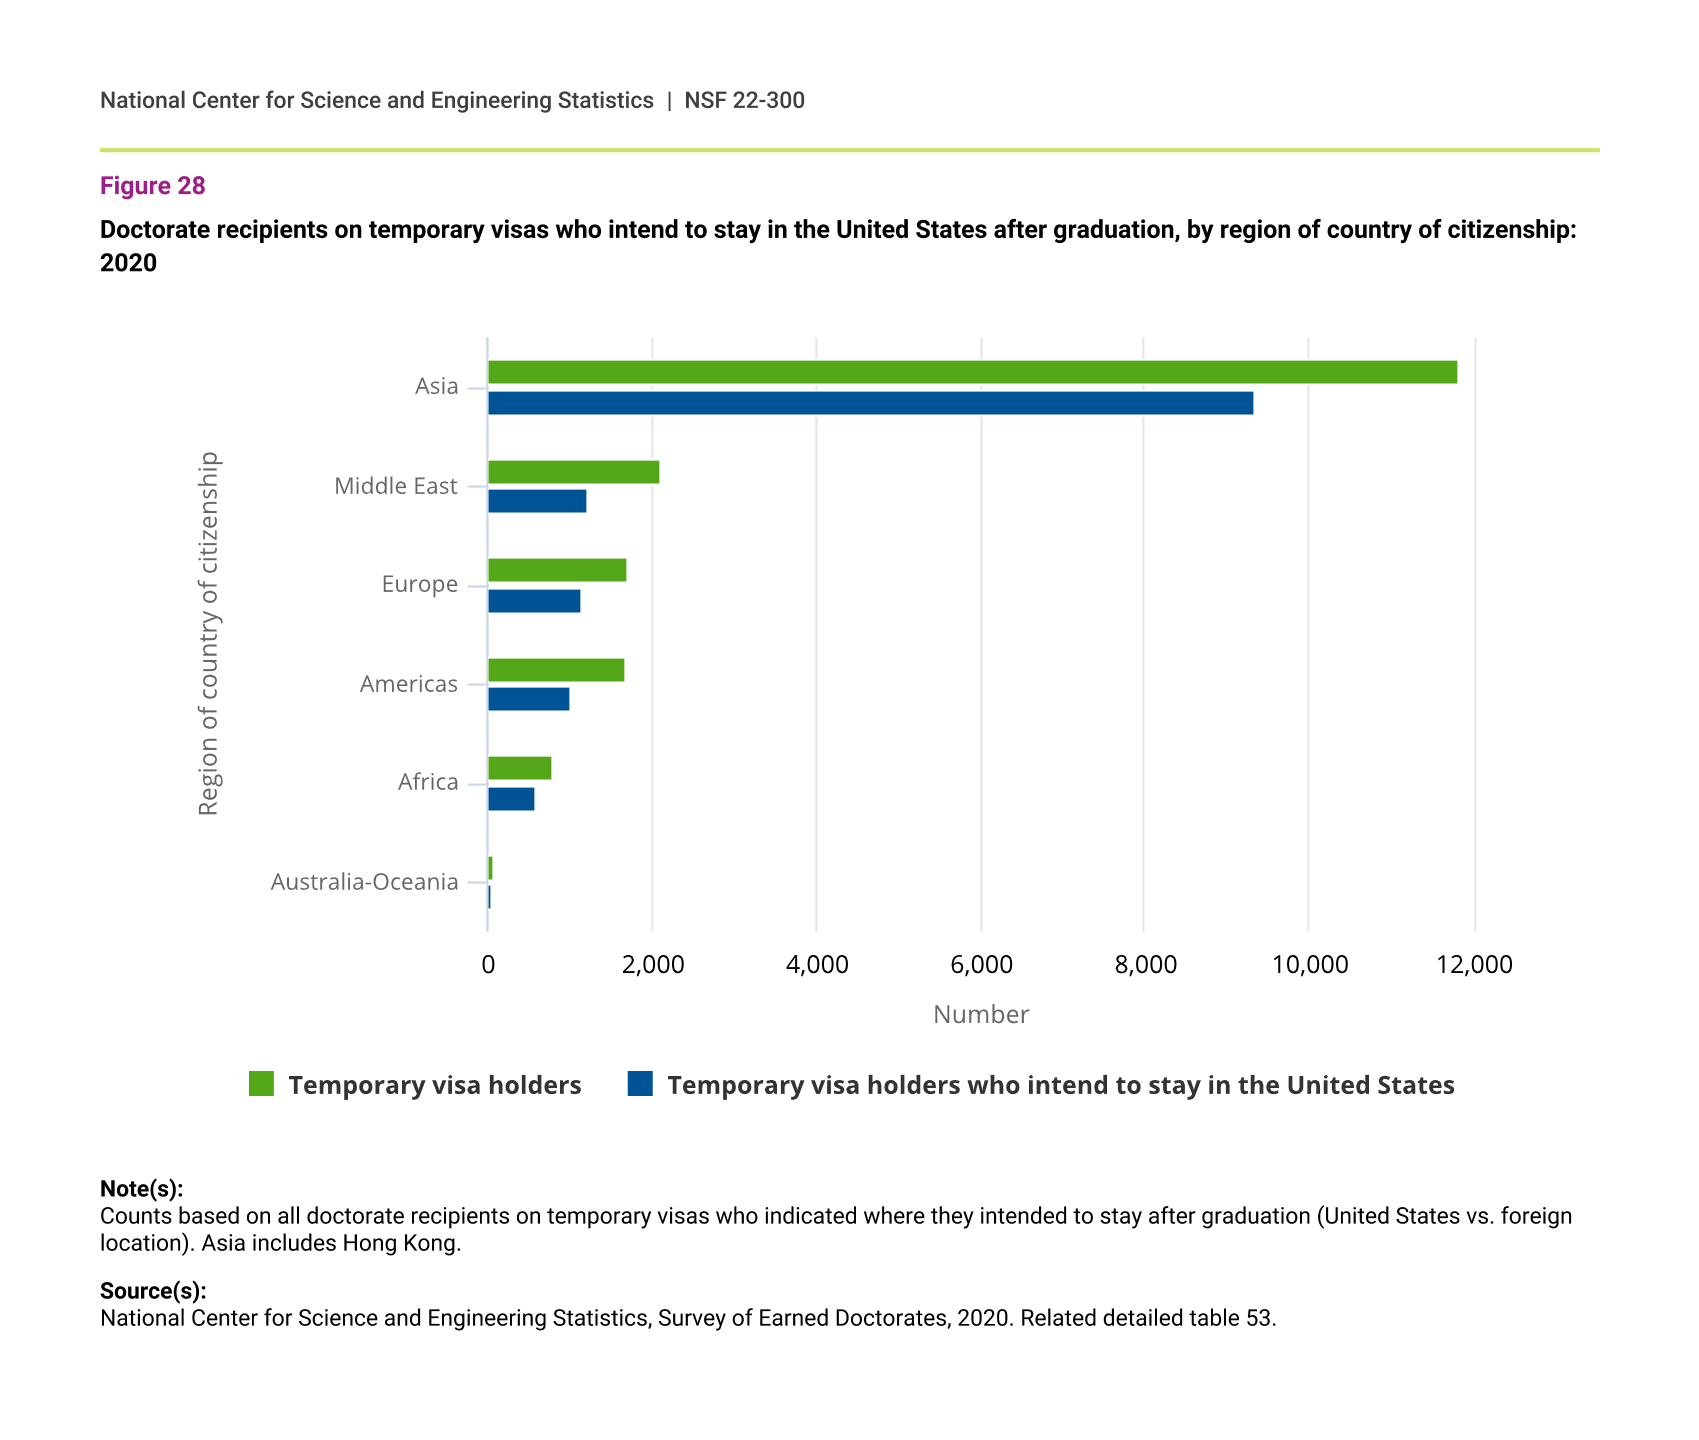
Intentions to stay were highest among doctorate recipients from Asia (79%), the largest group of temporary visa holders, and those from Africa (73%), a much smaller group. They were lowest among doctorate recipients from the Middle East (figure 28).
Doctorate recipients on temporary visas who intend to stay in the United States after graduation, by region of country of citizenship: 2020
| Region of country of citizenship | Temporary visa holders | Temporary visa holders who intend to stay in the United States |
|---|---|---|
| Asia | 11,823 | 9,344 |
| Middle East | 2,101 | 1,218 |
| Europe | 1,710 | 1,151 |
| Americas | 1,664 | 1,003 |
| Africa | 788 | 572 |
| Australia-Oceania | 80 | 51 |
Note(s):
Counts based on all doctorate recipients on temporary visas who indicated where they intended to stay after graduation (United States vs. foreign location). Asia includes Hong Kong.
Source(s):
National Center for Science and Engineering Statistics, Survey of Earned Doctorates, 2020. Related detailed table 53.
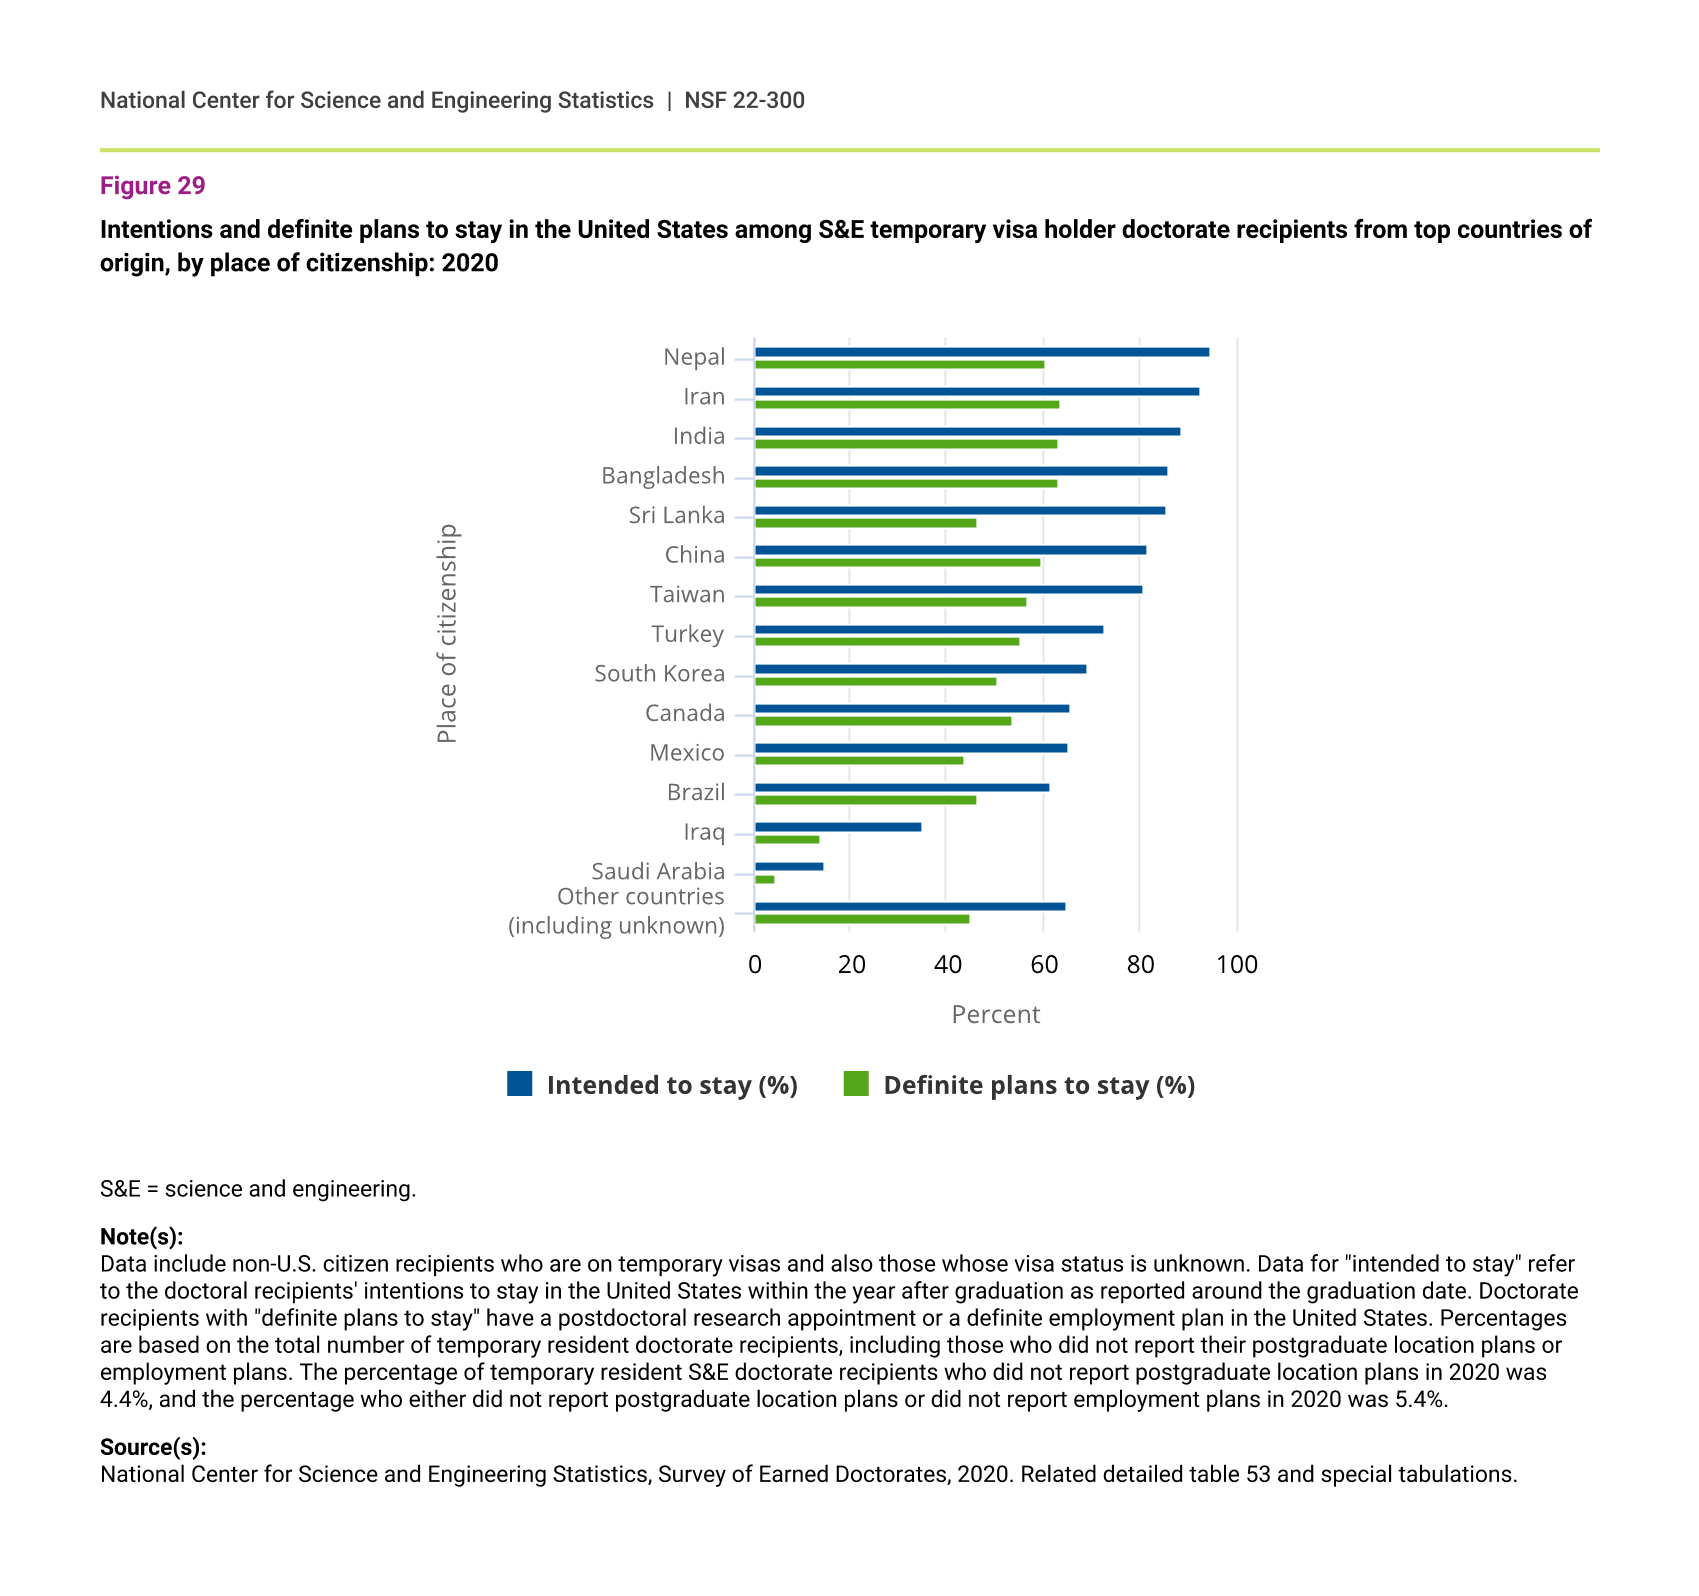
Among S&E doctorate recipients with a temporary visa who are from the top countries of origin and are earning their degree in the United States, more than 80% of those from China, India, Iran, Taiwan, Bangladesh, Sri Lanka, and Nepal indicated they intended to stay in the United States after graduation. More than 56% of the doctorate recipients from these countries (aside from Sri Lanka) had definite employment commitments in the United States after graduating (figure 29).
Among the top ten countries, intention to stay in the United States was lowest among doctorate recipients from Saudi Arabia (15%) and Iraq (35%), with even lower proportions from these countries having definite employment commitments in the United States (4% and 14%, respectively).
Intentions and definite plans to stay in the United States among S&E temporary visa holder doctorate recipients from top countries of origin, by place of citizenship: 2020
| Place of citizenship | Intended to stay (%) | Definite plans to stay (%) |
|---|---|---|
| Nepal | 94.6 | 60.5 |
| Iran | 92.5 | 63.7 |
| India | 88.6 | 63.3 |
| Bangladesh | 86.2 | 63.1 |
| Sri Lanka | 85.7 | 46.4 |
| China | 81.7 | 59.7 |
| Taiwan | 80.8 | 56.6 |
| Turkey | 72.9 | 55.4 |
| South Korea | 69.3 | 50.8 |
| Canada | 65.8 | 53.7 |
| Mexico | 65.3 | 43.9 |
| Brazil | 61.5 | 46.5 |
| Iraq | 35.2 | 13.7 |
| Saudi Arabia | 14.8 | 4.2 |
| Other countries (including unknown) | 65.1 | 45.2 |
S&E = science and engineering.
Note(s):
Data include non-U.S. citizen recipients who are on temporary visas and also those whose visa status is unknown. Data for "intended to stay" refer to the doctoral recipients' intentions to stay in the United States within the year after graduation as reported around the graduation date. Doctorate recipients with "definite plans to stay" have a postdoctoral research appointment or a definite employment plan in the United States. Percentages are based on the total number of temporary resident doctorate recipients, including those who did not report their postgraduate location plans or employment plans. The percentage of temporary resident S&E doctorate recipients who did not report postgraduate location plans in 2020 was 4.4%, and the percentage who either did not report postgraduate location plans or did not report employment plans in 2020 was 5.4%.
Source(s):
National Center for Science and Engineering Statistics, Survey of Earned Doctorates, 2020. Related detailed table 53 and special tabulations.
Intentions and definite plans to stay in the United States, by field
In 2020, intentions to stay in the United States were higher among doctorate recipients in S&E fields (76%) than among those in non-S&E fields (56%). S&E doctorate recipients on temporary visas (54%) reported having definite employment commitments in the United States at higher rates than those in non-S&E fields (39%) (including postdoctoral research appointments).
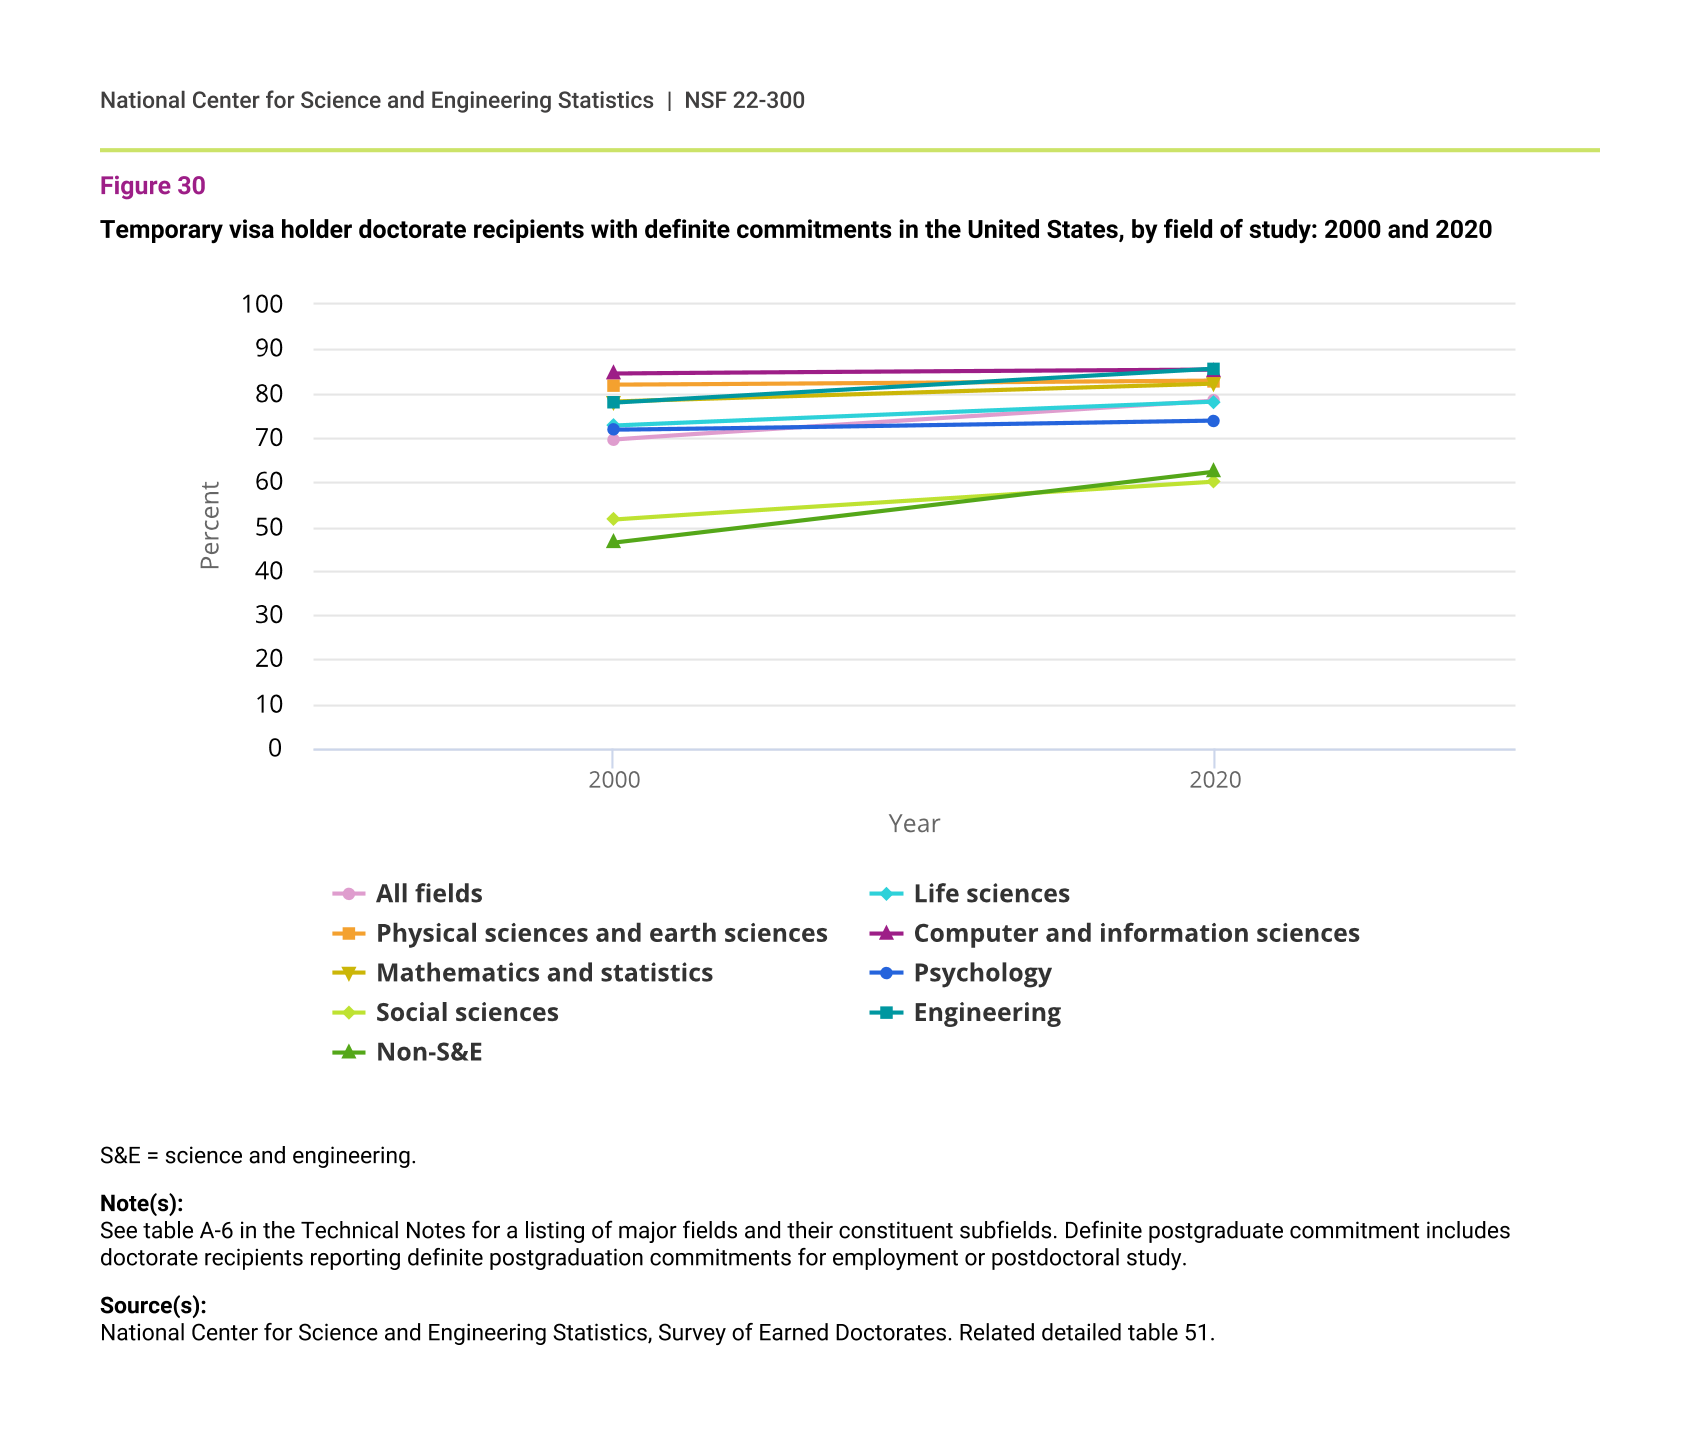
In 2020, 78% of temporary visa holder doctorate recipients with definite commitments for employment indicated that the location of their postdoc or other employment commitment was in the United States, up from 70% in 2000 (figure 30). These expected stay rates were highest in fields where temporary visa holders were more heavily represented: engineering (86%), computer and information sciences (85%), physical sciences and earth sciences (83%), and mathematics and statistics (82%).
In the past 2 decades, expected stay rates grew the most among doctorate recipients with temporary visas in the social sciences and in non-S&E fields (e.g., education, humanities and arts, and other non-S&E fields). However, expected rates among doctorate recipients in these fields remain the lowest of all fields.
Temporary visa holder doctorate recipients with definite commitments in the United States, by field of study: 2000 and 2020
| Year | All fields | Life sciences | Physical sciences and earth sciences | Computer and information sciences | Mathematics and statistics | Psychology | Social sciences | Engineering | Non-S&E |
|---|---|---|---|---|---|---|---|---|---|
| 2000 | 69.6 | 72.7 | 81.8 | 84.4 | 78.1 | 71.7 | 51.6 | 77.8 | 46.4 |
| 2020 | 78.2 | 78.0 | 82.8 | 85.2 | 82.1 | 73.9 | 60.0 | 85.5 | 62.4 |
S&E = science and engineering.
Note(s):
See table A-6 in the Technical Notes for a listing of major fields and their constituent subfields. Definite postgraduate commitment includes doctorate recipients reporting definite postgraduation commitments for employment or postdoctoral study.
Source(s):
National Center for Science and Engineering Statistics, Survey of Earned Doctorates. Related detailed table 51.
Employment commitments, by citizenship status
In 2020, among doctorate recipients with definite employment commitments who reported the status of their postgraduation plans, equal proportions of temporary visa holders and U.S. citizens or permanent residents had firm employment plans after they earned their degree (70% each). The sections that follow focus on this segment of doctorate recipients who reported having definite employment commitments after graduation and on the differences by citizenship status.
Plans for employment versus plans for postdoctoral study
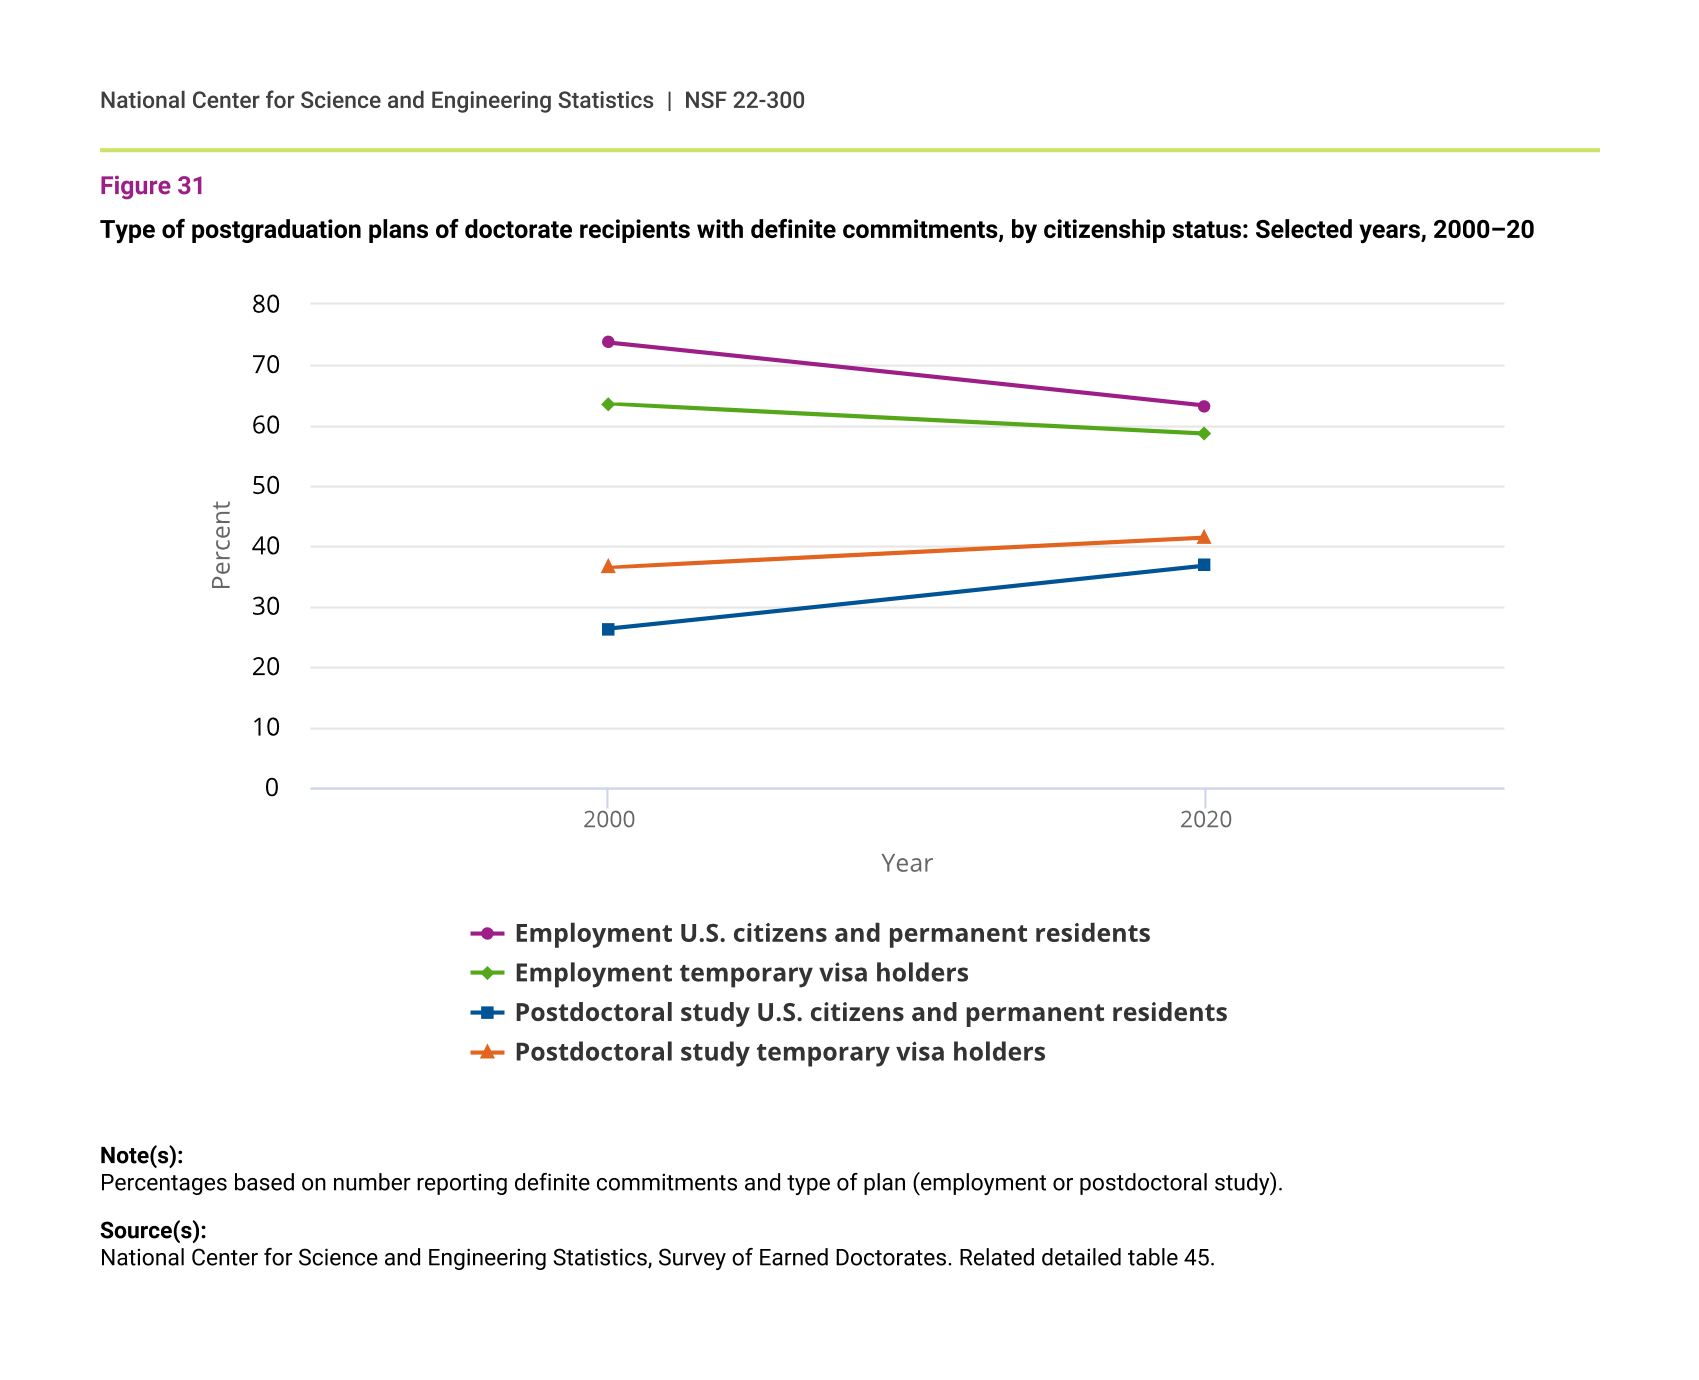
Over the past 2 decades, U.S. citizens and permanent residents have had plans for employment in non-postdoc positions at higher rates than did those on temporary visas. In contrast, temporary visa holders have had plans for postdoctoral study at higher rates than did U.S. citizens and permanent residents (figure 31). These differences narrowed over the past 20 years. In 2020, 63% of U.S. citizens and permanent residents had definite commitments for employment and 37% for postdoctoral study, compared with 59% and 41%, respectively, for their temporary visa holder counterparts.
Type of postgraduation plans of doctorate recipients with definite commitments, by citizenship status: Selected years, 2000–20
| Year | Employment U.S. citizens and permanent residents | Employment temporary visa holders | Postdoctoral study U.S. citizens and permanent residents | Postdoctoral study temporary visa holders |
|---|---|---|---|---|
| 2000 | 73.7 | 63.5 | 26.3 | 36.5 |
| 2020 | 63.2 | 58.6 | 36.8 | 41.4 |
Note(s):
Percentages based on number reporting definite commitments and type of plan (employment or postdoctoral study).
Source(s):
National Center for Science and Engineering Statistics, Survey of Earned Doctorates. Related detailed table 45.
Definite commitments by citizenship status and field
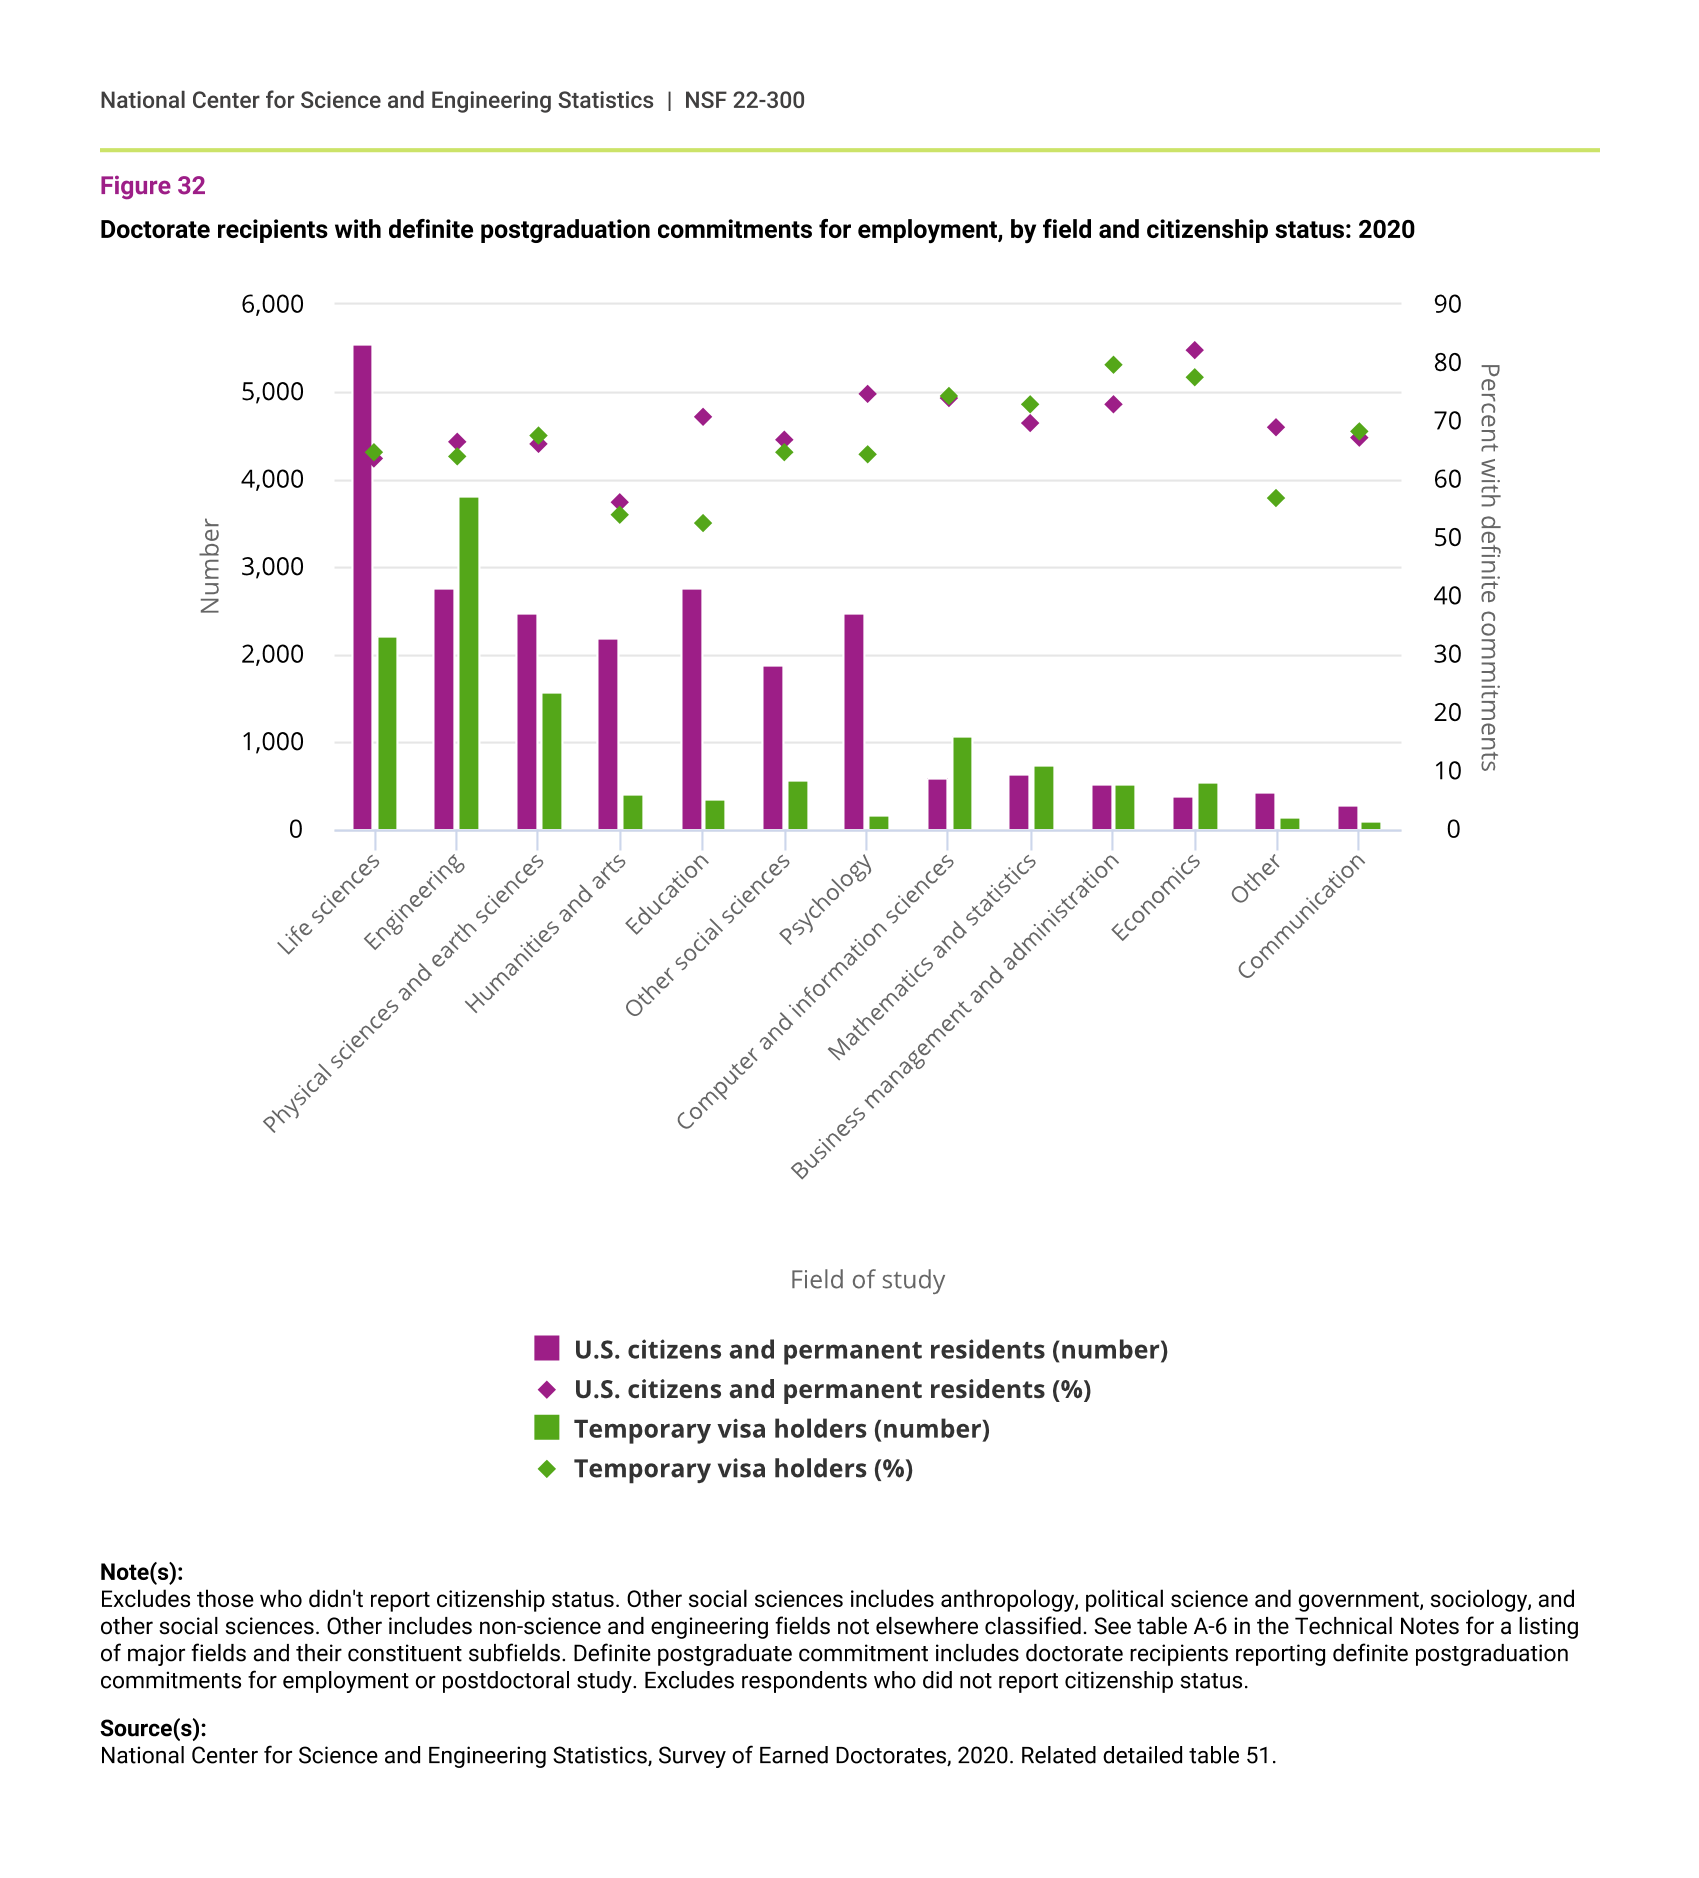
In engineering, computer and information sciences, and mathematics and statistics, larger numbers of temporary visa holders than U.S. citizens and permanent residents had definite postgraduation commitments for employment after graduation (postdoctoral study and non-postdoc positions) (figure 32). In these fields, the proportion of doctorate recipients with definite commitments was similar for both citizenship groups. In the life sciences, physical and earth sciences, psychology, other social sciences, and non-S&E fields, the number of U.S. citizens and permanent residents with definite employment commitments after graduation surpassed that of temporary visa holders.
Doctorate recipients with definite postgraduation commitments for employment, by field and citizenship status: 2020
| Field of study | U.S. citizens and permanent residents (number) | U.S. citizens and permanent residents (%) | Temporary visa holders (number) | Temporary visa holders (%) |
|---|---|---|---|---|
| Life sciences | 5,537 | 63.6 | 2,222 | 64.8 |
| Engineering | 2,762 | 66.5 | 3,819 | 64.1 |
| Physical sciences and earth sciences | 2,471 | 66.1 | 1,560 | 67.5 |
| Humanities and arts | 2,196 | 56.1 | 400 | 53.9 |
| Education | 2,760 | 70.8 | 347 | 52.5 |
| Other social sciences | 1,888 | 66.7 | 570 | 64.5 |
| Psychology | 2,482 | 74.8 | 165 | 64.2 |
| Computer and information sciences | 597 | 73.9 | 1,078 | 74.2 |
| Mathematics and statistics | 645 | 69.5 | 747 | 73.0 |
| Business management and administration | 517 | 72.9 | 524 | 79.6 |
| Economics | 377 | 82.1 | 536 | 77.6 |
| Other | 425 | 68.9 | 150 | 56.8 |
| Communication | 276 | 67.0 | 105 | 68.2 |
Note(s):
Excludes those who didn't report citizenship status. Other social sciences includes anthropology, political science and government, sociology, and other social sciences. Other includes non-science and engineering fields not elsewhere classified. See table A-6 in the Technical Notes for a listing of major fields and their constituent subfields. Definite postgraduate commitment includes doctorate recipients reporting definite postgraduation commitments for employment or postdoctoral study. Excludes respondents who did not report citizenship status.
Source(s):
National Center for Science and Engineering Statistics, Survey of Earned Doctorates, 2020. Related detailed table 51.
Location and sector of employment commitments by citizenship status
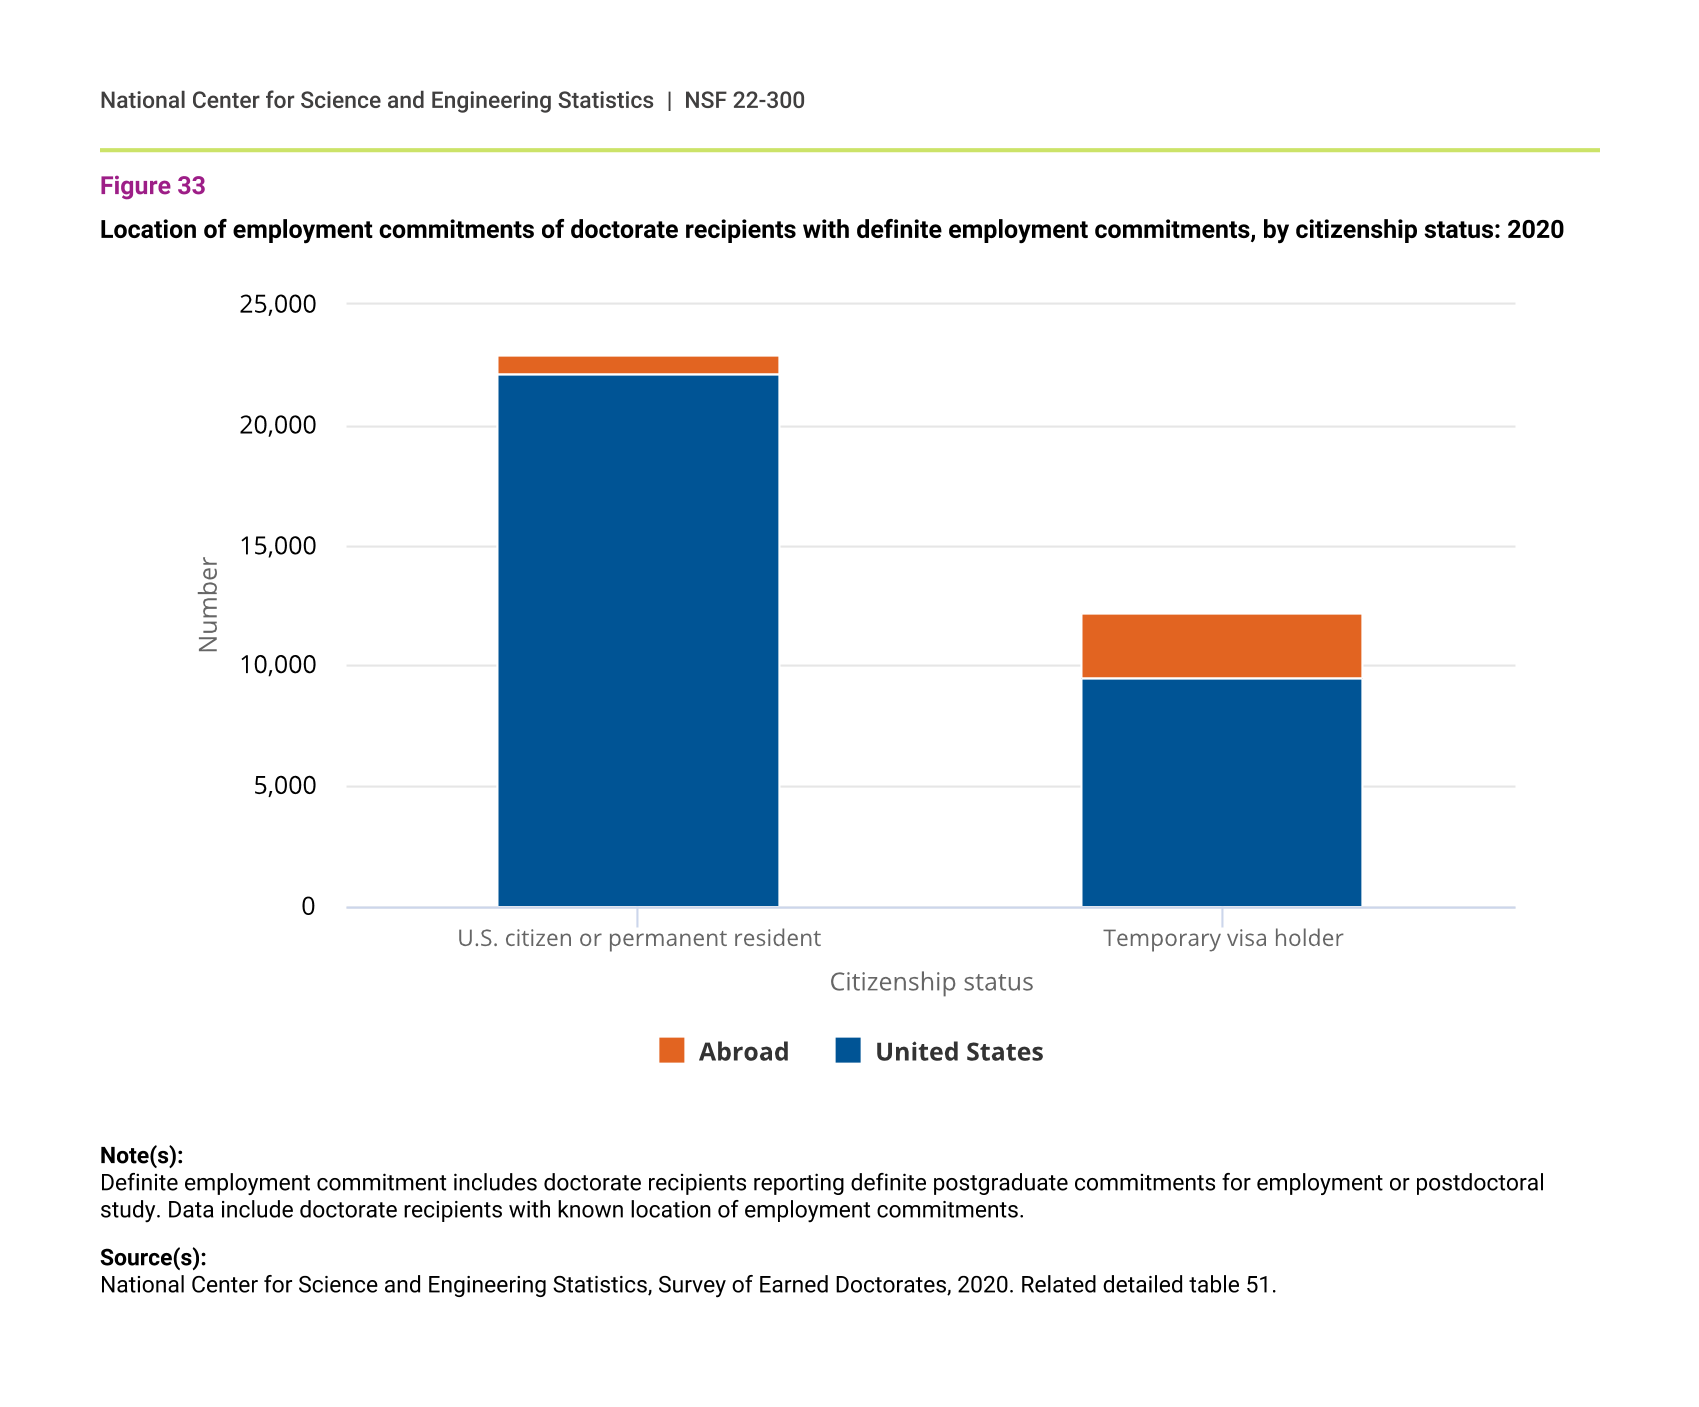
In 2020, the vast majority of U.S. citizens and permanent residents (97%) with definite employment commitments (including postdoctoral study) after graduation indicated that the job location was in the United States, compared with 78% of their temporary visa holder counterparts (figure 33).
Location of employment commitments of doctorate recipients with definite employment commitments, by citizenship status: 2020
| Citizenship status | United States | Abroad |
|---|---|---|
| U.S. citizen or permanent resident | 22,176 | 753 |
| Temporary visa holder | 9,558 | 2,660 |
Note(s):
Definite employment commitment includes doctorate recipients reporting definite postgraduate commitments for employment or postdoctoral study. Data include doctorate recipients with known location of employment commitments.
Source(s):
National Center for Science and Engineering Statistics, Survey of Earned Doctorates, 2020. Related detailed table 51.
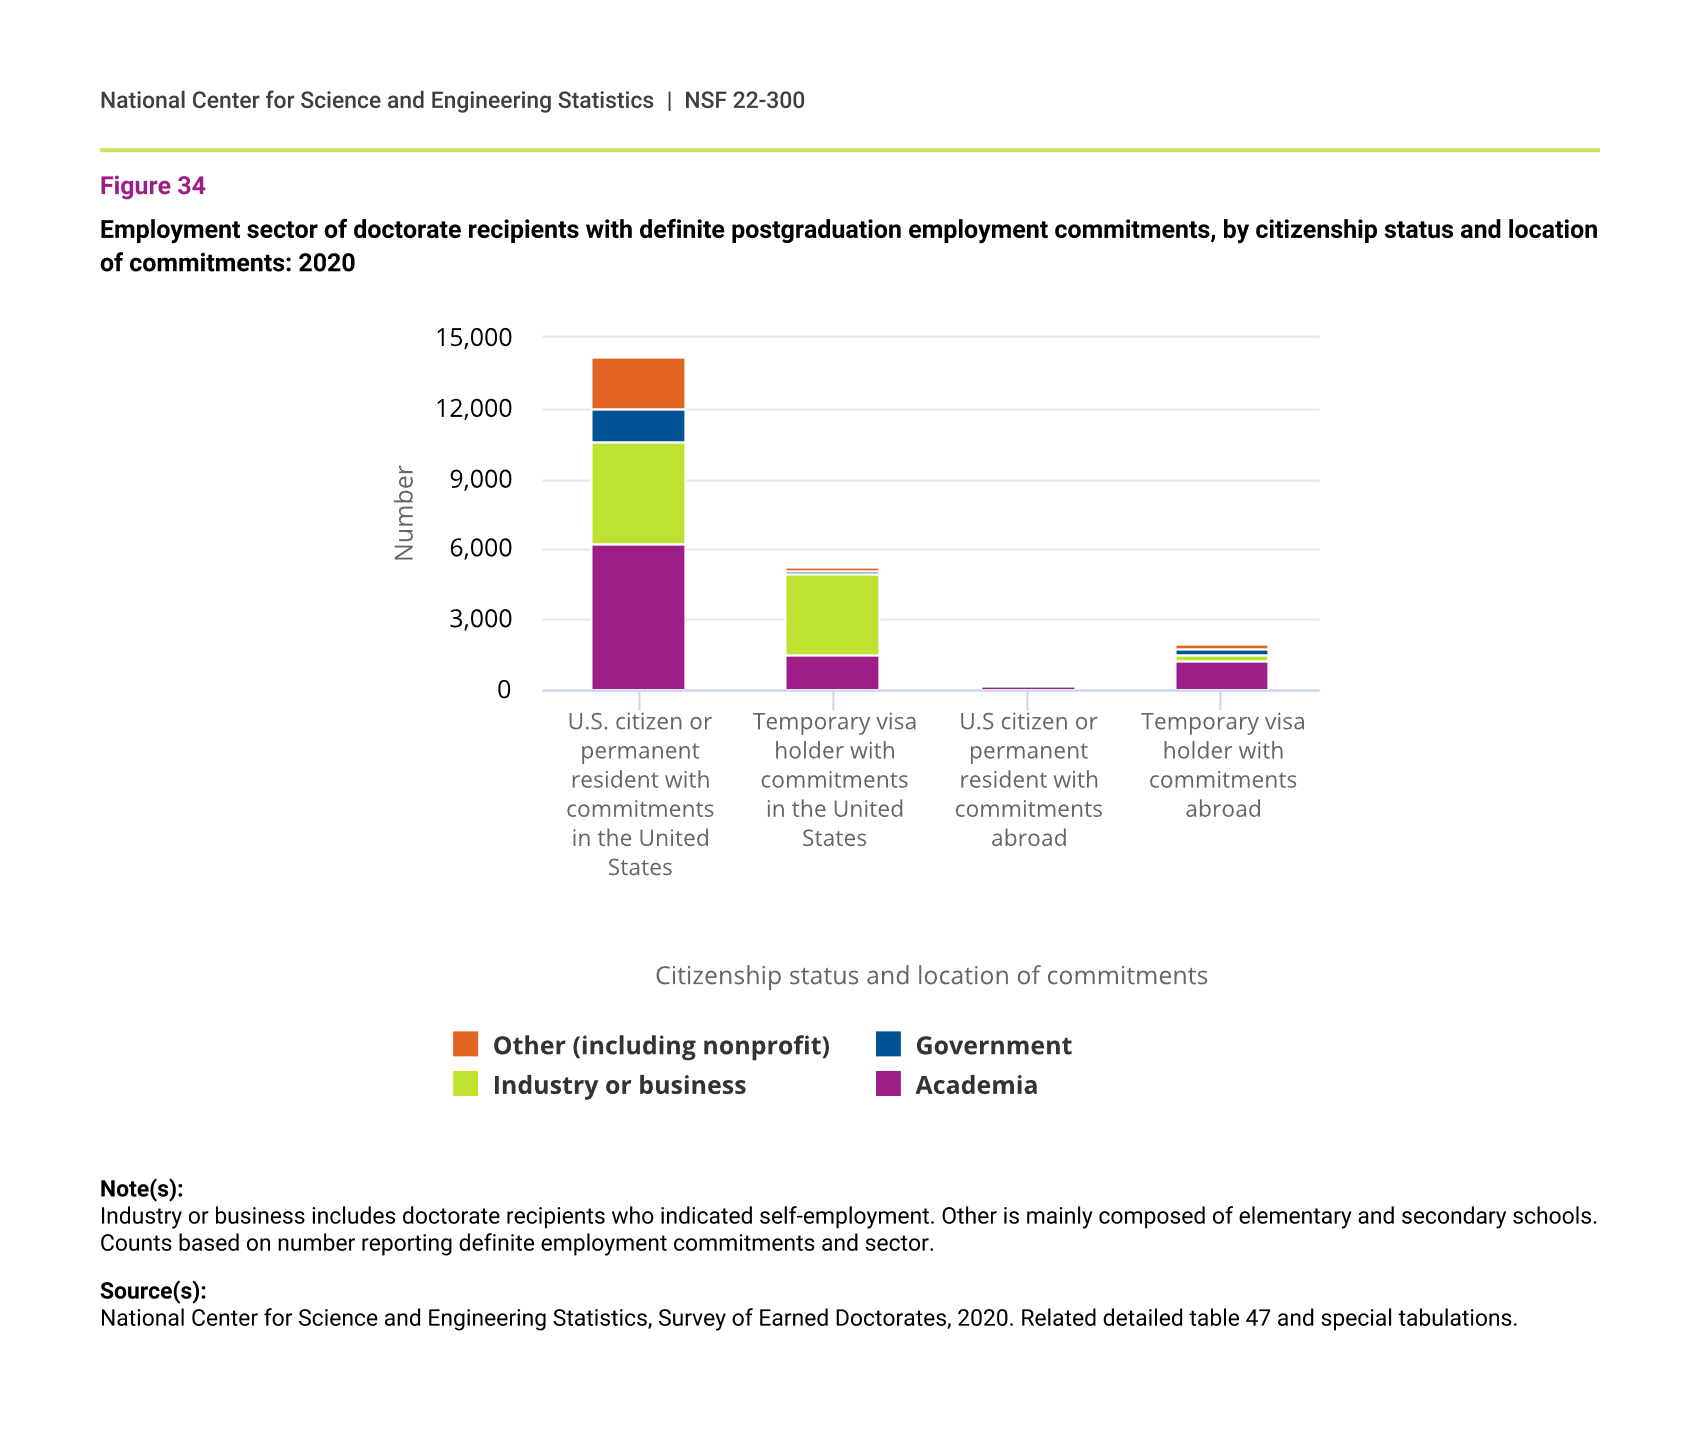
The employment sector of doctorate recipients with definite postgraduation commitments varies by their citizenship status as well as by the location of their job commitment (figure 34). In 2020, 44% of doctorate recipients who were U.S citizens and permanent residents with jobs in the United States, the largest group, had a job lined up in academia compared to 28% of their temporary visa holder counterparts with employment commitments in the United States. In contrast, 67% of temporary visa holders with commitments in the United States had employment commitments in industry or business compared to 30% of U.S. citizens and permanent residents.
Employment sector of doctorate recipients with definite postgraduation employment commitments, by citizenship status and location of commitments: 2020
| Citizenship status and location of commitments | Academia | Industry or business |
Government | Other (including nonprofit) |
|---|---|---|---|---|
| U.S. citizen or permanent resident with commitments in the United States | 6,242 | 4,300 | 1,432 | 2,267 |
| Temporary visa holder with commitments in the United States | 1,479 | 3,504 | 78 | 180 |
| U.S citizen or permanent resident with commitments abroad | 149 | 51 | 14 | 40 |
| Temporary visa holder with commitments abroad | 1,203 | 344 | 213 | 154 |
Note(s):
Industry or business includes doctorate recipients who indicated self-employment. Other is mainly composed of elementary and secondary schools. Counts based on number reporting definite employment commitments and sector.
Source(s):
National Center for Science and Engineering Statistics, Survey of Earned Doctorates, 2020. Related detailed table 47 and special tabulations.
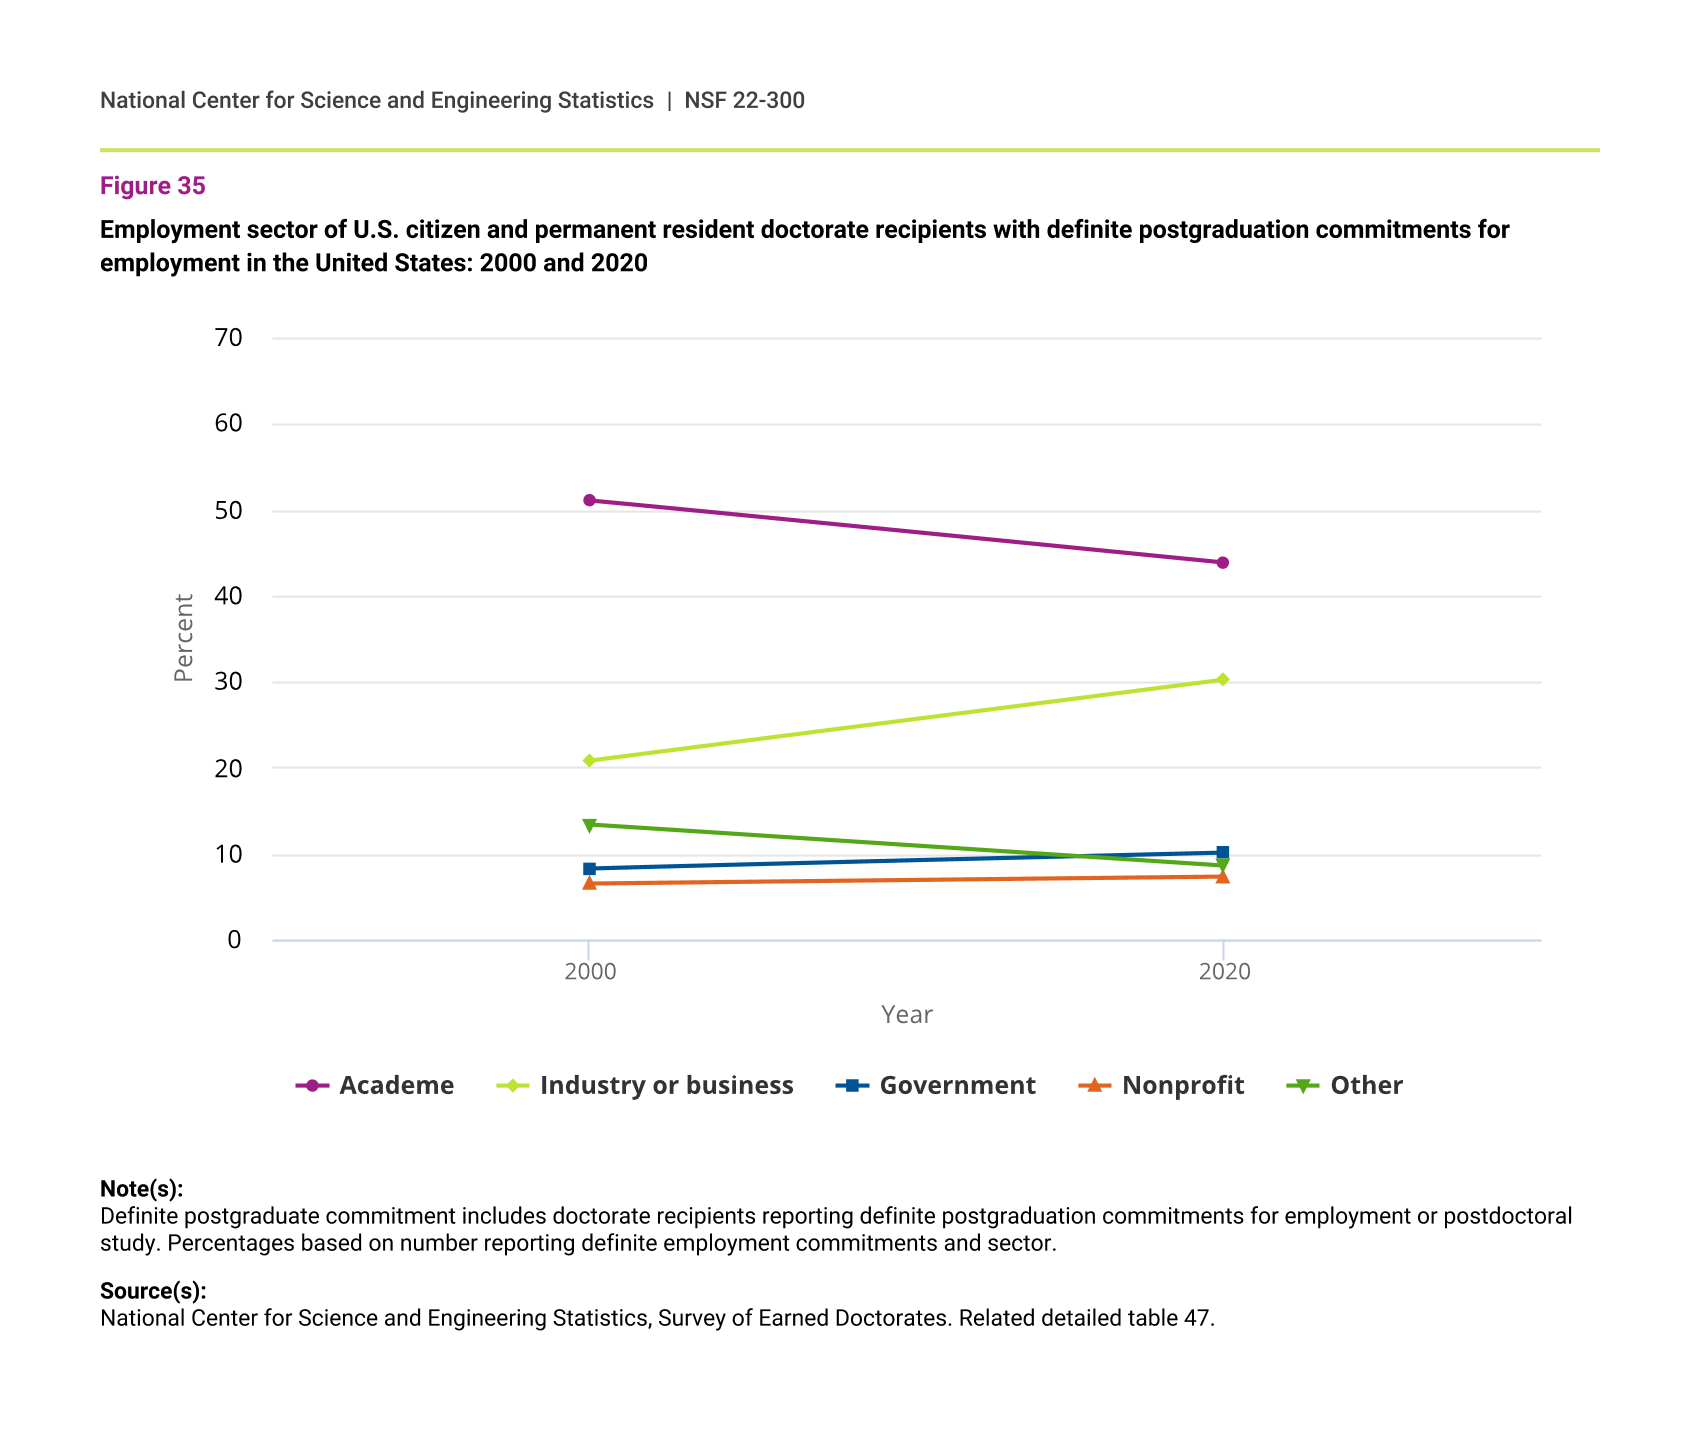
A greater proportion of temporary visa holder doctorate recipients with commitments abroad accepted positions in the academic sector (63%) than in the industry or business sector (18%). These patterns have been prevalent since at least 2000 (figure 35 and figure 36). During the past 2 decades, regardless of citizenship status, the proportion of doctorate recipients with definite postgraduation commitments for employment in academia has declined and those in the industry or business sector has grown.
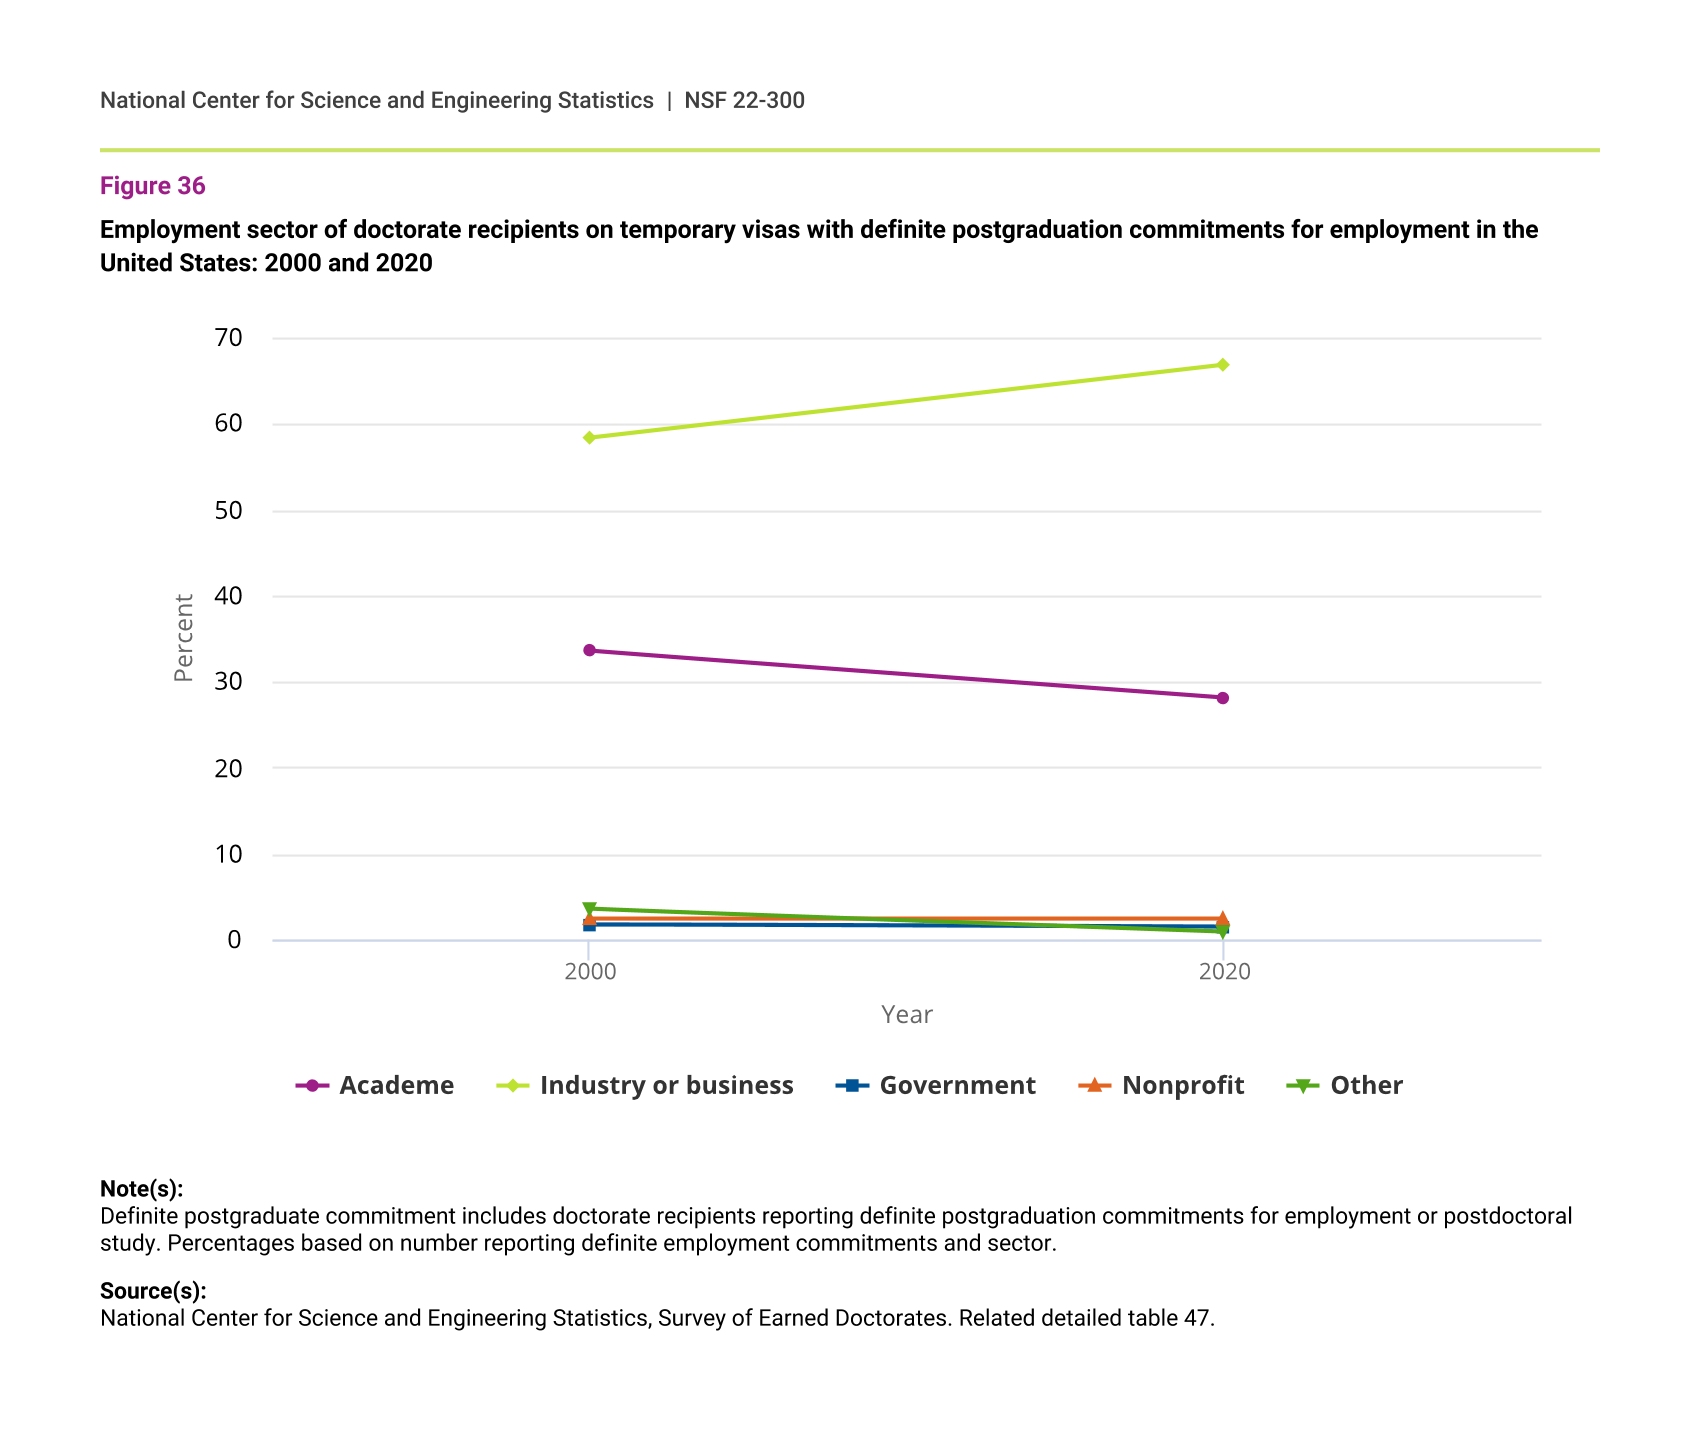
In 2020, 44% of U.S. citizens and permanent residents with definite postgraduation commitments for employment in the United States had committed to jobs in academia (down from 51% in 2000), and 30% were planning on working in industry or business (up from 21% in 2000) (figure 35). Among their temporary visa holder counterparts, 67% had lined up jobs in industry or business (up from 58% in 2000), and 28% had commitments in academia (down from 34% in 2000) (figure 36).
Employment sector of U.S. citizen and permanent resident doctorate recipients with definite postgraduation commitments for employment in the United States: 2000 and 2020
| Year | Academe | Industry or business | Government | Nonprofit | Other |
|---|---|---|---|---|---|
| 2000 | 51.1 | 20.8 | 8.3 | 6.5 | 13.4 |
| 2020 | 43.8 | 30.2 | 10.1 | 7.3 | 8.6 |
Note(s):
Definite postgraduate commitment includes doctorate recipients reporting definite postgraduation commitments for employment or postdoctoral study. Percentages based on number reporting definite employment commitments and sector.
Source(s):
National Center for Science and Engineering Statistics, Survey of Earned Doctorates. Related detailed table 47.
Employment sector of doctorate recipients on temporary visas with definite postgraduation commitments for employment in the United States: 2000 and 2020
| Year | Academe | Industry or business | Government | Nonprofit | Other |
|---|---|---|---|---|---|
| 2000 | 33.6 | 58.4 | 1.8 | 2.5 | 3.6 |
| 2020 | 28.2 | 66.9 | 1.5 | 2.5 | 1.0 |
Note(s):
Definite postgraduate commitment includes doctorate recipients reporting definite postgraduation commitments for employment or postdoctoral study. Percentages based on number reporting definite employment commitments and sector.
Source(s):
National Center for Science and Engineering Statistics, Survey of Earned Doctorates. Related detailed table 47.