 An official website of the United States government
 Path to the doctorate
Some paths to the doctoral degree are less traveled and some are more difficult to navigate, owing to a variety of influences that shape doctoral study. These paths may lead to different postgraduate destinations.
Parental education
Overview
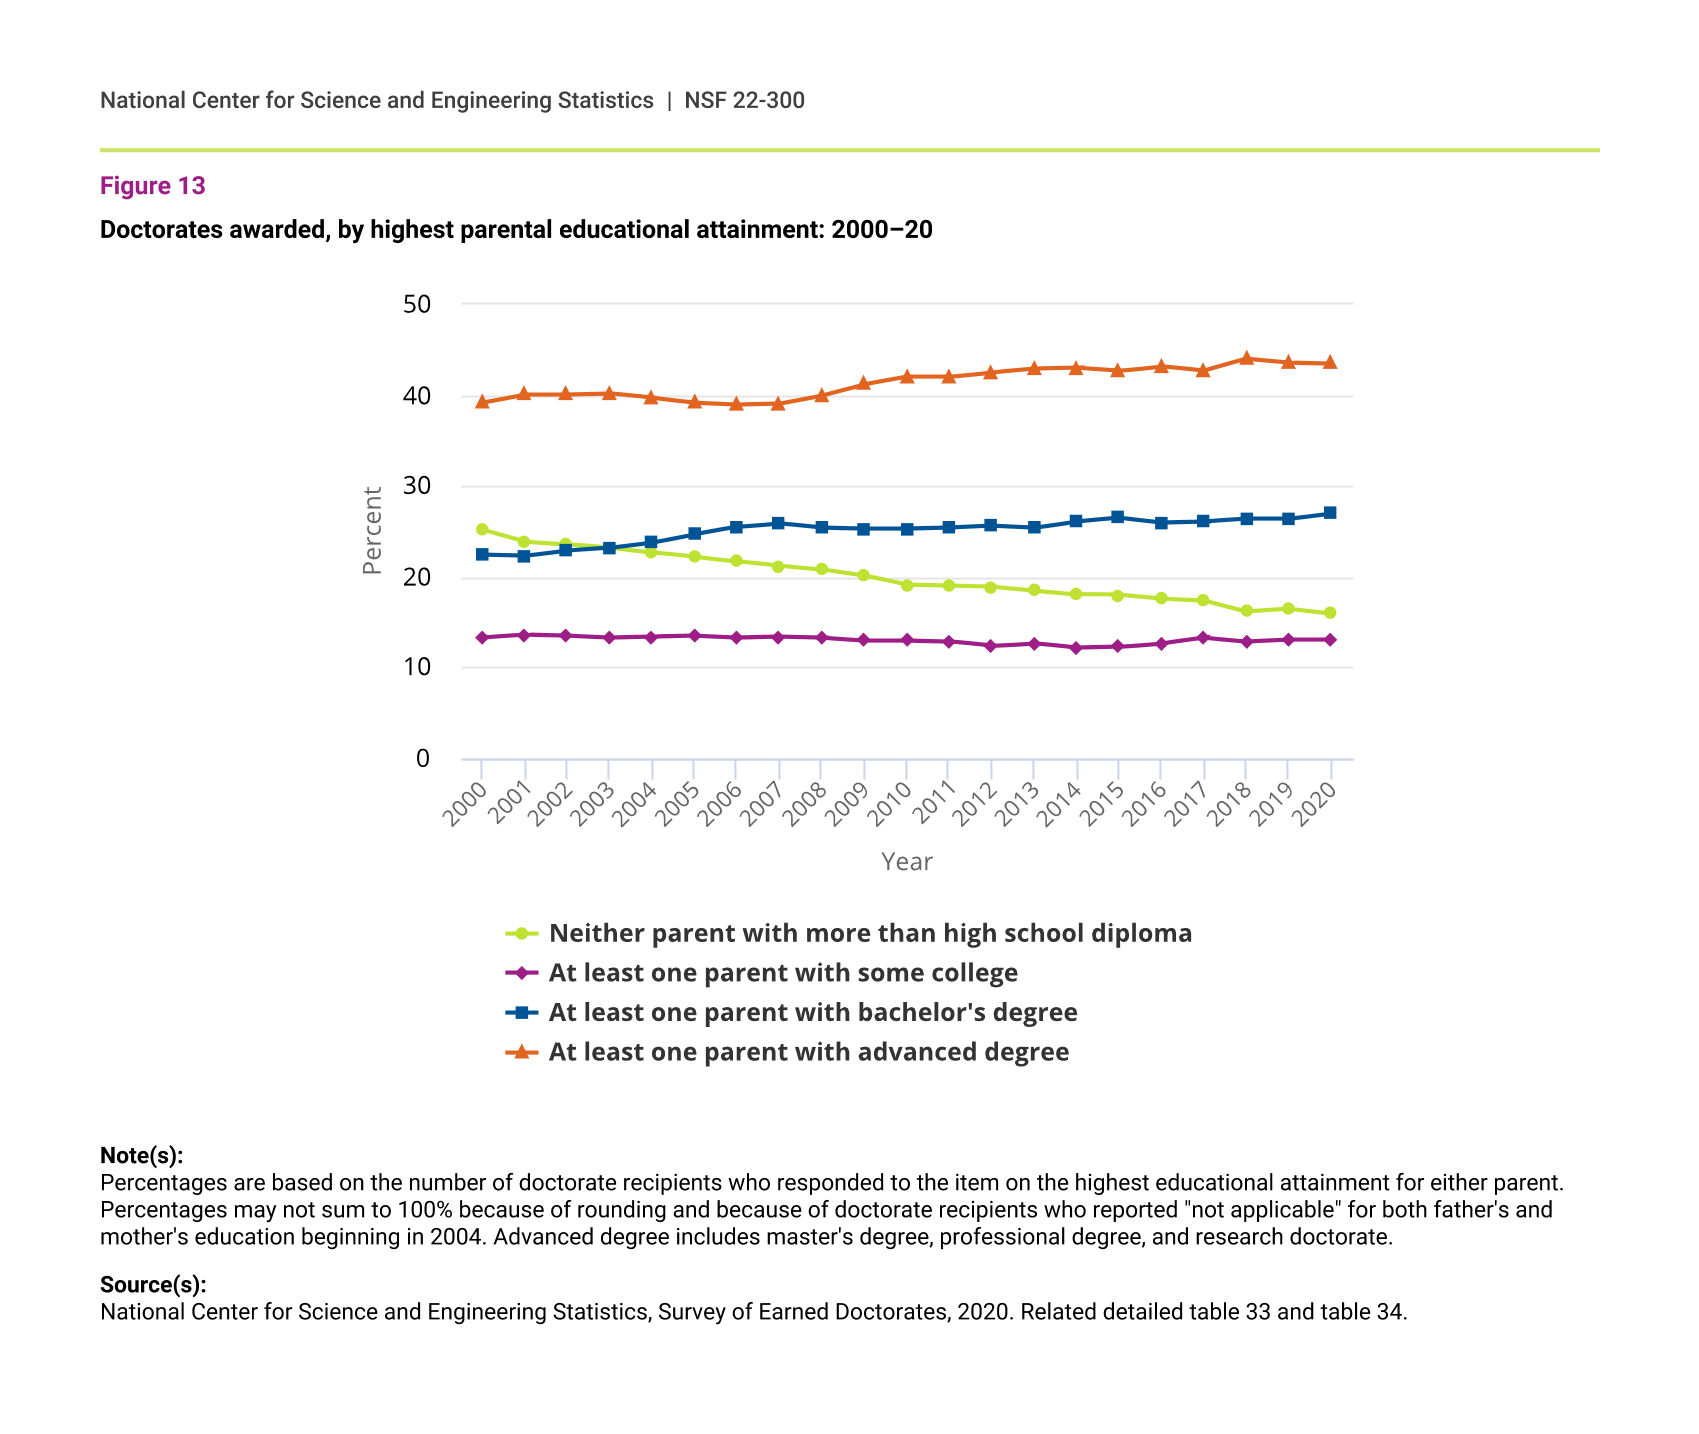
The parents of recent doctorate recipients are better educated than the parents of earlier cohorts of doctorate recipients. The share of doctorate recipients from families in which neither parent has earned more than a high school diploma declined in the past 20 years. In contrast, the shares of doctorate recipients from families with at least one parent holding bachelor’s degree increased (figure 13).
Doctorates awarded, by highest parental educational attainment: 2000–20
| Year | Neither parent with more than high school diploma | At least one parent with some college | At least one parent with bachelor's degree | At least one parent with advanced degree |
|---|---|---|---|---|
| 2000 | 25.2 | 13.3 | 22.4 | 39.2 |
| 2001 | 23.9 | 13.6 | 22.3 | 40.1 |
| 2002 | 23.6 | 13.5 | 22.9 | 40.1 |
| 2003 | 23.2 | 13.3 | 23.2 | 40.2 |
| 2004 | 22.7 | 13.4 | 23.8 | 39.7 |
| 2005 | 22.2 | 13.5 | 24.7 | 39.2 |
| 2006 | 21.7 | 13.3 | 25.5 | 39.0 |
| 2007 | 21.2 | 13.4 | 25.9 | 39.1 |
| 2008 | 20.8 | 13.3 | 25.4 | 40.0 |
| 2009 | 20.1 | 13.0 | 25.3 | 41.2 |
| 2010 | 19.1 | 13.0 | 25.3 | 42.0 |
| 2011 | 19.0 | 12.9 | 25.4 | 42.0 |
| 2012 | 18.9 | 12.4 | 25.6 | 42.5 |
| 2013 | 18.5 | 12.7 | 25.4 | 42.9 |
| 2014 | 18.1 | 12.2 | 26.1 | 43.0 |
| 2015 | 18.0 | 12.3 | 26.5 | 42.7 |
| 2016 | 17.6 | 12.7 | 26.0 | 43.2 |
| 2017 | 17.4 | 13.3 | 26.1 | 42.7 |
| 2018 | 16.2 | 12.9 | 26.4 | 44.0 |
| 2019 | 16.5 | 13.1 | 26.4 | 43.6 |
| 2020 | 16.0 | 13.1 | 27.0 | 43.5 |
Note(s):
Percentages are based on the number of doctorate recipients who responded to the item on the highest educational attainment for either parent. Percentages may not sum to 100% because of rounding and because of doctorate recipients who reported "not applicable" for both father's and mother's education beginning in 2004. Advanced degree includes master's degree, professional degree, and research doctorate.
Race and ethnicity
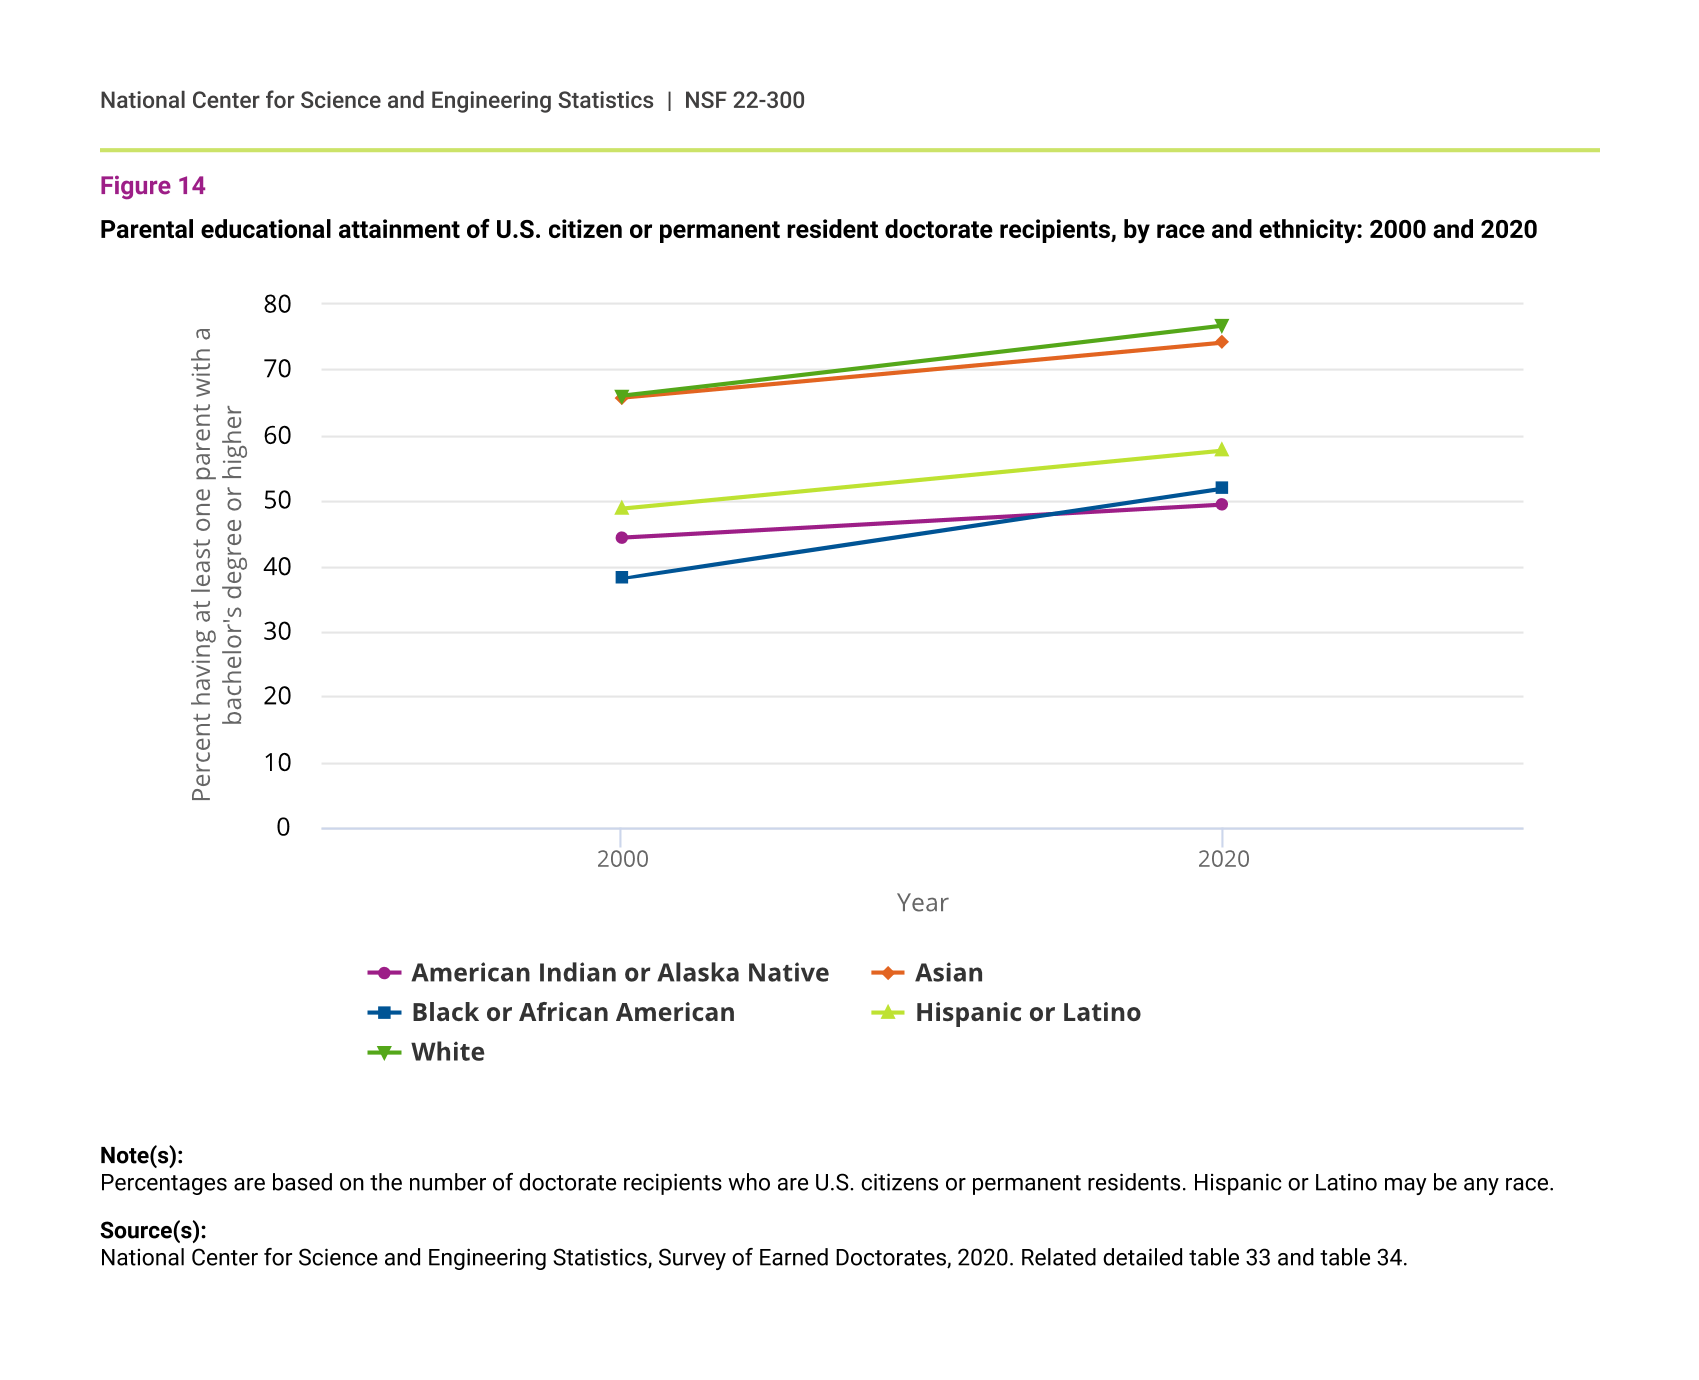
The pattern of rising parental educational attainment is visible among all races and ethnicities for doctorate recipients who are U.S. citizens or permanent residents (figure 14).
Nonetheless, a smaller proportion of doctorate recipients who are underrepresented minorities—Black or African American, Hispanic or Latino, and American Indian or Alaska Native—have at least one parent with a bachelor’s degree than Asian or White doctorate recipients.
In 2020, about 75% of doctorate recipients who were Asian or who were White came from families having at least one parent who had a bachelor’s degree or higher, compared with between 49% and 58% of doctorate recipients who were Black or African American, American Indian or Alaska Native, or Hispanic or Latino.
Parental educational attainment of U.S. citizen or permanent resident doctorate recipients, by race and ethnicity: 2000 and 2020
| Year | American Indian or Alaska Native | Asian | Black or African American | Hispanic or Latino | White |
|---|---|---|---|---|---|
| 2000 | 44.3 | 65.7 | 38.1 | 48.7 | 66.0 |
| 2020 | 49.4 | 74.2 | 51.8 | 57.6 | 76.8 |
Note(s):
Percentages are based on the number of doctorate recipients who are U.S. citizens or permanent residents. Hispanic or Latino may be any race.
Sources of financial support
Overview
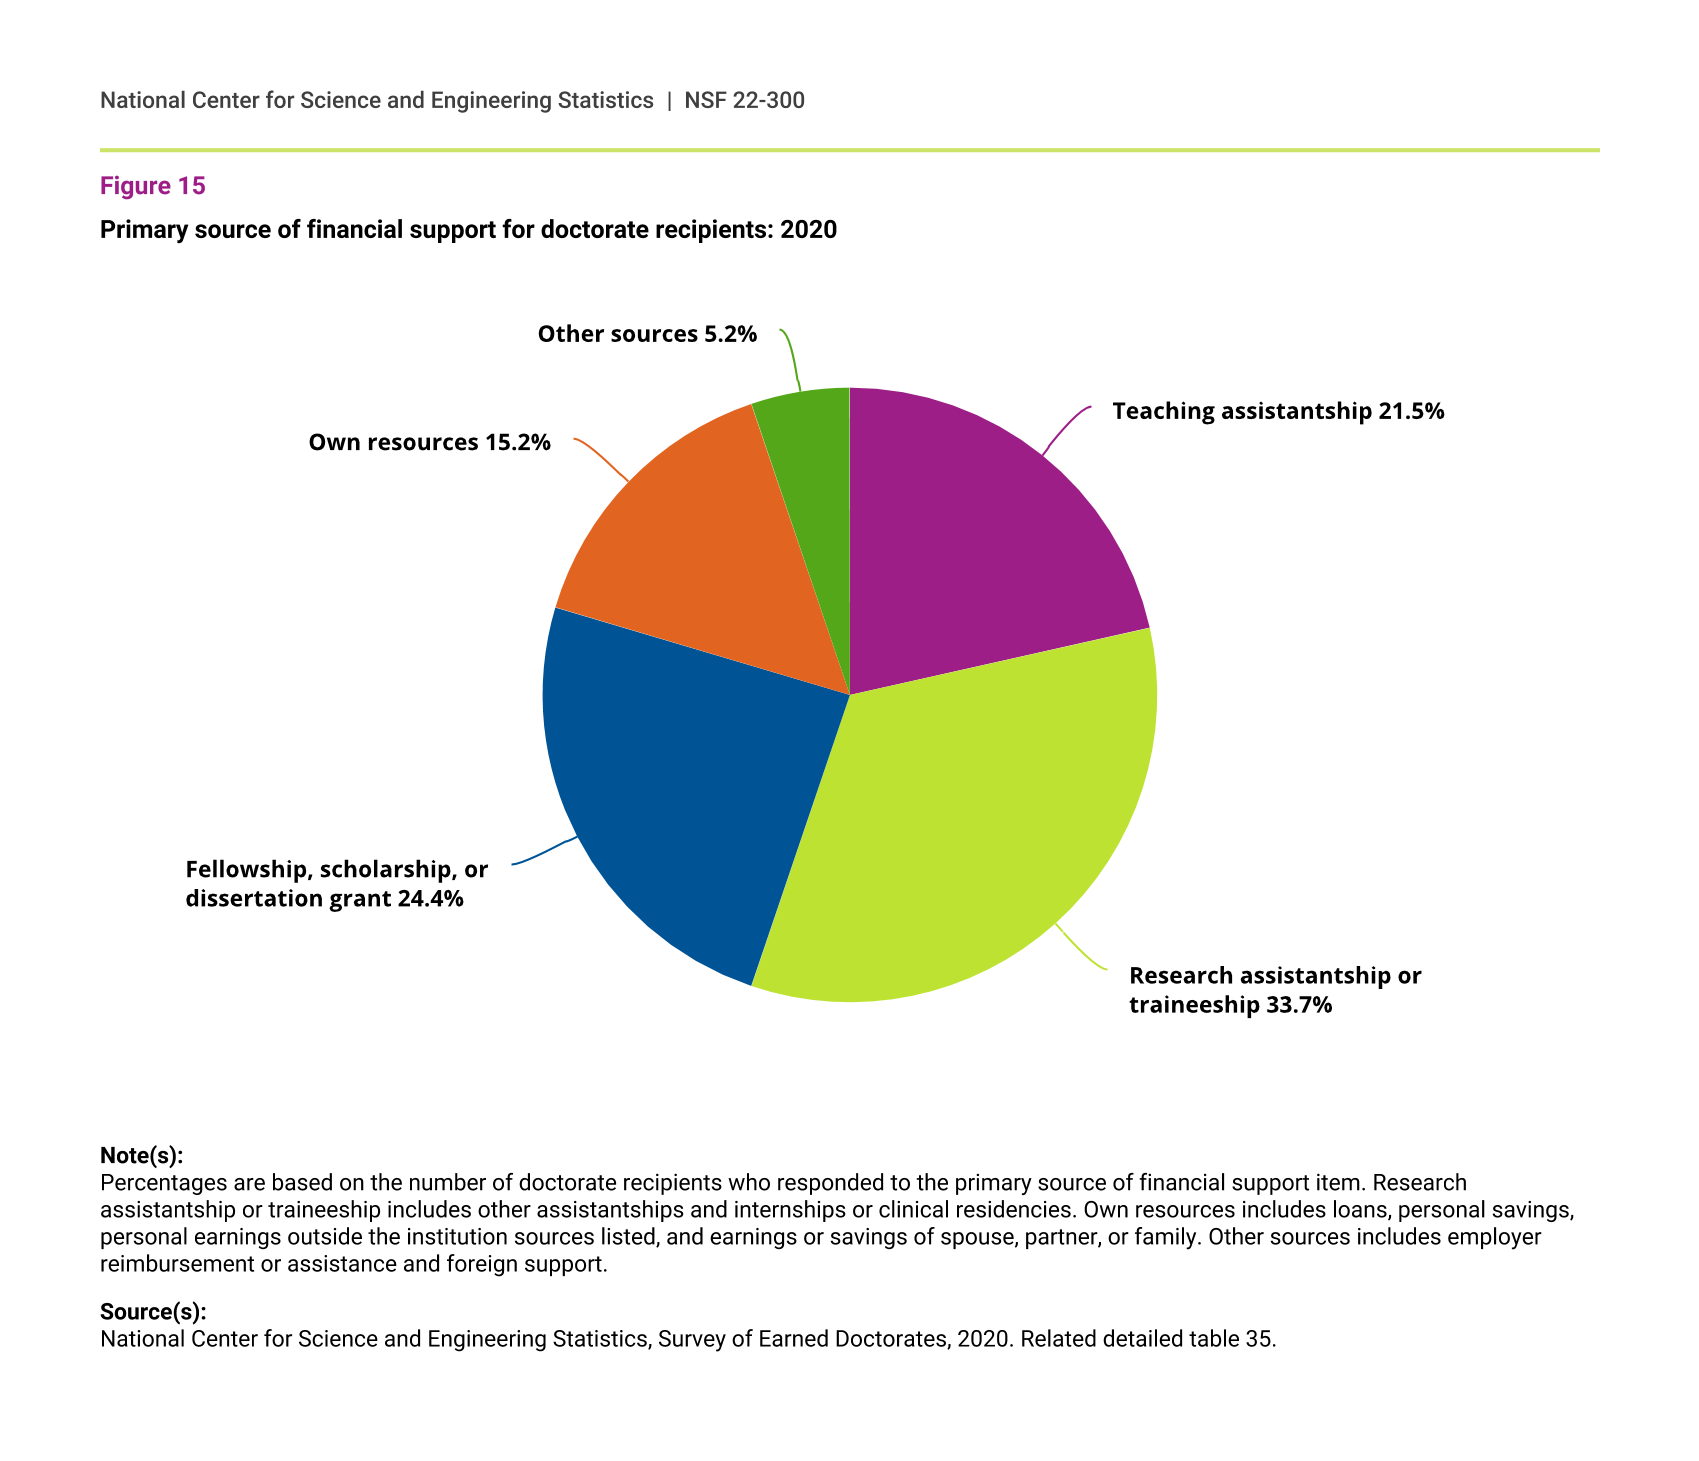
In 2020, about one-third of doctorate recipients were primarily supported by research assistantships or traineeships; 24% by fellowships, scholarships, or dissertation grants; and 22% by teaching assistantships. About 15% of doctorate recipients relied primarily on their own resources—loans, personal savings, personal earnings, and the earnings or savings of their spouse, partner, or family—to finance their graduate studies, and 5% relied on other sources, such as employer reimbursement and foreign support (figure 15).
Primary source of financial support for doctorate recipients: 2020
| Source | Percent |
|---|---|
| Teaching assistantship | 21.5 |
| Research assistantship or traineeship | 33.7 |
| Fellowship, scholarship, or dissertation grant | 24.4 |
| Own resources | 15.2 |
| Other sources | 5.2 |
Note(s):
Percentages are based on the number of doctorate recipients who responded to the primary source of financial support item. Research assistantship or traineeship includes other assistantships and internships or clinical residencies. Own resources includes loans, personal savings, personal earnings outside the institution sources listed, and earnings or savings of spouse, partner, or family. Other sources includes employer reimbursement or assistance and foreign support.
Source(s):
National Center for Science and Engineering Statistics, Survey of Earned Doctorates, 2020. Related detailed table 35.
Field of study
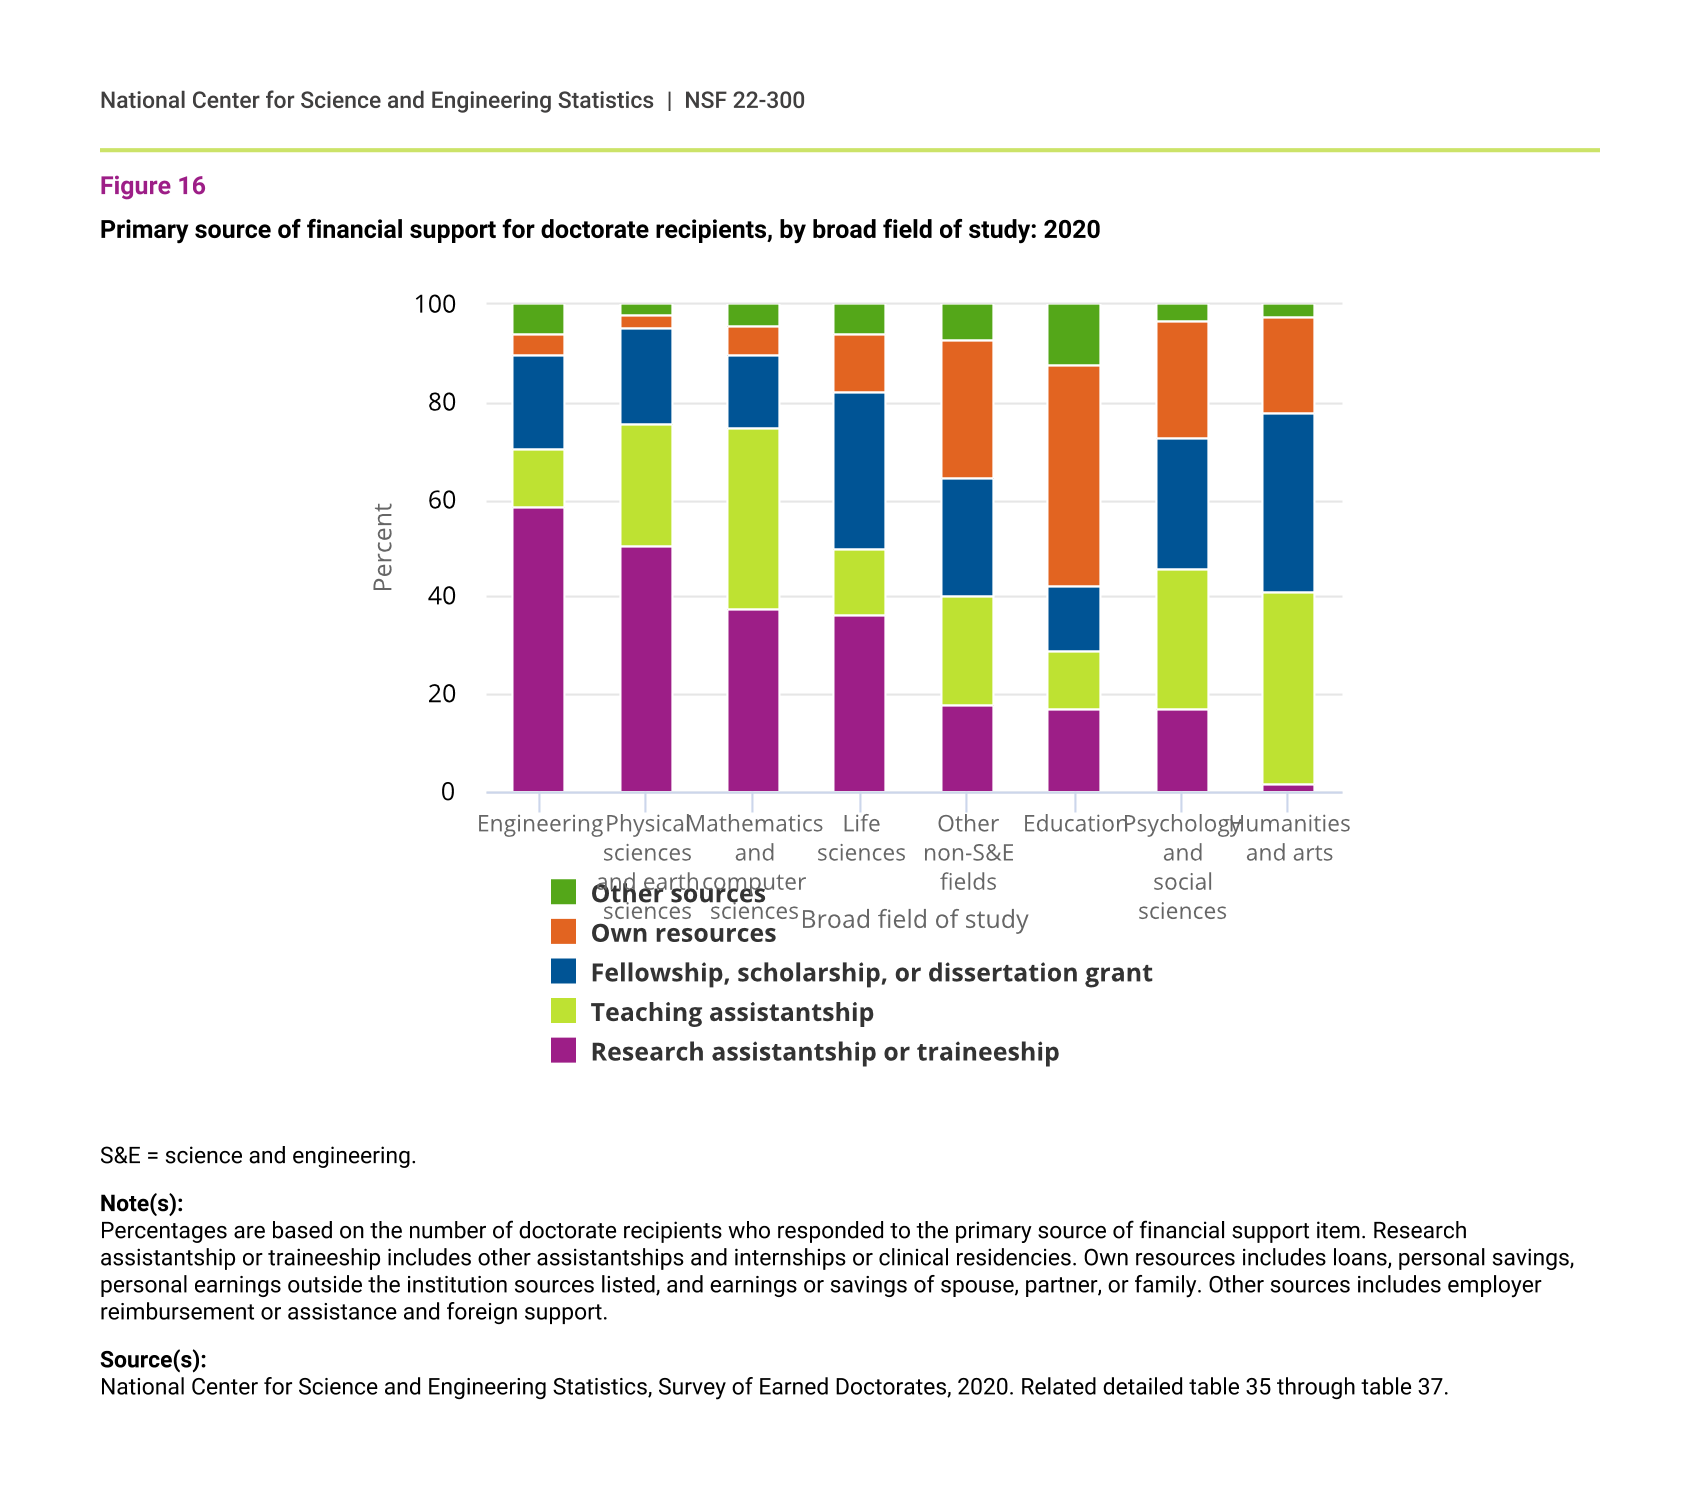
The primary sources of financial support used by doctorate recipients vary by field of study. In 2020, research assistantships were the most common primary source of financial support for doctorate recipients in engineering, in physical sciences and earth sciences, and in life sciences. In mathematics and computer sciences, teaching assistantships were just as frequent as research assistantships. Fellowships, scholarships, or dissertation grants and teaching assistantships were the most common source of primary support for comparable shares of doctoral students in humanities and arts. Nearly half of doctorate recipients in education relied on their own resources as their primary source of support. In psychology and social sciences, between 24% and 29% of doctorate recipients reported that their primary source of financial support was either fellowships, scholarships, or dissertation grants; teaching assistantships; or their own resources (figure 16).
Primary source of financial support for doctorate recipients, by broad field of study: 2020
| Broad field of study | Research assistantship or traineeship | Teaching assistantship | Fellowship, scholarship, or dissertation grant | Own resources | Other sources |
|---|---|---|---|---|---|
| Engineering | 58.7 | 11.7 | 19.2 | 4.6 | 5.8 |
| Physical sciences and earth sciences | 50.5 | 25.3 | 19.3 | 2.9 | 2.0 |
| Mathematics and computer sciences | 37.6 | 37.3 | 14.9 | 5.9 | 4.3 |
| Life sciences | 36.4 | 13.5 | 32.3 | 12.0 | 5.8 |
| Other non-S&E fields | 18.0 | 22.3 | 24.4 | 28.1 | 7.2 |
| Education | 17.0 | 12.1 | 13.3 | 45.2 | 12.4 |
| Psychology and social sciences | 16.9 | 28.8 | 27.0 | 24.0 | 3.3 |
| Humanities and arts | 1.5 | 39.7 | 36.7 | 19.5 | 2.6 |
S&E = science and engineering.
Note(s):
Percentages are based on the number of doctorate recipients who responded to the primary source of financial support item. Research assistantship or traineeship includes other assistantships and internships or clinical residencies. Own resources includes loans, personal savings, personal earnings outside the institution sources listed, and earnings or savings of spouse, partner, or family. Other sources includes employer reimbursement or assistance and foreign support.
Graduate debt
The amount of education-related debt incurred by doctorate recipients during graduate school is an indicator of the availability of financial support. In 2020, large majorities (72% and above) of doctorate recipients in physical sciences and earth sciences, in mathematics and computer sciences, engineering, and in life sciences reported holding no debt related to their graduate education when they were awarded the doctorate (figure 17). These are also fields that tend to receive the support of federal government and academic institutions in the form of research assistantships or traineeships; fellowships, scholarships, or dissertation grants; or teaching assistantships. In psychology and social sciences, humanities and arts, and other non-S&E fields, the share of doctorate recipients with no debt was about half; in education, it was lower than half.
Within each broad field of study, 5% to 8% of doctorate recipients had incurred low levels ($10,000 or less) of graduate debt. The shares of doctoral graduates with graduate debt burdens over $30,000 were greatest in education (36%), psychology and social sciences (28%), other non-S&E fields (27%), and humanities and arts (25%).
Graduate debt of doctorate recipients, by broad field of study: 2020
| Broad field of study | No debt | $10,000 or less | $10,001–$30,000 | $30,001 or greater |
|---|---|---|---|---|
| Physical sciences and earth sciences | 84.6 | 6.2 | 4.0 | 5.2 |
| Mathematics and computer sciences | 84.3 | 5.2 | 4.7 | 5.8 |
| Engineering | 81.6 | 6.6 | 5.1 | 6.7 |
| Life sciences | 72.2 | 6.9 | 6.2 | 14.8 |
| Other non-S&E fields | 58.1 | 6.9 | 8.1 | 26.9 |
| Humanities and arts | 57.5 | 8.2 | 9.8 | 24.6 |
| Psychology and social sciences | 55.8 | 7.1 | 8.8 | 28.3 |
| Education | 47.0 | 6.8 | 10.1 | 36.1 |
S&E = science and engineering.
Note(s):
Percentages are based on the number of doctorate recipients who responded to the graduate debt item (n = 50,405).
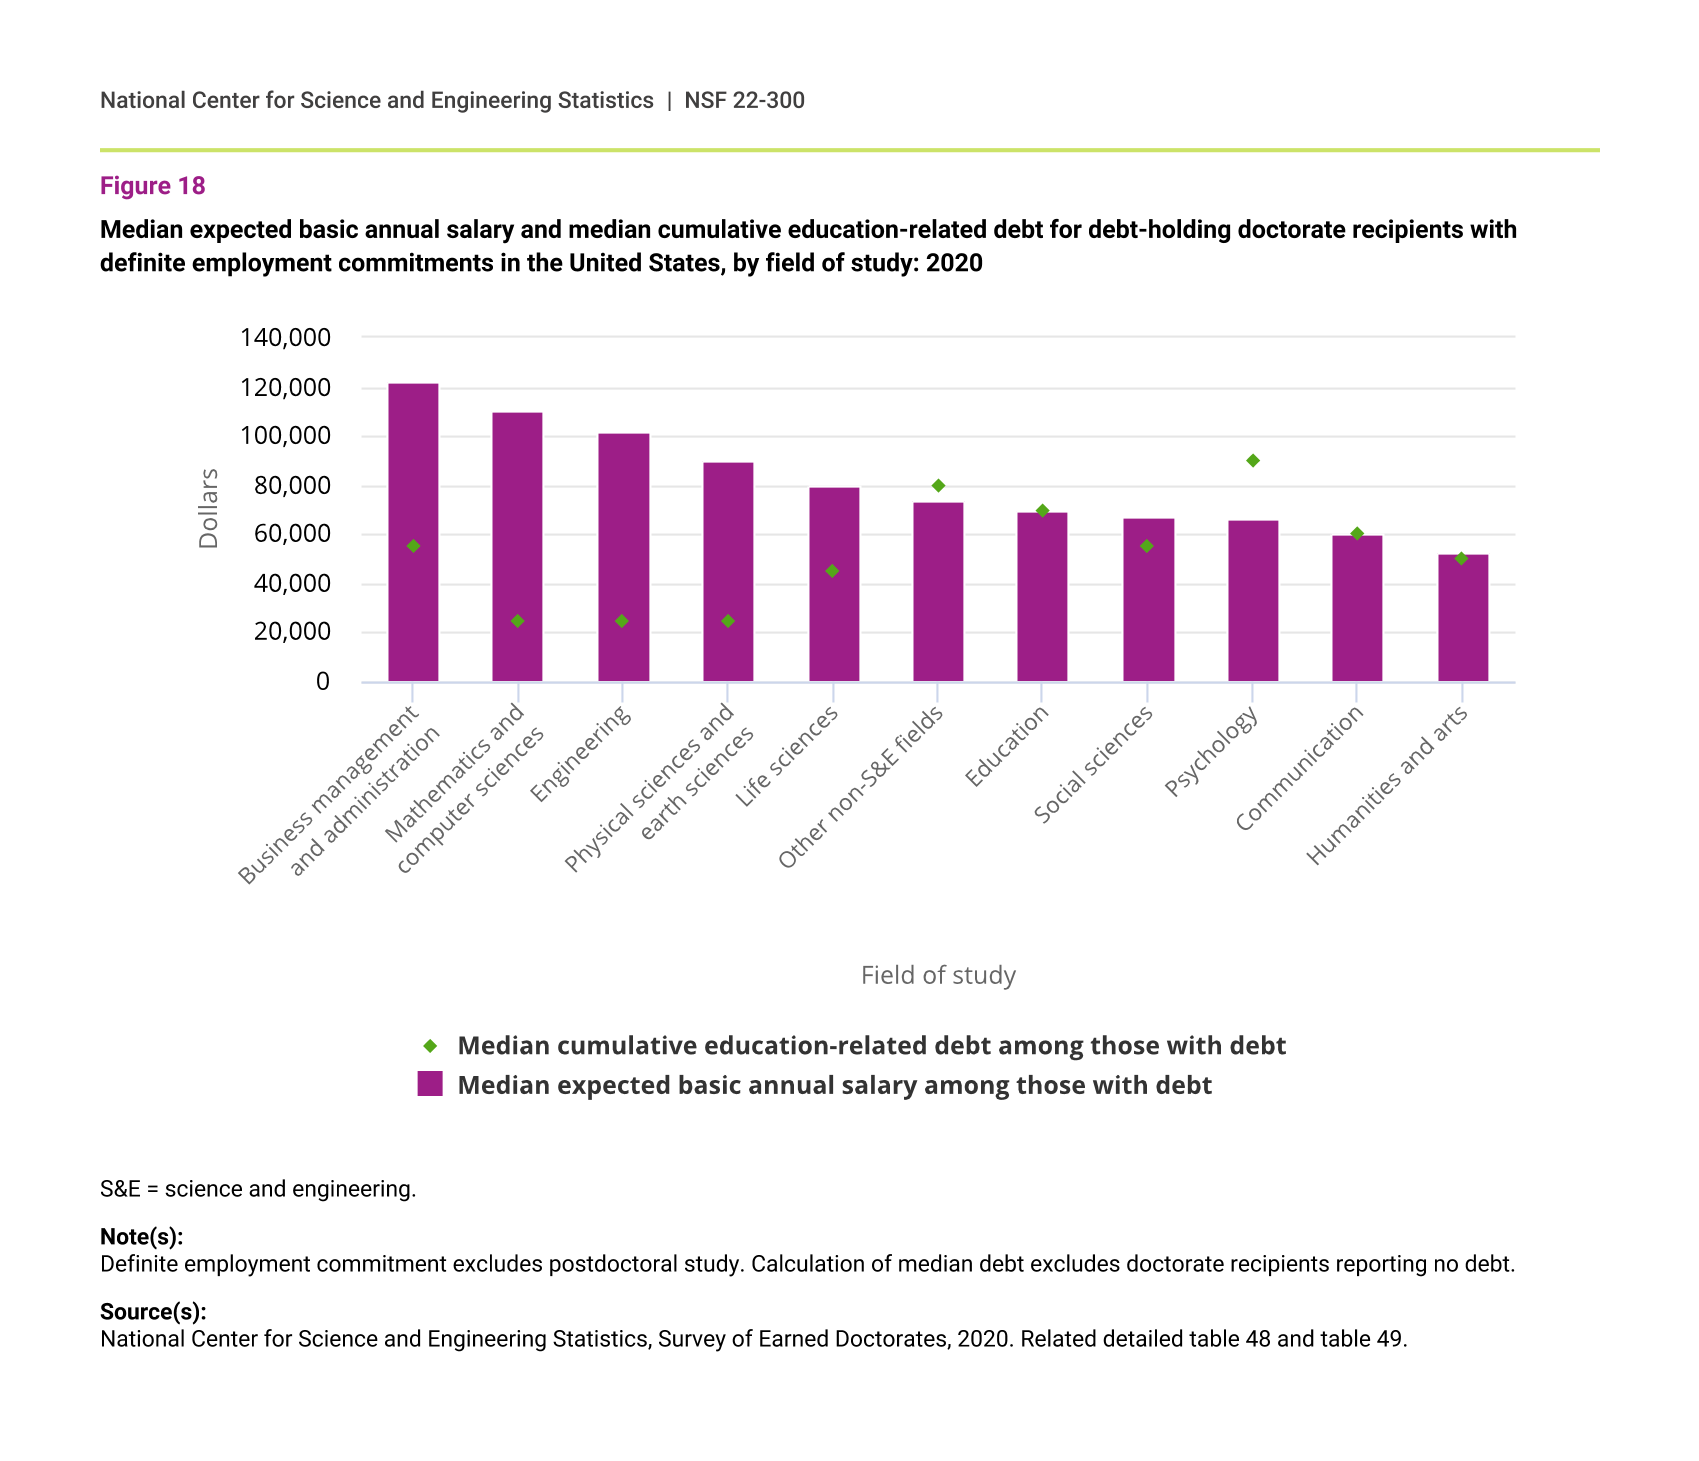
In 2020, doctorate recipients in the S&E fields with the lowest median cumulative debt—physical sciences and earth sciences, engineering, and mathematics and computer sciences—had among the highest median expected annual salaries. In these fields, median expected salaries at graduation were more than triple the median cumulative debt. Median debt among those in business management and administration was higher ($55,000), but their median expected salary was more than double their median debt (figure 18).
In contrast, doctorate recipients in the fields with the highest median cumulative debt (psychology, other non-S&E fields, and education) reported among the lowest median expected annual salaries. In psychology, the median cumulative debt was $24,000 higher than the median expected salary at graduation. And in other non-S&E fields, the median cumulative debt was $6,000 higher than expected salary. In the fields of education and communication, doctorate recipients’ median expected salary was about the same as their median cumulative debt.
Median expected basic annual salary and median cumulative education-related debt for debt-holding doctorate recipients with definite employment commitments in the United States, by field of study: 2020
| Field of study | Median cumulative education-related debt among those with debt | Median expected basic annual salary among those with debt |
|---|---|---|
| Business management and administration | 55,000 | 122,500 |
| Mathematics and computer sciences | 25,000 | 110,000 |
| Engineering | 25,000 | 102,000 |
| Physical sciences and earth sciences | 25,000 | 90,000 |
| Life sciences | 45,000 | 80,000 |
| Other non-S&E fields | 80,000 | 74,000 |
| Education | 70,000 | 70,000 |
| Social sciences | 55,000 | 67,000 |
| Psychology | 90,000 | 66,000 |
| Communication | 60,000 | 60,000 |
| Humanities and arts | 50,000 | 53,000 |
S&E = science and engineering.
Note(s):
Definite employment commitment excludes postdoctoral study. Calculation of median debt excludes doctorate recipients reporting no debt.
Time to degree
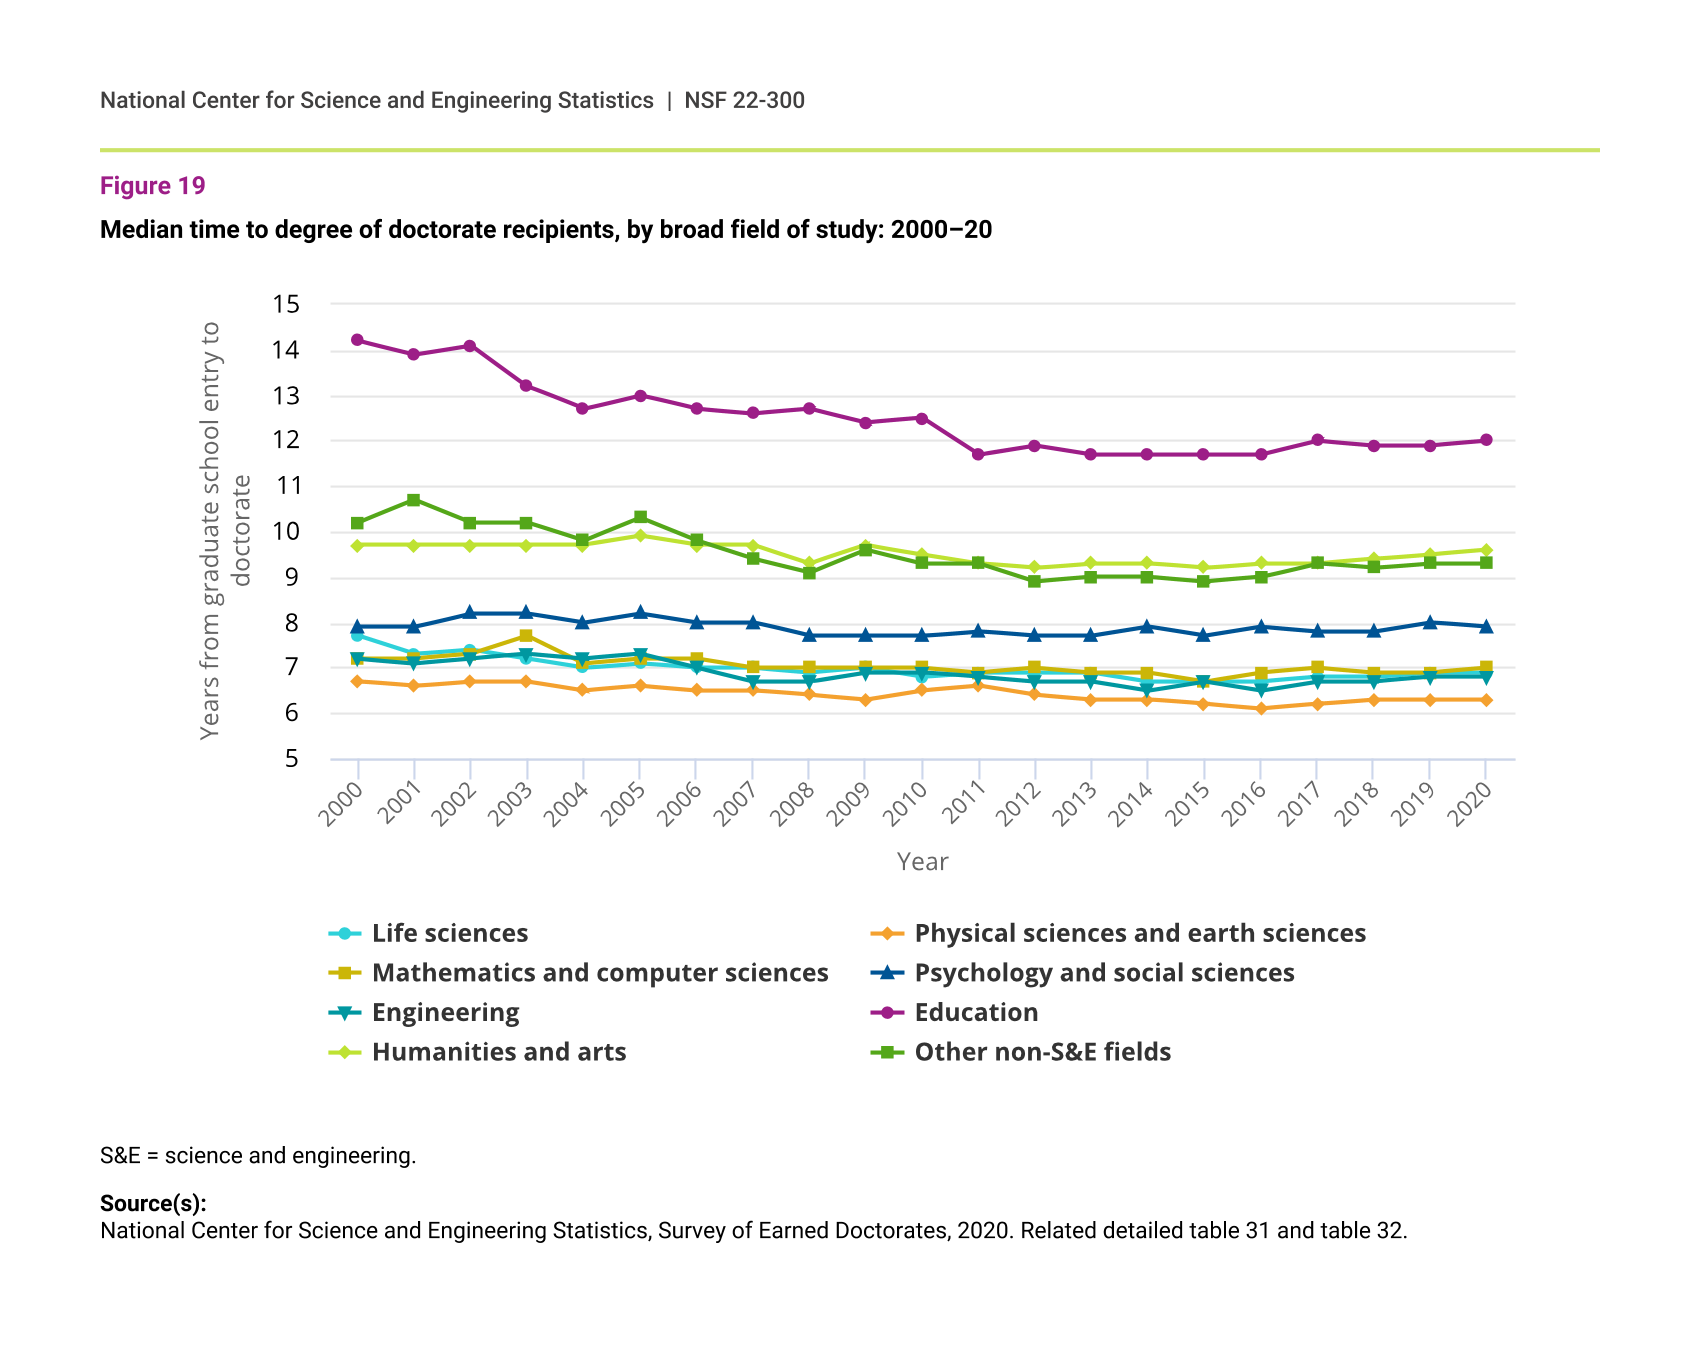
Earning a doctorate in non-S&E fields takes years longer than completing an S&E doctorate. The longest median time to degree from graduate school entry to doctoral award is in education. Over the past 20 years, median time to degree declined slightly or remained level in most S&E fields and in humanities and arts and in other non-S&E fields; it fell from 14.2 to 12.0 years in education (figure 19).
Median time to degree of doctorate recipients, by broad field of study: 2000–20
| Year | Life sciences | Physical sciences and earth sciences | Mathematics and computer sciences | Psychology and social sciences | Engineering | Education | Humanities and arts | Other non-S&E fields |
|---|---|---|---|---|---|---|---|---|
| 2000 | 7.7 | 6.7 | 7.2 | 7.9 | 7.2 | 14.2 | 9.7 | 10.2 |
| 2001 | 7.3 | 6.6 | 7.2 | 7.9 | 7.1 | 13.9 | 9.7 | 10.7 |
| 2002 | 7.4 | 6.7 | 7.3 | 8.2 | 7.2 | 14.1 | 9.7 | 10.2 |
| 2003 | 7.2 | 6.7 | 7.7 | 8.2 | 7.3 | 13.2 | 9.7 | 10.2 |
| 2004 | 7.0 | 6.5 | 7.1 | 8.0 | 7.2 | 12.7 | 9.7 | 9.8 |
| 2005 | 7.1 | 6.6 | 7.2 | 8.2 | 7.3 | 13.0 | 9.9 | 10.3 |
| 2006 | 7.0 | 6.5 | 7.2 | 8.0 | 7.0 | 12.7 | 9.7 | 9.8 |
| 2007 | 7.0 | 6.5 | 7.0 | 8.0 | 6.7 | 12.6 | 9.7 | 9.4 |
| 2008 | 6.9 | 6.4 | 7.0 | 7.7 | 6.7 | 12.7 | 9.3 | 9.1 |
| 2009 | 7.0 | 6.3 | 7.0 | 7.7 | 6.9 | 12.4 | 9.7 | 9.6 |
| 2010 | 6.8 | 6.5 | 7.0 | 7.7 | 6.9 | 12.5 | 9.5 | 9.3 |
| 2011 | 6.9 | 6.6 | 6.9 | 7.8 | 6.8 | 11.7 | 9.3 | 9.3 |
| 2012 | 6.9 | 6.4 | 7.0 | 7.7 | 6.7 | 11.9 | 9.2 | 8.9 |
| 2013 | 6.9 | 6.3 | 6.9 | 7.7 | 6.7 | 11.7 | 9.3 | 9.0 |
| 2014 | 6.7 | 6.3 | 6.9 | 7.9 | 6.5 | 11.7 | 9.3 | 9.0 |
| 2015 | 6.7 | 6.2 | 6.7 | 7.7 | 6.7 | 11.7 | 9.2 | 8.9 |
| 2016 | 6.7 | 6.1 | 6.9 | 7.9 | 6.5 | 11.7 | 9.3 | 9.0 |
| 2017 | 6.8 | 6.2 | 7.0 | 7.8 | 6.7 | 12.0 | 9.3 | 9.3 |
| 2018 | 6.8 | 6.3 | 6.9 | 7.8 | 6.7 | 11.9 | 9.4 | 9.2 |
| 2019 | 6.9 | 6.3 | 6.9 | 8.0 | 6.8 | 11.9 | 9.5 | 9.3 |
| 2020 | 6.9 | 6.3 | 7.0 | 7.9 | 6.8 | 12.0 | 9.6 | 9.3 |
S&E = science and engineering.