 An official website of the United States government
Assessing the Impact of COVID-19 on Science, Engineering, and Health Graduate Enrollment: U.S. Part-Time Enrollment Increases as Full-Time Temporary Visa Holder Enrollment Declines
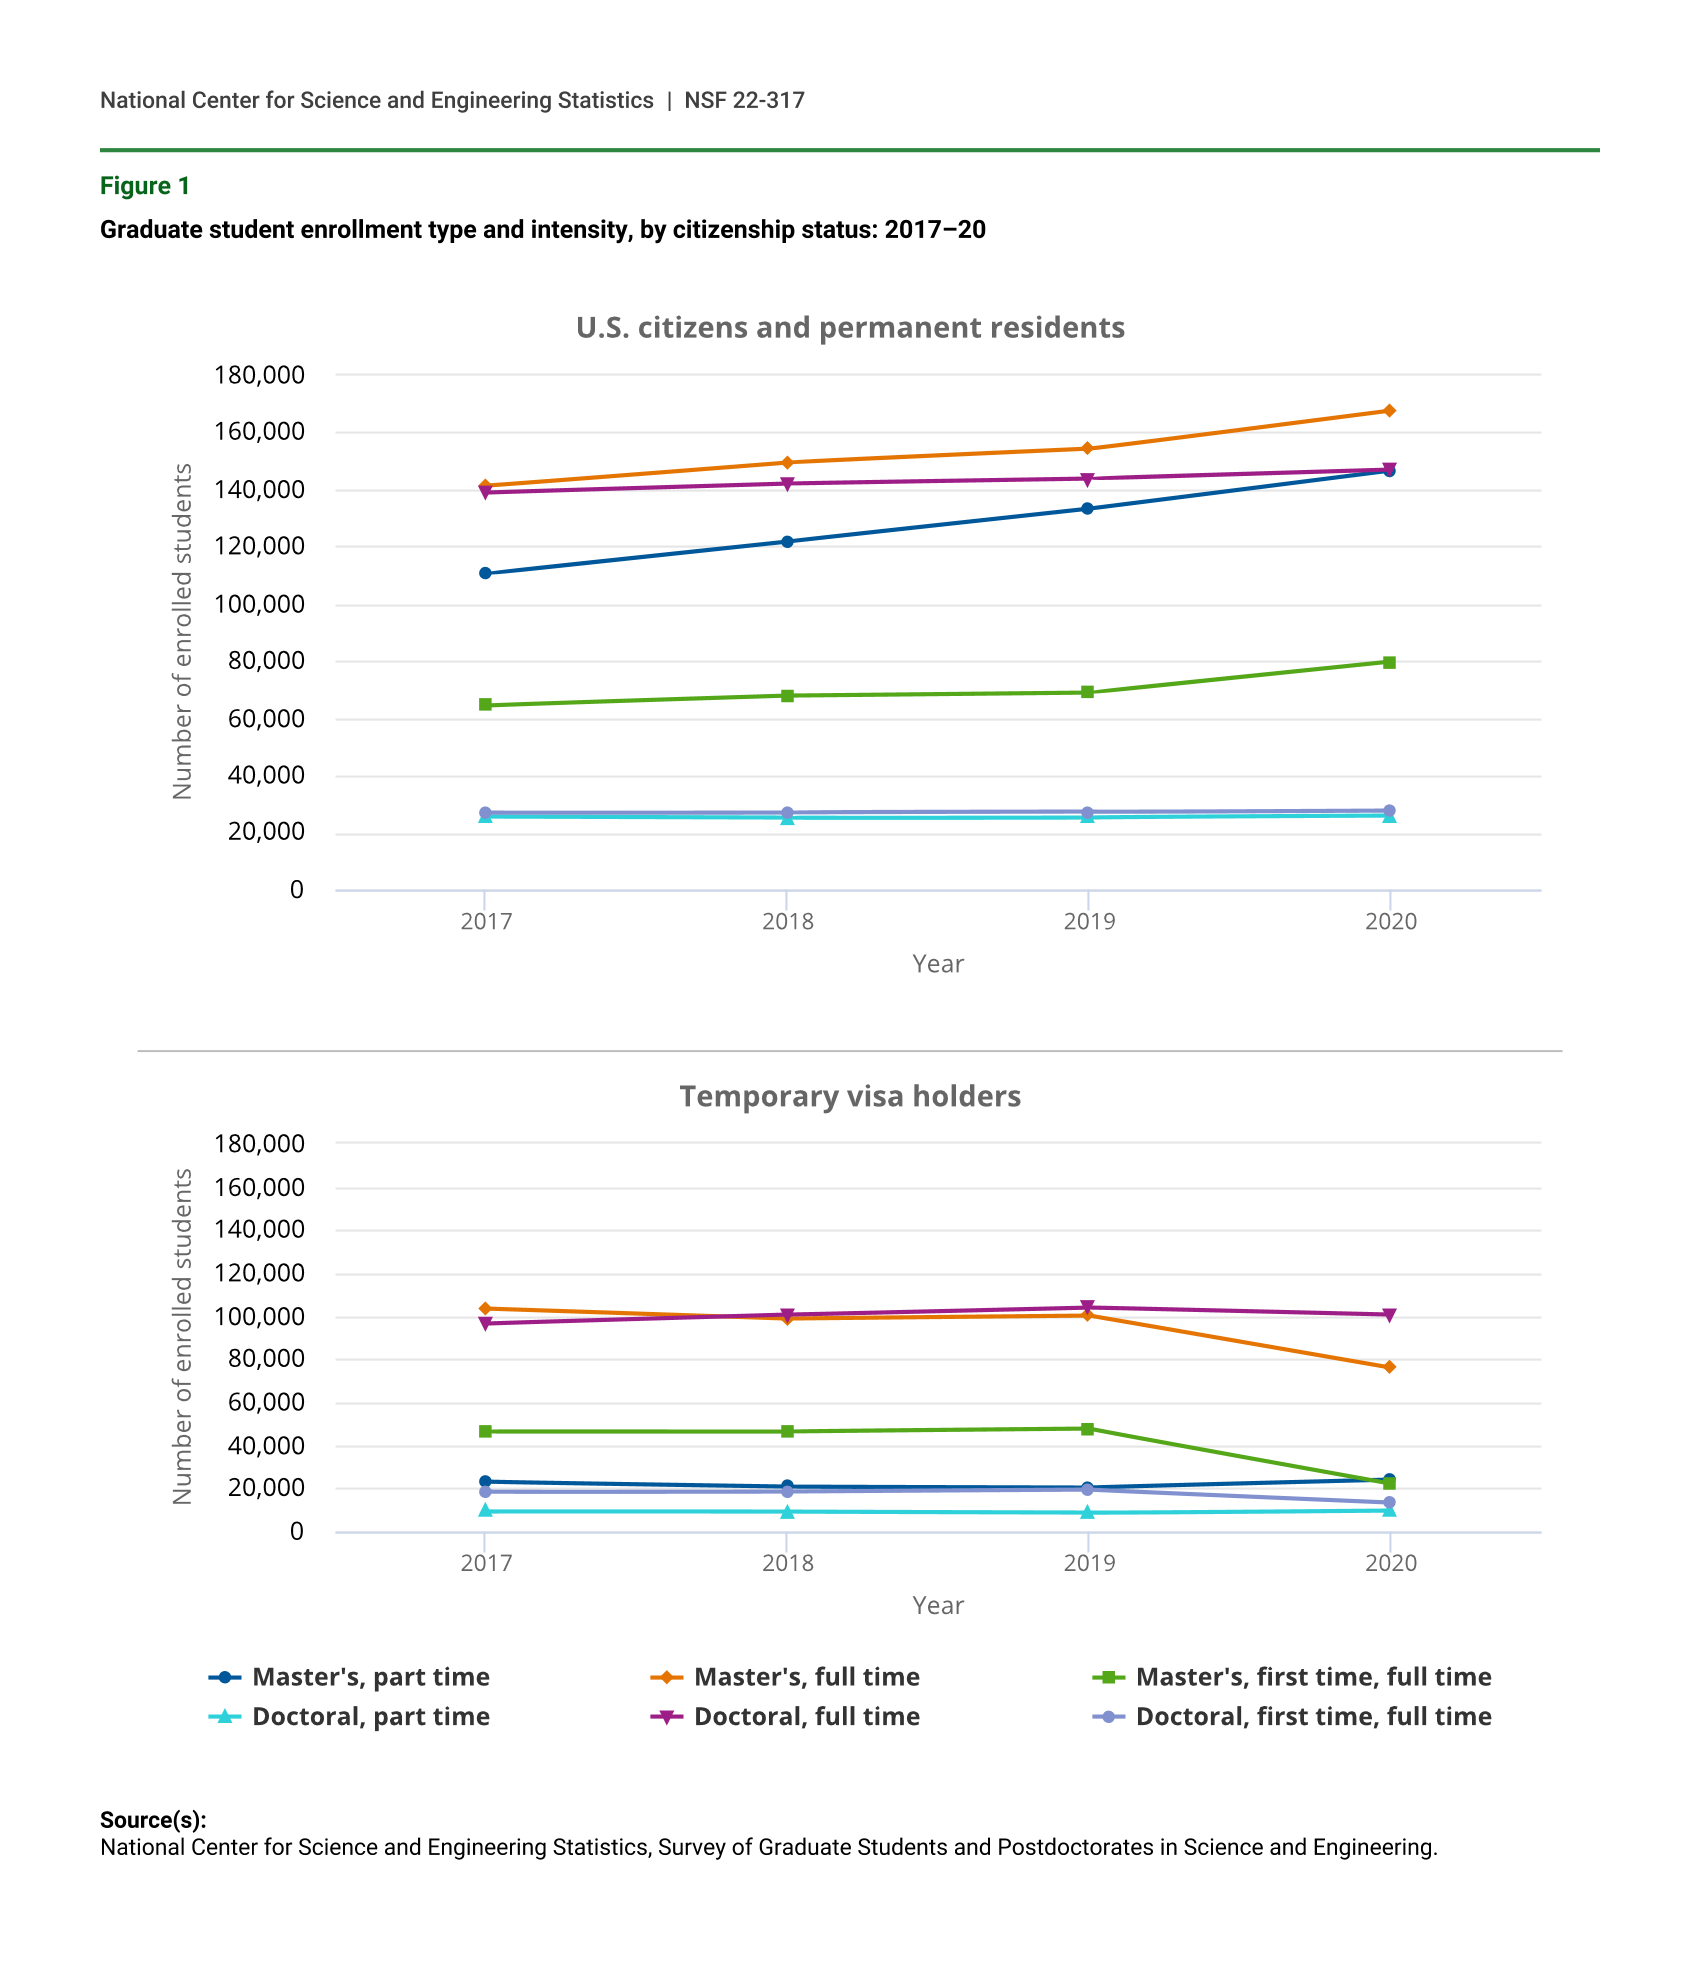
The COVID-19 pandemic triggered considerable shifts in enrollment patterns for both U.S. citizens and permanent residents and temporary visa–holding graduate students within science, engineering, and health (SEH) fields during the fall 2020. After 3 years of relative stability, full-time enrollment of temporary visa holders in SEH master’s programs declined. First-time, full-time temporary visa holder enrollment was much lower in 2020 than 2019, with just over 25,000 fewer master’s students and almost 6,000 fewer doctoral students starting in 2020 than in 2019. At the same time, enrollment of U.S. citizens and permanent residents continued to increase. Specifically, the number of U.S. citizens and permanent residents enrolled in full-time master’s programs increased by about 13,600, and part-time master’s enrollment increased a similar amount, about 13,400, between 2019 and 2020 (figure 1).
Despite enrollment declines for temporary visa holders in 2020, the total number of graduate students was relatively stable with a small increase of 7,696 students (1.1%) between 2019 and 2020 due to increasing enrollment of U.S. citizen and permanent residents in SEH graduate programs. In 2020, a record 697,813 graduate students were reported to the Survey of Graduate Students and Postdoctorates in Science and Engineering (GSS) in eligible SEH fields. There were 414,478 master’s students, 283,335 doctoral students, 65,681 postdoctoral appointees (postdocs), and 29,661 doctorate-holding nonfaculty researchers (NFRs) in SEH fields at U.S. academic institutions (see table 1 and table 2). These and other findings in this report are from the 2020 GSS, with comparisons to data from 2017 to 2019. Data from the GSS provide insight into the composition of the current and future science and engineering workforce by collecting data on graduate students, postdocs, and NFRs in SEH fields. The GSS is sponsored by the National Center for Science and Engineering Statistics (NCSES) within the National Science Foundation (NSF) and by the National Institutes of Health (NIH).
Graduate student enrollment type and intensity, by citizenship status: 2017–20
| Year | Master's, part time | Master's, full time | Master's, first time, full time | Doctoral, part time | Doctoral, full time | Doctoral, first time, full time |
|---|---|---|---|---|---|---|
| 2017 | 110,575 | 141,321 | 64,513 | 25,508 | 139,077 | 26,902 |
| 2018 | 121,757 | 149,533 | 67,821 | 25,133 | 142,158 | 27,009 |
| 2019 | 133,180 | 154,190 | 68,897 | 25,327 | 143,807 | 27,177 |
| 2020 | 146,539 | 167,766 | 79,715 | 25,818 | 146,928 | 27,744 |
| Year | Master's, part time | Master's, full time | Master's, first time, full time | Doctoral, part time | Doctoral, full time | Doctoral, first time, full time |
|---|---|---|---|---|---|---|
| 2017 | 23,002 | 103,689 | 46,467 | 9,239 | 96,701 | 18,275 |
| 2018 | 20,902 | 99,019 | 46,393 | 9,066 | 100,739 | 18,501 |
| 2019 | 20,516 | 100,342 | 47,610 | 8,652 | 104,103 | 19,348 |
| 2020 | 24,080 | 76,093 | 22,381 | 9,861 | 100,728 | 13,429 |
Source(s):
National Center for Science and Engineering Statistics, Survey of Graduate Students and Postdoctorates in Science and Engineering.
Enrollment of master's students and doctoral students in science, engineering, and health, by field: 2017–20
Note(s):
For more information about the Survey of Graduate Students and Postdoctorates in Science and Engineering fields, see technical table A-17 in the 2020 data tables (https://ncses.nsf.gov/pubs/nsf21319).
Source(s):
National Center for Science and Engineering Statistics, Survey of Graduate Students and Postdoctorates in Science and Engineering.
Postdoctoral appointee and nonfaculty researcher employment, by field: 2017–20
Note(s):
For more information about the Survey of Graduate Students and Postdoctorates in Science and Engineering fields, see technical table A-17 in the 2020 data tables (https://ncses.nsf.gov/pubs/nsf21319).
Source(s):
National Center for Science and Engineering Statistics, Survey of Graduate Students and Postdoctorates in Science and Engineering.
Trends in Enrollment, by Citizenship Status
From 2019 to 2020, master’s enrollment increased while doctoral enrollment remained relatively stable, although trends differed by residency status. These trend changes are consistent with the responses of GSS coordinators to the 2020 COVID Impact Module. The 2020 COVID Impact Module was fielded alongside the GSS data collection and collected information regarding enrollment and policy changes resulting from the pandemic (Arbeit and Yamaner 2022). While U.S. citizen and permanent resident enrollment increased for full-time and part-time master’s and doctoral students, there were declines in full-time temporary visa holders’ enrollments at both degree levels. The pandemic-induced declines for first-time enrollment will likely have an impact on long-term trends, especially at the doctoral level.
Temporary Visa Holders
First-time, full-time graduate enrollment of temporary visa holders in SEH fields declined markedly in 2020, particularly for new master’s enrollment. At the master’s level, the first-time, full-time enrollment of temporary visa holders declined by 53.0% (-25,229 students) from 2019 to 2020, contributing to a 24.2% (-24,249 students) decline in full-time enrollment of all master’s-level temporary visa holders. Similarly, first-time, full-time doctorate-seeking temporary visa holders declined by 30.6% (-5,919 students), while full-time doctorate-seeking enrollment of temporary visa holders declined by 3.2% (-3,375 students). These declines are notable for the GSS and consistent with data from the Student and Exchange Visitor Program (SEVP), Institute of International Education (IIE), and Council of Graduate Students (CGS), which all reported declines in temporary visa–holding students. These data suggest that continuing students on temporary visas were not as impacted by pandemic-related restrictions as were prospective first-time students (table 3).
While full-time master’s and doctoral enrollment of temporary visa holders declined, part-time enrollment for these master’s and doctoral students increased by 17.4% (3,564 students) and 14.0% (1,209 students), respectively, from 2019 to 2020. Part-time enrollment of female temporary visa–holding graduate students grew by 20.7% (2,187 students) from 2019 to 2020. Overall, part-time enrollment has been increasing faster proportionally for women than men on temporary visas between 2017 and 2020 (table 3).
Enrollment of master's students and doctoral students in science, engineering, and health, by enrollment intensity, sex, citizenship, race, and ethnicity: 2017–20
a Race and ethnicity data are available for U.S. citizens and permanent residents only.
Source(s):
National Center for Science and Engineering Statistics, Survey of Graduate Students and Postdoctorates in Science and Engineering.
U.S. Citizens and Permanent Residents
Enrollment of U.S. citizen and permanent residents has grown for graduate students across all enrollment categories—part-time; full-time; and first-time, full-time. However, the growth was not even across demographic groups and degree type.
From 2017 to 2020, female U.S. citizen and permanent resident enrollment grew relatively faster than male enrollment. Full-time female master’s enrollment has increased by 24.5% (19,845 students) since 2017. This is primarily due to growth within master’s first-time, full-time enrollment, which has increased by 27.9% (10,329 students) over the same period. Part-time master’s enrollment for female U.S. citizen and permanent resident graduate students has increased by 40.6% (20,630 students) since 2017. Master’s full-time enrollment for male students increased by 11.0% (6,600 students) between 2017 and 2020 (table 3).
Hispanic or Latino and Black or African American enrollments have continued to see large increases across degree type and enrollment intensity. Hispanic or Latino graduate students represent the group with the proportionally highest growth over the last 4 years. Between 2017 and 2020, Hispanic or Latino master’s part-time enrollment has grown by 56.9% (7,008 students); full-time enrollment has increased by 41.1% (7,120 students); and first-time, full-time enrollment has grown by 49.2% (3,789 students). Over the same 4-year period, Black or African American students represent the group with the second highest proportional growth in enrollment. Black or African American master’s part-time enrollment increased by 30.1% (3,433 students); full-time enrollment increased by 35.0% (4,143 students); and first-time, full-time enrollment increased by 41.2% (2,235 students) (table 3).
Field of Study Trends for Master’s and Doctoral Students
Turning to fields of study, differences in master’s and doctoral enrollment were uneven across academic disciplines, but changes between 2019 and 2020 were relatively consistent with longer-term trends. With few exceptions, fields that were growing continued to expand, while those that were declining continued to contract.
In 2020, the GSS revised its taxonomy to align with an updated NCSES Taxonomy of Disciplines (TOD) and National Center for Education Statistics (NCES) Classification of Instructional Programs (CIP). Some of these changes resulted in counts moving between broad fields—in these cases, the changes in broad field counts reflect the updated classification and not changes in enrollment or employment. For more information on the taxonomy change, see “Data Sources and Limitations” at the end of this InfoBrief.
Master’s Enrollment Trends, by Field
Overall, master’s enrollment is increasing. In 2020, there were 414,478 master’s students enrolled in SEH fields—an increase of 9.5% since 2017, including a 1.5% increase between 2019 and 2020. While the total number of graduate students increased modestly between 2019 and 2020, the impacts have been unevenly distributed across academic fields. Master’s enrollment in health fields increased at the fastest rate between 2019 and 2020 (6.4%); science enrollment grew the fastest between 2017 and 2020 (16.9%); and engineering enrollment declined 10.7% from 2017 to 2020, including declines from 2019 to 2020 (table 1).
The top three fields in terms of percentage growth in master’s enrollment between 2019 and 2020 were multidisciplinary and interdisciplinary studies (2,777 students, or 33.9%); aerospace, aeronautical, and astronautical engineering (625 students, or 16.9%); and psychology (6,441 students, or 15.8%). While multidisciplinary and interdisciplinary studies may have grown due to new CIP codes, this is not the case for the other two fields. Computer and information sciences remains the largest field for master’s enrollment, with 80,690 students enrolled in 2020—an increase of 6.7% (5,072 students) between 2017 and 2020 but a decline of 4.0% (-3,402 students) between 2019 and 2020. Even with this decline, there were more master’s students enrolled in computer science programs in 2020 than in 2018 (table 1).
Master’s enrollment in engineering fields has declined annually since 2017, down 10.7% (-10,306 students) between 2017 and 2020 and down 6.0% (-5,489 students) between 2019 and 2020. Aerospace, aeronautical, and astronautical engineering and biological, biomedical, and biosystems engineering are the only two engineering broad fields where master’s enrollment grew more than 1.0% since 2017. Master’s enrollment declined in two-thirds of the engineering fields between 2019 and 2020 (table 1).
Electrical, electronics, communications, and computer engineering master’s enrollment declined by the largest number of students from 2019 to 2020, 2,865 (-10.2%). The much smaller field of chemical, petroleum, and chemical-related engineering also declined by 10.1% (-332 students) between 2019 and 2020 and by 30.1% (-1,266 students) since 2017; this was the largest field decline in terms of percentage in the GSS over that time (table 1).
Doctoral Enrollment Trends, by Field
While master’s enrollment grew almost 10% between 2017 and 2020, doctoral enrollment in SEH fields grew at a slower pace of 4.7%. Specifically, doctoral enrollment in SEH fields (283,335 students) increased by 12,810 students since 2017 but remained relatively stable between 2019 and 2020 (0.5%, or 1,446 students). From 2019 to 2020, science increased slightly by 1.5% (2,846 students), and engineering remained relatively stable, declining just 1.1% (-786 students). Trends in doctoral enrollment varied by SEH fields, despite overall stability in total doctoral enrollment (table 1).
The top three fields of growth between 2019 and 2020 were multidisciplinary and interdisciplinary studies at 19.3% (575 students), agricultural and veterinary sciences at 10.9% (424 students), and computer and information sciences at 5.7% (982 students). As with master’s students, the increase in multidisciplinary and interdisciplinary studies may be partially due to taxonomy changes. Biological and biomedical sciences remains the largest field of study (54,905 students), enrolling 19.4% of all doctoral students in the 2020 GSS (table 1).
Trends in Postdoc and NFR Employment
The overall number of postdocs in the GSS was relatively stable, with a small decline of 0.9% (-566 postdocs) between 2019 and 2020; the demographic and disciplinary composition of postdocs shifted over the period from 2017 to 2020. This trend is consistent with the findings from the 2020 COVID Impact Module, which showed the schools increasing the number of U.S. citizen and permanent resident postdocs as potentially offsetting the decline in temporary visa–holding postdocs. At the same time, NFRs declined by 2.3% (-688 NFRs), the first annual decline since 2017. Both postdocs and NFRs experienced uneven growth across academic disciplines, and there continued to be stark differences across visa status, sex, and race or ethnicity for postdocs (see table 2 and table 4).
Postdoctoral appointee employment, by sex, citizenship, race, and ethnicity: 2017–20
a Race and ethnicity data are available for U.S. citizens and permanent residents only.
Source(s):
National Center for Science and Engineering Statistics, Survey of Graduate Students and Postdoctorates in Science and Engineering.
Demographics of Postdocs
As noted above, the overall number of postdocs within SEH fields remained stable, with different patterns by visa status. In 2020, the number of temporary visa–holding postdocs declined by 2.7% (-1,004 postdocs) from 2019 but still remained 3.4% (1,168 postdocs) higher than in 2017.
U.S. citizen and permanent resident postdocs increased by 1.5% (438 postdocs) between 2019 and 2020, reversing a slow decline between 2017 and 2019. Notably, between 2019 and 2020, there were increases in the number of female postdocs (3.1%, or 429 postdocs) and Hispanic or Latino postdocs (5.4%, or 103 postdocs). These indicate small shifts in both the sex and race or ethnicity distributions of U.S. citizen and permanent resident postdocs (table 4).
Field of Research
Over the 4 years between 2017 and 2020, postdoc employment in engineering saw a greater increase (7.9%, or 623 postdocs) than science (1.3%, or 500 postdocs) or health, which remained stable despite a small decline (-0.9%, or -175 postdocs). Biological and biomedical sciences remained the largest field for postdoc employment, with 21,902 postdocs reported. This figure has remained relatively stable year to year, increasing by just 0.6% between 2017 and 2020. While graduate enrollment in multidisciplinary and interdisciplinary studies has been growing, the numbers of postdocs and NFRs in this field declined by 26.4% (-299 postdocs) and 15.8% (-127 NFRs) between 2017 and 2020 (table 2).
The total number of NFRs declined 2.3% (-688 NFRs) between 2019 and 2020, but this change varied across SEH fields. Between 2017 and 2020, the number of NFRs in engineering increased by 19.8% (647 NFRs). Most engineering fields employed more NFRs in 2020 than in 2017, except for chemical, petroleum, and chemical-related engineering. In science, there were fewer NFRs employed in 2020 than in 2019 in eight of the ten broad fields (table 2).
Data Sources and Limitations
Conducted since 1966, the GSS is an annual survey of all academic institutions in the United States that grant research-based master’s or doctoral degrees in SEH fields. The 2020 GSS collected data from 21,156 organizational units (departments, programs, affiliated research centers, and health care facilities) at 712 eligible institutions and their affiliates in the United States, Puerto Rico, and Guam. The unit response rate was 96.8%. An overview of the survey is available at https://www.nsf.gov/statistics/srvygradpostdoc/.
In 2020, the GSS amended its taxonomy to align with a revised NCSES TOD and 2020 NCES CIP. Unlike the taxonomy changes in 2017, the only newly ineligible CIP codes were those dropped by the 2020 CIP. As such, these changes did not lead to a large shift in overall reported GSS counts, and data remain comparable to data from 2017 to 2019. Additionally, new CIP codes, such as data science and medical clinical sciences, were added, along with other codes in GSS-eligible series; while these CIP codes are newly eligible, a review of unit names from prior years indicates that many of them were being reported prior to 2020. Some additional adjustments to allow for additional detail in some fields were made to the GSS taxonomy based on the 2020 CIP codes reported to GSS. Finally, similar to science and health, broad fields were added to engineering. These adjustments can be seen in the tables associated with this InfoBrief as well as in the data tables for the 2020 GSS.
At the field level, there were some notable changes that may impact trends. First, consistent with the 2020 CIP and TOD, veterinary biomedical and clinical sciences moved from the health sciences to agricultural sciences (which was then renamed agricultural and veterinary sciences). Human development is now reported under psychology, rather than social sciences, to align with 2020 TOD. Finally, 22 new 2020 CIP codes were added to multidisciplinary and interdisciplinary studies; the addition of these CIP codes likely moved units that were already reported (i.e., many units named data science are now reported with new CIP codes that map to the new data science and data analytics GSS code). For more information about the 2020 GSS taxonomy change, see technical tables A-17, A-18a, and A-18b in the 2020 data tables (https://ncses.nsf.gov/pubs/nsf22319/).
In 2017, the GSS was redesigned to collect demographic and financial support data separately for master’s and doctoral students so as to prioritize electronic data interchange (EDI) as the primary means of data submission and to utilize the U.S. Department of Education’s CIP codes to report fields of study for graduate student enrollment data. More information regarding the 2017 GSS redesign is available in the “Technical Notes” for the 2019 data tables (https://ncses.nsf.gov/pubs/nsf21318#technical-notes). Due to these changes, the 2017 and beyond data are not directly comparable to previously collected GSS data. Trend comparisons can be made using the “2017old” estimates in the 2017 data tables, available at https://ncsesdata.nsf.gov/gradpostdoc/2017/.
GSS health fields are collected under the advisement of NIH. These GSS fields are about a third of all health fields in the U.S. Department of Education’s CIP taxonomy. NIH information on trends seen within these selected health fields can be found at https://report.nih.gov/nihdatabook/.
The full set of data tables from the 2020 survey is available at https://www.nsf.gov/statistics/srvygradpostdoc/. Data are also available in NCSES’s interactive data tool (https://ncsesdata.nsf.gov/ids/gss). For more information about the survey, contact the GSS project officer, Michael Yamaner.
A related InfoBrief based on the 2020 Covid Impact Module that was conducted as part of the 2020 GSS is available at https://ncses.nsf.gov/pubs/nsf22313/.
Notes
1While data from 2016 and earlier are not strictly comparable to data from 2017 and later, this is due to several fields becoming ineligible in 2017. The numbers of graduate students in 2019 and 2020 are greater than 2016, the previous year in which the largest number of graduate students reported (when more fields were GSS eligible).
2For more information on historical GSS trends, please see data table 1-1 (https://ncses.nsf.gov/pubs/nsf22319/).
3For more information regarding GSS coordinators’ responses to the COVID-19 Impact Module, please see https://ncses.nsf.gov/pubs/nsf21313/.
4SEVP reported a 16% reduction of F-1 visa students pursing a bachelor’s or master’s degree and a 4.7% reduction for those pursuing a doctoral degree. Students with an F-1 visa are permitted to attend academic programs with a “core academic curriculum” for the duration of their studies; this visa is required for international students to engage in graduate education in the United States (https://www.ice.gov/doclib/sevis/pdf/sevisBTN2020.pdf). A November 2020 report by IIE and CGS reported that new international enrollment declined by 43% from 2019 to 2020 (https://www.iie.org/-/media/Files/Corporate/Open-Doors/Special-Reports/Fall-2020-Snapshot-Report---Full-Report.ashx).
5EDI is a method for transferring data between computer systems or networks using a standardized format. CIP is a taxonomy used for reporting postsecondary fields to the U.S. Department of Education for the Integrated Postsecondary Education Data System, a mandatory survey for institutions receiving federal financial aid. Most institutions in the GSS already use CIP codes to report data on graduate students. The CIP taxonomy was developed by NCES, which updates the taxonomy about once a decade; CIP was last revised in 2010. For more information, see http://nces.ed.gov/ipeds/cipcode/.
Suggested Citation
Davies C, Arbeit CA, Yamaner MI; National Center for Science and Engineering Statistics (NCSES). 2022. Assessing the Impact of COVID-19 on Science, Engineering, and Health Graduate Enrollment: U.S. Part-Time Enrollment Increases as Full-Time Temporary Visa Holder Enrollment Declines. NSF 22-317. Alexandria, VA: National Science Foundation. Available at https://ncses.nsf.gov/pubs/nsf22317/.
Contact Us
NCSES
National Center for Science and Engineering Statistics
Directorate for Social, Behavioral and Economic Sciences
National Science Foundation
2415 Eisenhower Avenue, Suite W14200
Alexandria, VA 22314
Tel: (703) 292-8780
FIRS: (800) 877-8339
TDD: (800) 281-8749
E-mail: ncsesweb@nsf.gov