 An official website of the United States government
One-Fourth of Federal Obligations for R&D Are Directed to Two States: California and Maryland
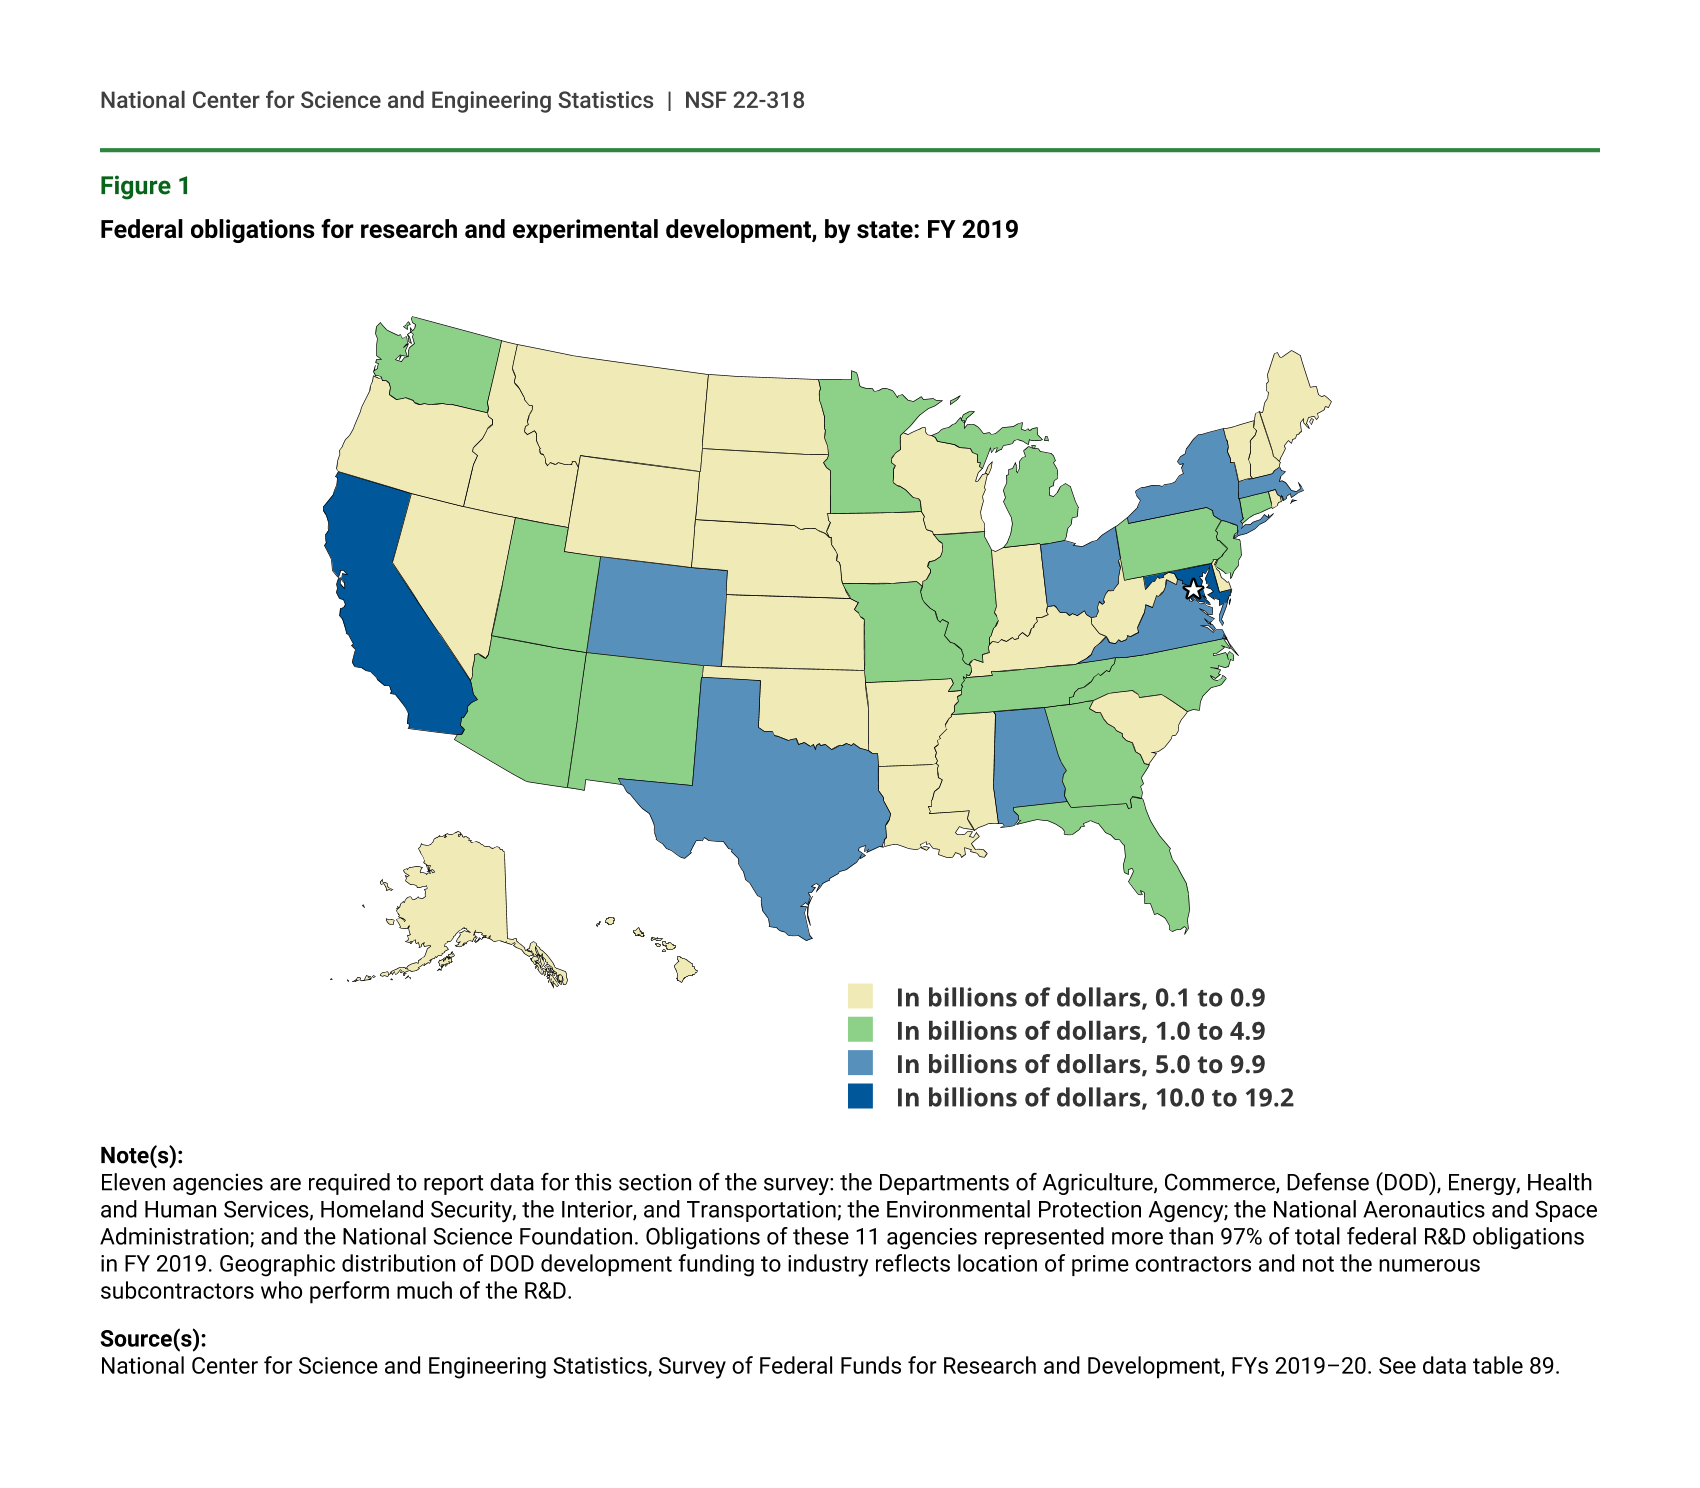
Federal obligations for research and development to all performers across the 50 states and the District of Columbia totaled $134.6 billion in FY 2019. However, federal obligations for R&D are far from a monolithic enterprise; instead, funding comes from multiple programs, projects, and activities spread across 15 departments and 18 independent agencies that are diverse in their mission and focus, including agriculture, national defense, health, and general science. Similarly, while $19.2 billion and $17.0 billion—nearly 27% of all R&D obligations across the states—are distributed to performers of R&D in California and Maryland, respectively, the dynamics of all this funding are more nuanced (figure 1). For example, how do federal obligations across the country differ by region? Which federal agencies are the largest funders of R&D in the respective states? How are R&D obligations directed to different types of performers of R&D within a state?
The answers to these and similar questions regarding the federal R&D enterprise can be found in the statistics from the Survey of Federal Funds for Research and Development (Federal Funds Survey), conducted by the National Center for Science and Engineering Statistics (NCSES) within the National Science Foundation (NSF).
Federal R&D Obligations
While the Federal Funds Survey collects data from all 33 departments and agencies with any R&D obligations, just 11 of them are required to report this information by state and territories, namely, the Departments of Agriculture (USDA), Commerce (DOC), Defense (DOD), Energy (DOE), Health and Human Services (HHS), Homeland Security (DHS), the Interior (DOI), and Transportation (DOT); the Environmental Protection Agency (EPA); the National Aeronautics and Space Administration (NASA); and NSF. These 11 departments and agencies collectively accounted for more than 97% of all federal R&D obligations in FY 2019. The Federal Funds Survey measures federal R&D obligations and R&D plant obligations separately; data presented in this InfoBrief for R&D obligations do not include R&D plant.
Among these 11 departments and agencies, some have a much greater share in R&D funding than others. For example, just four agencies accounted for 90% of all R&D obligations in FY 2019. DOD is the largest contributor with 41%, followed by HHS at 28%, DOE with 11%, and NASA with 10%.
It is important to note that agencies are instructed to report R&D obligations by state; however, if they do not know where the work is performed, then they should report dollars for where funds are sent. Usually, this is the location for the primary recipient and not necessarily the location of any subawardees or where the work may actually be performed. For example, while DOD may award a contract to a prime contractor in Washington state who further subcontracts R&D work to businesses in California and Georgia, Washington state is still identified as the location where the funds were obligated. In other words, the geographic data available from the Federal Funds Survey indicate where the check is sent, not where the work is necessarily performed. For the purposes of this InfoBrief, the term state refers to both the state area as a unit of geography and a state equivalent, such as the District of Columbia.
Federal obligations for research and experimental development, by state: FY 2019
| State or location | Total |
|---|---|
| Alabama | 5.4 |
| Alaska | 0.3 |
| Arizona | 2.0 |
| Arkansas | 0.2 |
| California | 19.2 |
| Colorado | 5.3 |
| Connecticut | 2.7 |
| Delaware | 0.2 |
| District of Columbia | 6.2 |
| Florida | 3.9 |
| Georgia | 1.5 |
| Hawaii | 0.4 |
| Idaho | 0.9 |
| Illinois | 3.0 |
| Indiana | 0.9 |
| Iowa | 0.5 |
| Kansas | 0.3 |
| Kentucky | 0.3 |
| Louisiana | 0.4 |
| Maine | 0.2 |
| Maryland | 17.0 |
| Massachusetts | 6.8 |
| Michigan | 2.1 |
| Minnesota | 1.0 |
| Mississippi | 0.5 |
| Missouri | 2.4 |
| Montana | 0.2 |
| Nebraska | 0.2 |
| Nevada | 0.4 |
| New Hampshire | 0.7 |
| New Jersey | 2.8 |
| New Mexico | 3.8 |
| New York | 6.2 |
| North Carolina | 2.4 |
| North Dakota | 0.1 |
| Ohio | 5.2 |
| Oklahoma | 0.5 |
| Oregon | 0.7 |
| Pennsylvania | 4.1 |
| Rhode Island | 0.7 |
| South Carolina | 0.6 |
| South Dakota | 0.1 |
| Tennessee | 3.6 |
| Texas | 5.1 |
| Utah | 1.3 |
| Vermont | 0.1 |
| Virginia | 8.0 |
| Washington | 3.2 |
| West Virginia | 0.1 |
| Wisconsin | 0.8 |
| Wyoming | 0.1 |
Note(s):
Eleven agencies are required to report data for this section of the survey: the Departments of Agriculture, Commerce, Defense (DOD), Energy, Health and Human Services, Homeland Security, the Interior, and Transportation; the Environmental Protection Agency; the National Aeronautics and Space Administration; and the National Science Foundation. Obligations of these 11 agencies represented more than 97% of total federal R&D obligations in FY 2019. Geographic distribution of DOD development funding to industry reflects location of prime contractors and not the numerous subcontractors who perform much of the R&D.
Source(s):
National Center for Science and Engineering Statistics, Survey of Federal Funds for Research and Development, FYs 2019–20. See data table 89.
Federal R&D Obligations by State
Of the $134.6 billion obligated by the federal government for R&D across the United States, 63% ($84.3 billion) went to just 10 states (figure 2). Many of the top 10 states with the largest federal R&D obligation are also among the states with the highest levels of gross domestic product (GDP), such as California, Texas, and New York. However, some states with smaller GDP—such as Alabama, which ranks 27th in state GDP—appear on this top 10 list because of significant federal investment in R&D or an R&D industrial base supporting federal R&D infrastructure. For example, NASA’s Marshall Space Flight Center in Huntsville, Alabama, serves as a catalyst for nearly $1.4 billion in federal R&D obligations: $1.1 billion went to industry performers, and $215 million went directly to the NASA facilities in the state. DOD R&D obligations in Alabama totaled $3.6 billion, with $1.3 billion directed toward DOD intramural R&D in the state and another $2.2 billion to business sector performers.
Ten states with the largest federal obligations for research and experimental development: FY 2019
| State | Total |
|---|---|
| California | 19.2 |
| Maryland | 17.0 |
| Virginia | 8.0 |
| Massachusetts | 6.8 |
| District of Columbia | 6.2 |
| New York | 6.2 |
| Alabama | 5.4 |
| Colorado | 5.3 |
| Ohio | 5.2 |
| Texas | 5.1 |
Note(s):
Eleven agencies are required to report data for this section of the survey: the Departments of Agriculture, Commerce, Defense (DOD), Energy, Health and Human Services, Homeland Security, the Interior, and Transportation; the Environmental Protection Agency; the National Aeronautics and Space Administration; and the National Science Foundation. Obligations of these 11 agencies represented more than 97% of total federal R&D obligations in FY 2019. Geographic distribution of DOD development funding to industry reflects location of prime contractors and not the numerous subcontractors who perform much of the R&D.
Source(s):
National Center for Science and Engineering Statistics, Survey of Federal Funds for Research and Development, FYs 2019–20. See data table 89.
When normalized to state GDP, the states with the highest federal R&D intensity (the ratio of federal R&D obligations to state GDP) are the District of Columbia, Maryland, New Mexico, and Alabama (figure 3). New Mexico’s federal R&D was largely driven by obligations from DOE and DOD, which accounted for 53% ($2.0 billion) and 40% ($1.5 billion), respectively, of federal R&D obligations to the state. When considering the recipients of these obligations, 60% ($2.3 billion) of all federal R&D obligations in New Mexico ($3.8 billion) are directed toward two DOE-sponsored federally funded research and development centers (FFRDCS) located in the state, namely, Los Alamos National Laboratory and Sandia National Laboratories, as well as to the NSF-sponsored National Solar Observatory.
Ratio of federal obligations for research and experimental development to state gross domestic product, by state: FY 2019
| State or location | Ratio |
|---|---|
| Alabama | 2.34 |
| Alaska | 0.61 |
| Arizona | 0.54 |
| Arkansas | 0.14 |
| California | 0.63 |
| Colorado | 1.34 |
| Connecticut | 0.93 |
| Delaware | 0.21 |
| District of Columbia | 4.31 |
| Florida | 0.35 |
| Georgia | 0.24 |
| Hawaii | 0.45 |
| Idaho | 1.12 |
| Illinois | 0.34 |
| Indiana | 0.23 |
| Iowa | 0.27 |
| Kansas | 0.16 |
| Kentucky | 0.14 |
| Louisiana | 0.17 |
| Maine | 0.28 |
| Maryland | 4.03 |
| Massachusetts | 1.15 |
| Michigan | 0.39 |
| Minnesota | 0.27 |
| Mississippi | 0.44 |
| Missouri | 0.71 |
| Montana | 0.37 |
| Nebraska | 0.19 |
| Nevada | 0.21 |
| New Hampshire | 0.76 |
| New Jersey | 0.44 |
| New Mexico | 3.68 |
| New York | 0.35 |
| North Carolina | 0.41 |
| North Dakota | 0.12 |
| Ohio | 0.75 |
| Oklahoma | 0.25 |
| Oregon | 0.28 |
| Pennsylvania | 0.51 |
| Rhode Island | 1.18 |
| South Carolina | 0.26 |
| South Dakota | 0.16 |
| Tennessee | 0.95 |
| Texas | 0.27 |
| Utah | 0.67 |
| Vermont | 0.35 |
| Virginia | 1.45 |
| Washington | 0.53 |
| West Virginia | 0.18 |
| Wisconsin | 0.24 |
| Wyoming | 0.17 |
GDP = gross domestic product.
Note(s):
Federal R&D intensity is the ratio of federal R&D obligations to state gross domestic product. Eleven agencies are required to report data for this section of the survey: the Departments of Agriculture, Commerce, Defense (DOD), Energy, Health and Human Services, Homeland Security, the Interior, and Transportation; the Environmental Protection Agency; the National Aeronautics and Space Administration; and the National Science Foundation. Obligations of these 11 agencies represented more than 97% of total federal R&D obligations in FY 2019. Geographic distribution of DOD development funding to industry reflects location of prime contractors and not the numerous subcontractors who perform much of the R&D.
Source(s):
National Center for Science and Engineering Statistics, Survey of Federal Funds for Research and Development, FYs 2019–20, See data table 89. State GDP data are from the Bureau of Economic Analysis, http://www.bea.gov/regional/index.htm, accessed 3 November 2021.
Federal R&D Obligations by Region
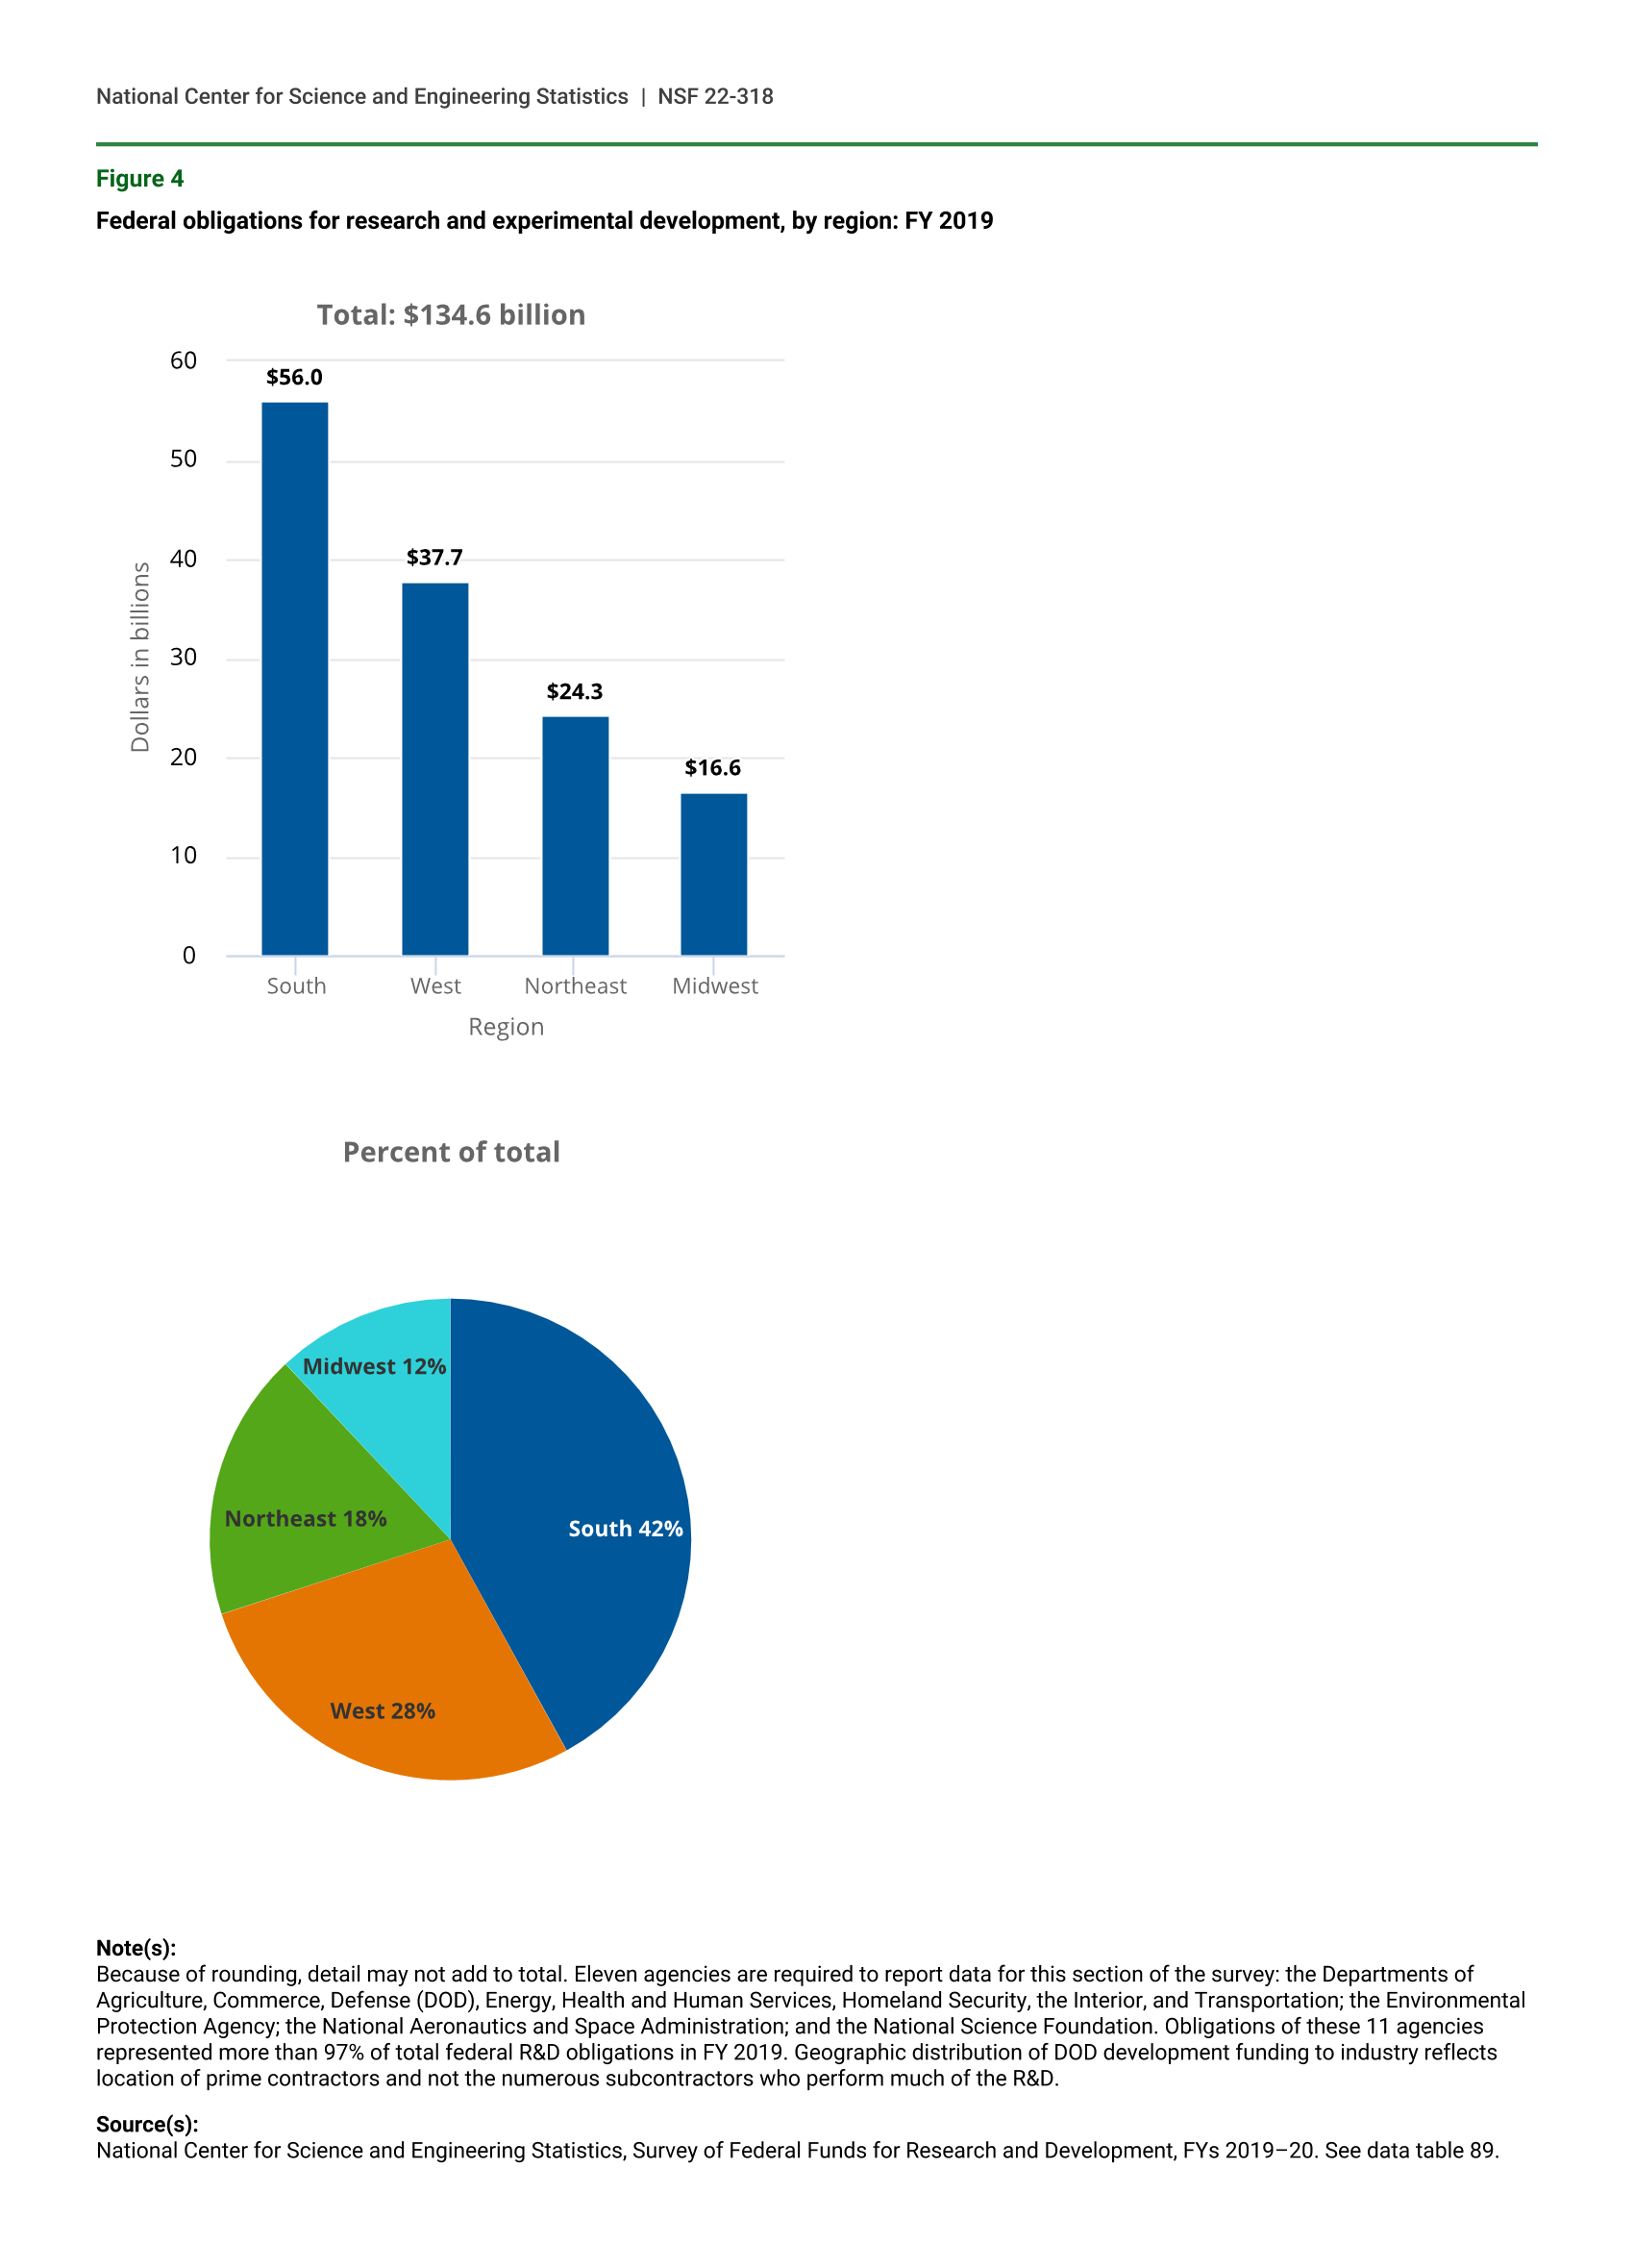
In terms of the regional location of where federal R&D funds are obligated, performers in Southern states received the most—42% ($56.0 billion)—followed by those in Western states at 28% ($37.7 billion). The Northeast and Midwest received 18% ($24.3 billion) and 12% ($16.6 billion), respectively (figure 4).
Federal obligations for research and experimental development, by region: FY 2019
| Region | Total |
|---|---|
| South | 56.0 |
| West | 37.7 |
| Northeast | 24.3 |
| Midwest | 16.6 |
| Region | Percent |
|---|---|
| South | 42 |
| West | 28 |
| Northeast | 18 |
| Midwest | 12 |
Note(s):
Because of rounding, detail may not add to total. Eleven agencies are required to report data for this section of the survey: the Departments of Agriculture, Commerce, Defense (DOD), Energy, Health and Human Services, Homeland Security, the Interior, and Transportation; the Environmental Protection Agency; the National Aeronautics and Space Administration; and the National Science Foundation. Obligations of these 11 agencies represented more than 97% of total federal R&D obligations in FY 2019. Geographic distribution of DOD development funding to industry reflects location of prime contractors and not the numerous subcontractors who perform much of the R&D.
Source(s):
National Center for Science and Engineering Statistics, Survey of Federal Funds for Research and Development, FYs 2019–20. See data table 89.
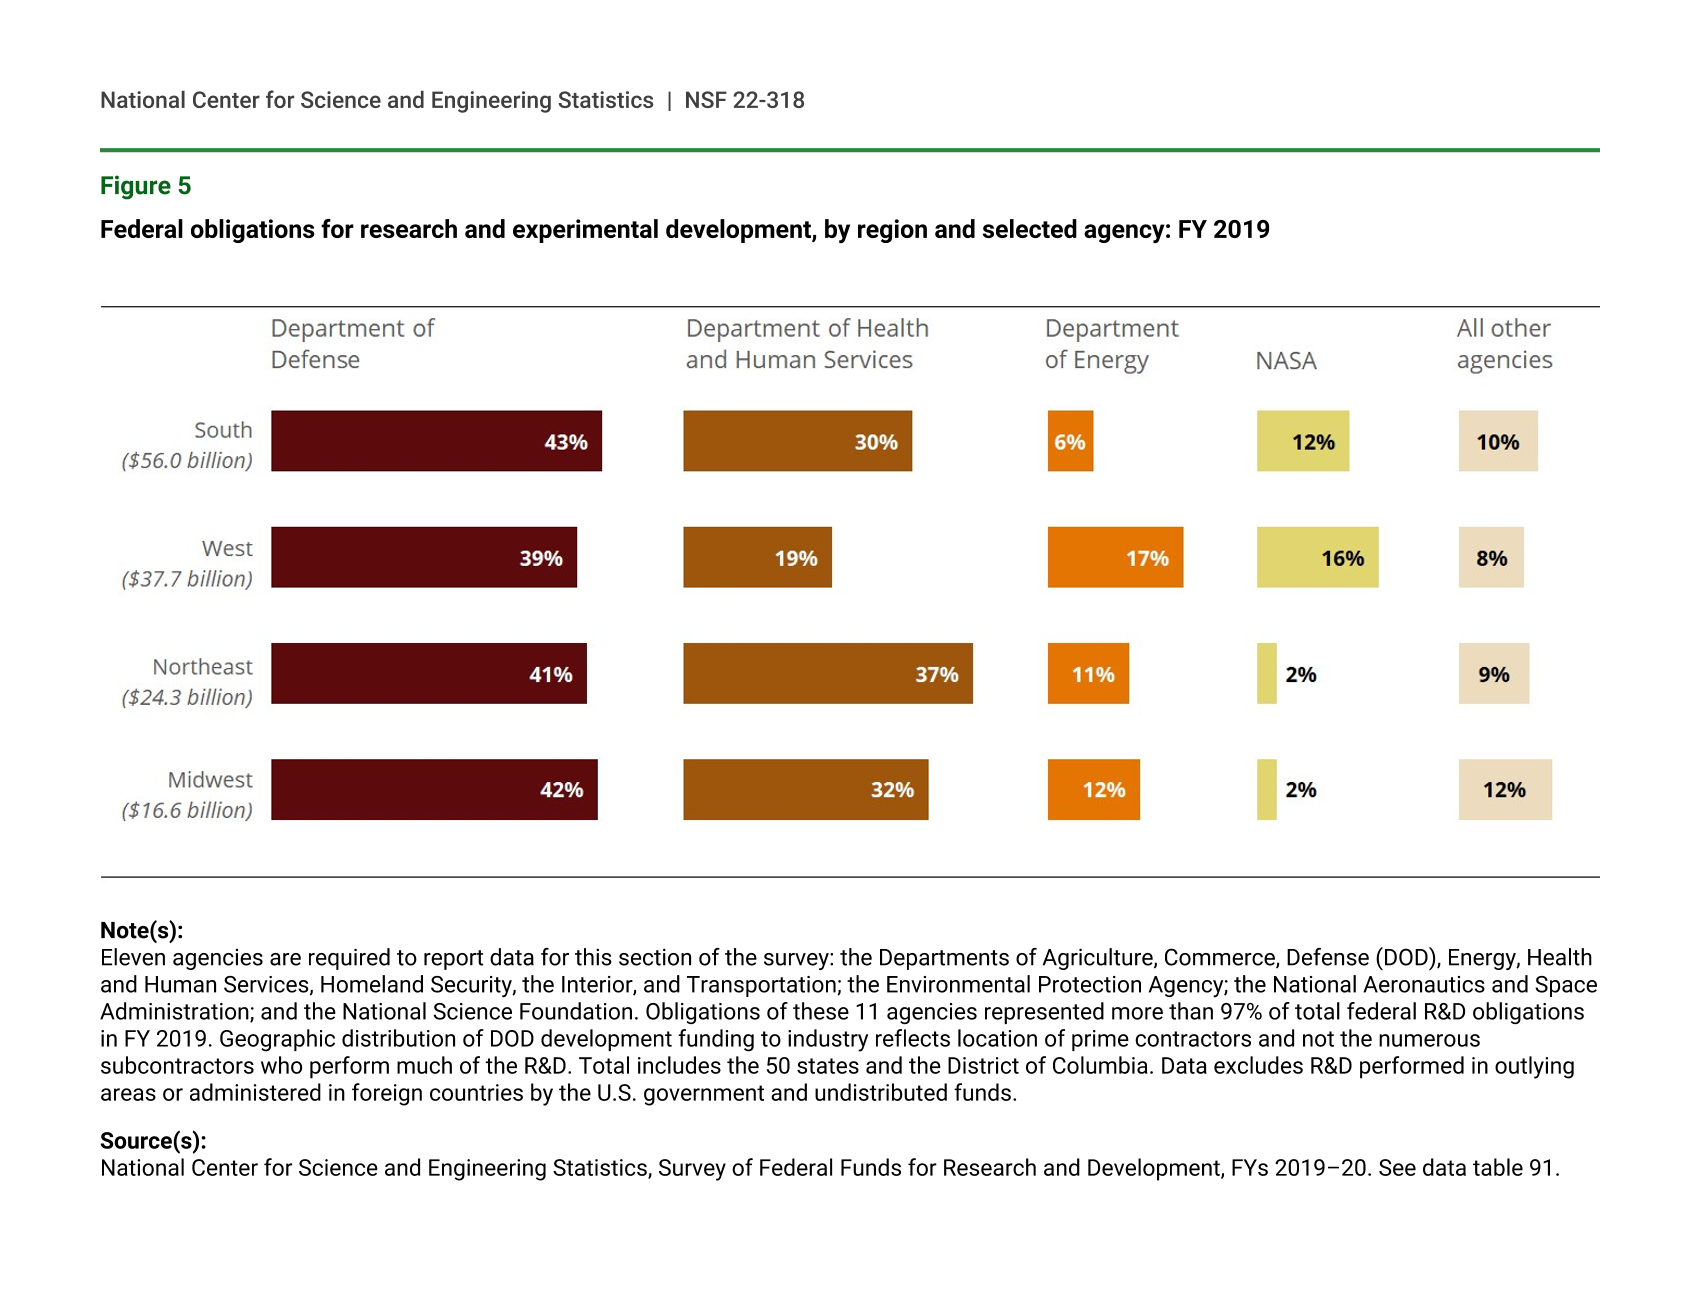
Across regions, while DOD’s share of R&D is relatively consistent (ranging from 39% in the Northeast to 43% in the South), HHS, DOE, and NASA show more variation (figure 5). For example, NASA’s R&D obligations comprised 16% of the total for Western states and 12% for Southern states, but only 2% of R&D obligations in the Northeast and Midwest. These relative shares help illustrate the structural dynamics of R&D performers in the United States. For example, while DOD’s R&D presence is pervasive and relatively consistent across the country, the comparatively large 37% share (or $9.1 billion) of R&D obligated by HHS in the Northeast is indicative of the sizable number of medical schools in the region compared with other regions. With nearly $6.0 billion in R&D obligations in FY 2019, NSF is the only federal agency whose mission includes support for all fields of basic research in science and engineering. NSF’s relative share of R&D across regions varies from 6% of all federal R&D obligations in both the Midwestern states ($1.1 billion) and Northeastern states ($1.4 billion), 4% ($1.7 billion) of the Western states, and 3% ($1.8 billion) of the Southern states.
Federal obligations for research and experimental development, by region and selected agency: FY 2019
Note(s):
Eleven agencies are required to report data for this section of the survey: the Departments of Agriculture, Commerce, Defense (DOD), Energy, Health and Human Services, Homeland Security, the Interior, and Transportation; the Environmental Protection Agency; the National Aeronautics and Space Administration; and the National Science Foundation. Obligations of these 11 agencies represented more than 97% of total federal R&D obligations in FY 2019. Geographic distribution of DOD development funding to industry reflects location of prime contractors and not the numerous subcontractors who perform much of the R&D. Total includes the 50 states and the District of Columbia. Data excludes R&D performed in outlying areas or administered in foreign countries by the U.S. government and undistributed funds.
Source(s):
National Center for Science and Engineering Statistics, Survey of Federal Funds for Research and Development, FYs 2019–20. See data table 91.
Federal R&D Obligations by Type of Performer
The Federal Funds Survey also provides a crosscut of federal R&D obligations by state by type-of-performer. Performer categories include federal intramural performers and multiple types of extramural performers. Specifically, intramural performers are the agencies of the federal government (so intramural R&D refers to the R&D performed by federal employees or on-site contractors). Extramural performers include businesses, universities and colleges, nonprofit institutions, and state and local governments. FFRDCs also are categorized here as a separate type of extramural performer.
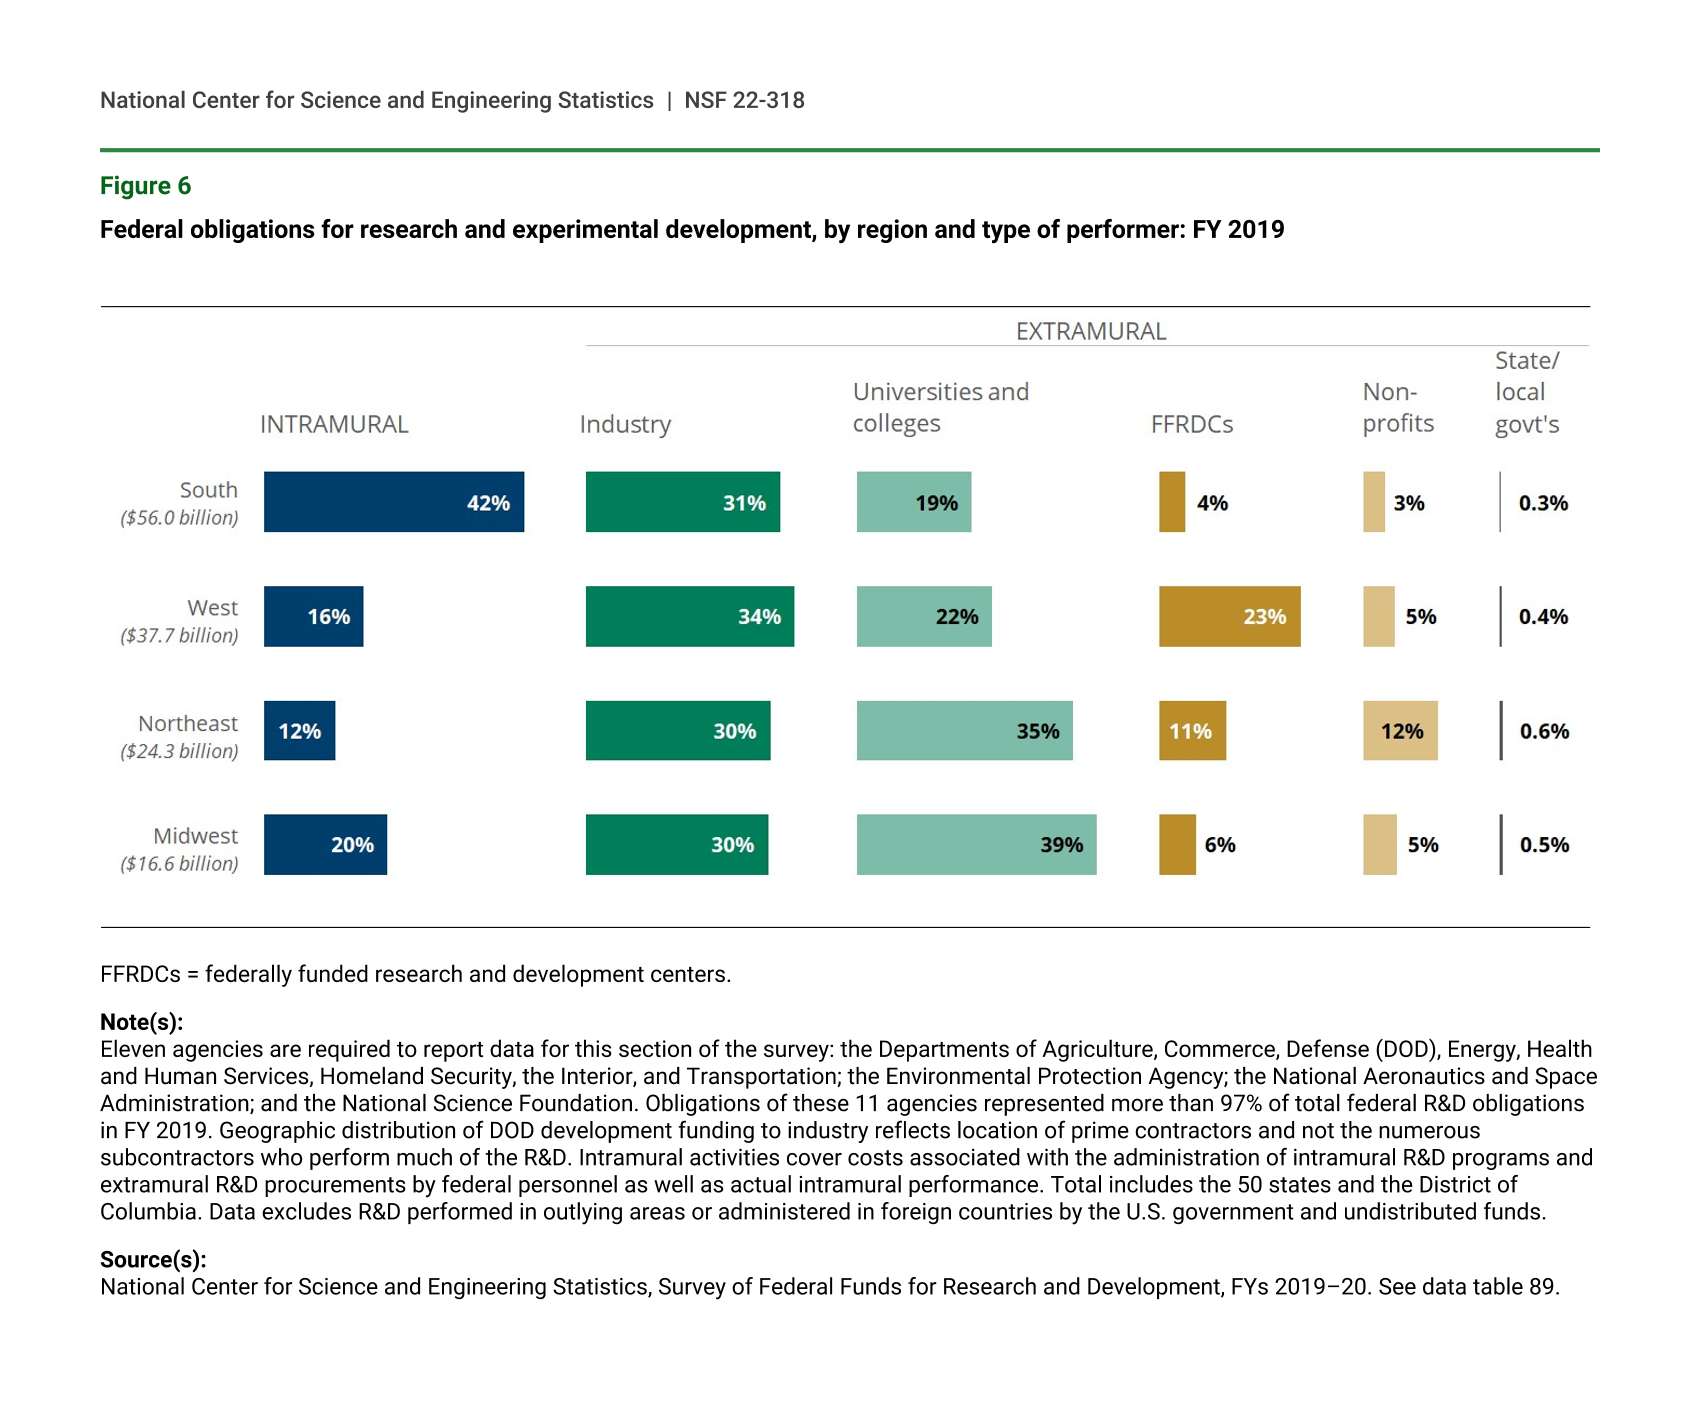
Among all states and the District of Columbia, about a quarter of federal R&D obligations are intramural (26%, or $35.7 billion). Across regions, however, the South—at 42%—had the greatest share of its federal R&D obligations reportedly as intramural, considerably higher than the national share and more than twice that obligated to the Midwest (20%), West (16%), and Northeast (12%) (figure 6).
Federal obligations for research and experimental development, by region and type of performer: FY 2019
FFRDCs = federally funded research and development centers.
Note(s):
Eleven agencies are required to report data for this section of the survey: the Departments of Agriculture, Commerce, Defense (DOD), Energy, Health and Human Services, Homeland Security, the Interior, and Transportation; the Environmental Protection Agency; the National Aeronautics and Space Administration; and the National Science Foundation. Obligations of these 11 agencies represented more than 97% of total federal R&D obligations in FY 2019. Geographic distribution of DOD development funding to industry reflects location of prime contractors and not the numerous subcontractors who perform much of the R&D. Intramural activities cover costs associated with the administration of intramural R&D programs and extramural R&D procurements by federal personnel as well as actual intramural performance. Total includes the 50 states and the District of Columbia. Data excludes R&D performed in outlying areas or administered in foreign countries by the U.S. government and undistributed funds.
Source(s):
National Center for Science and Engineering Statistics, Survey of Federal Funds for Research and Development, FYs 2019–20. See data table 89.
The dominance of intramural funding in the South is due in large part to the National Institutes of Health (NIH) Clinical Center in Bethesda, Maryland, the nation’s largest hospital devoted entirely to clinical research. Of the $35.7 billion in intramural obligations in FY 2019, nearly $11.0 billion was directed to federal intramural R&D in Maryland, of which $7.2 billion alone was directed to NIH. The District of Columbia and Virginia received $4.5 billion and $2.3 billion, respectively, in federal intramural R&D obligations followed by Alabama ($1.6 billion) and Florida ($1.1 billion).
Overall, 74% ($98.9 billion) of federal R&D obligations are extramural, including 32% ($42.6 billion) to businesses, 25% ($33.6 billion) to universities and colleges, and 11% ($14.6 billion) to FFRDCs. Across the regions, federal R&D obligations to businesses comprised about the same share (between 30% and 34%), but there are pronounced regional differences in where federal R&D obligations were directed in terms of R&D performance by universities and colleges and by FFRDCs. For example, obligations to universities and colleges comprised over a third of federal R&D obligations for two regions—the Midwest (39%) and the Northeast (35%). Similarly, R&D obligations to FFRDCs made up 23% of all federal R&D obligations in the West, far more than in any other region.
Type of Performer and State
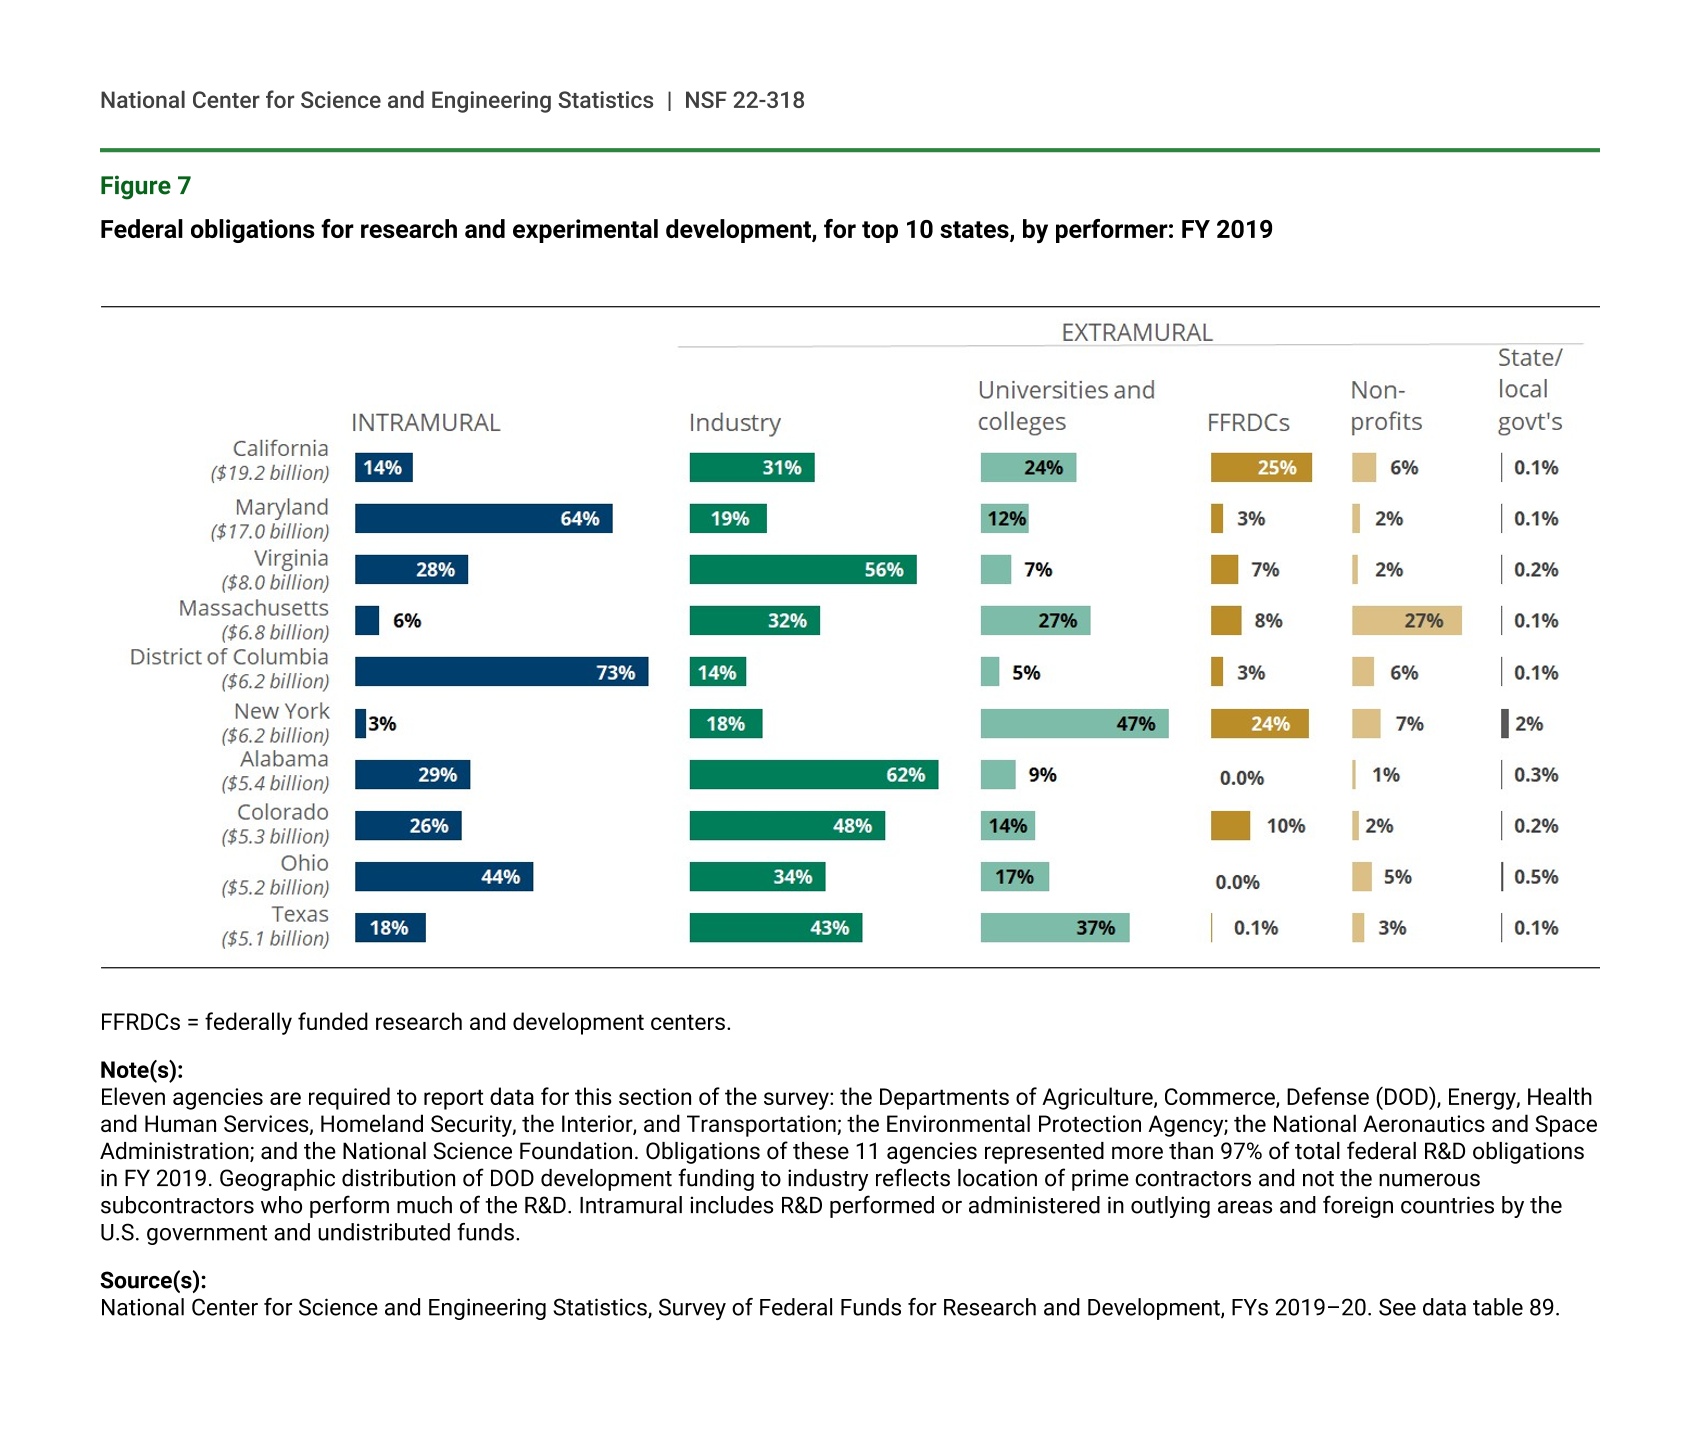
The differences seen in the regional distribution of federal R&D obligations by type of performer is magnified when the data are crosscut by state. Among the 10 states with the largest total federal R&D obligations, the District of Columbia has the highest share of intramural R&D (73%), followed by its neighbor Maryland (64%) (figure 7). Business R&D represents over half of all federal R&D obligations in Virginia (56%) and Alabama (62%). R&D to universities and colleges comprise nearly half of federal R&D obligations in New York (47%) and a third in Texas (37%). FFRDCs represent about a quarter of California’s (25%) and New York’s (24%) total, while about the same share comprises R&D at nonprofits in Massachusetts (27%).
While the two states with the largest federal obligations for R&D account for about a quarter (27%) of all federal R&D obligations, their respective performing sectors are distributed quite differently. Where federal intramural R&D accounted for 14% (or $2.7 billion) of California’s total federal R&D of $19.2 billion, it accounted for 64% ($10.8 billion) of Maryland’s total R&D ($17.0 billion). Where California’s business R&D performers total 31% ($6.0 billion) of the state’s federal R&D obligations, in Maryland 19% ($3.2 billion) of its federal funds for R&D were directed toward the business sector.
Federal obligations for research and experimental development, for top 10 states, by performer: FY 2019
FFRDCs = federally funded research and development centers.
Note(s):
Eleven agencies are required to report data for this section of the survey: the Departments of Agriculture, Commerce, Defense (DOD), Energy, Health and Human Services, Homeland Security, the Interior, and Transportation; the Environmental Protection Agency; the National Aeronautics and Space Administration; and the National Science Foundation. Obligations of these 11 agencies represented more than 97% of total federal R&D obligations in FY 2019. Geographic distribution of DOD development funding to industry reflects location of prime contractors and not the numerous subcontractors who perform much of the R&D. Intramural includes R&D performed or administered in outlying areas and foreign countries by the U.S. government and undistributed funds.
Source(s):
National Center for Science and Engineering Statistics, Survey of Federal Funds for Research and Development, FYs 2019–20. See data table 89.
Data Sources, Limitations, and Availability
The Survey of Federal Funds for Research and Development is a census of all federal agencies that fund R&D programs. R&D obligations by place of performance are limited to 11 selected departments and agencies: DHS, DOC, DOD, DOE, DOI, DOT, EPA, HHS, NASA, NSF, and USDA. However, these 11 departments and agencies collectively accounted for more than 97% of all federal R&D obligations in FY 2019. Agencies are instructed to report place of performance as the principal location where the work is performed by the primary contractor, grantee, or intramural organization. If location information is not available, agencies are instructed to assign the obligations to the state, District of Columbia, Puerto Rico, other area, or office abroad where the headquarters of the U.S. primary contractor, grantee, or intramural organization is located. Geographic distribution of DOD experimental development funding to industry reflects location of prime contractors and not the numerous subcontractors who perform much of the R&D.
The survey collects data on outlays for total R&D and R&D plant; obligations for R&D by type of R&D, by type of performer, by state by type of performer, and by foreign country; and research by fields of science and engineering.
The full set of data tables from this survey and more information on the survey methodology are available at https://ncses.nsf.gov/pubs/nsf21329.
Notes
1Obligations represent the amount for orders placed, contracts awarded, services received, and similar transactions during a given period, regardless of when the funds were appropriated or when future payment of money is required. This includes funds from direct appropriations, trust funds, special accounts, fees and charges, and other federal sources for the year of obligation. Obligations include the full cost of R&D, both specific project costs and overhead costs.
2Effective with volume 71, the Survey of Federal Funds for Research and Development will request R&D obligations by geography for all responding departments and agencies.
3In addition, federal agencies obligated $521 million to outlying territories and $4 million in offices abroad; another $3.1 billion in R&D obligations were not distributed among the individual states. These amounts are excluded from the totals in this analysis.
4As defined in the Office of Management and Budget Circular A-11, Section 84 (Schedule C), R&D plant includes physical assets, such as land, structures, equipment, and intellectual property (e.g., software or applications) that have an estimated useful life of 2 years or more. Reporting for R&D plant includes the purchase, construction, manufacture, rehabilitation, or major improvement of physical assets regardless of ownership of the assets. Data on R&D plant obligations are available in the full set of data tables at https://ncses.nsf.gov/pubs/nsf21329.
5See Table 91 in the full set of data tables at https://ncses.nsf.gov/pubs/nsf21329.
6Survey instructions to federal departments and agencies that are required to report R&D obligations by state specifically instruct: “Report the principal location where the work is performed by the primary contractor, grantee, or intramural organization. If location information is not available, assign the obligations to the state, District of Columbia, Puerto Rico, other area, or office abroad where the headquarters of the U.S. primary contractor, grantee, or intramural organization is located.” See survey instructions on page xvi of both the DOD (https://nsf.gov/statistics/srvyfedfunds/surveys/srvyfedfunds-2019-2020-dod.pdf) and non-DOD (https://nsf.gov/statistics/srvyfedfunds/surveys/srvyfedfunds-2019-2020-non-dod.pdf) versions of the questionnaire.
7State GDP for 2019 was accessed on 3 November 2021 from the Bureau of Economic Analysis at https://apps.bea.gov/itable/iTable.cfm?ReqID=70&step=1.
8Data on federal R&D obligations, by state or location, selected agency, and performer, are available in Table 92 in the full set of data tables at https://ncses.nsf.gov/pubs/nsf21329.
9See Table 92 in the full set of data tables at https://ncses.nsf.gov/pubs/nsf21329.
10See Table 92 in the full set of data tables at https://ncses.nsf.gov/pubs/nsf21329.
11Master Government List of Federally Funded Research and Development Centers, https://www.nsf.gov/statistics/ffrdclist/.
12Regional classifications utilize the U.S. Census Bureau’s Census Regions and Divisions of the United States, which can be found at https://www2.census.gov/geo/pdfs/maps-data/maps/reference/us_regdiv.pdf.
13See Medical School Headquarters, “Map of U.S. Medical Schools,” https://medicalschoolhq.net/map-of-medical-schools-in-the-us/.
14See Harris LA. 2021. The National Science Foundation: An Overview. CRS Report R46753. Washington, DC: Congressional Research Service. https://crsreports.congress.gov/product/pdf/R/R46753.
15Data are calculated from Table 91 in the full set of data tables at https://ncses.nsf.gov/pubs/nsf21329.
16See NIH, NIH Almanac, “Clinical Center,” https://www.nih.gov/about-nih/what-we-do/nih-almanac/clinical-center-cc.
17See Table 7 in the full set of data tables at https://ncses.nsf.gov/pubs/nsf21329.
18See Table 89 in the full set of data tables at https://ncses.nsf.gov/pubs/nsf21329.
19See Table 89, https://ncses.nsf.gov/pubs/nsf21329.
Suggested Citation
Pece CV, Jankowski JE, Grieco EM; National Center for Science and Engineering Statistics (NCSES). 2022. One-Fourth of Federal Obligations for R&D Are Directed to Two States: California and Maryland. NSF 22-318. Alexandria, VA: National Science Foundation. Available at https://ncses.nsf.gov/pubs/nsf22318/.
Contact Us
NCSES
National Center for Science and Engineering Statistics
Directorate for Social, Behavioral and Economic Sciences
National Science Foundation
2415 Eisenhower Avenue, Suite W14200
Alexandria, VA 22314
Tel: (703) 292-8780
FIRS: (800) 877-8339
TDD: (800) 281-8749
E-mail: ncsesweb@nsf.gov