 An official website of the United States government
Report
Postgraduation trends
A graduate’s first position after earning the doctoral degree may reflect broad economic conditions and can shape later career opportunities, earnings, and choices. Over the longer term, the early career patterns of doctorate recipients may influence the decisions of future students considering careers as scientists, engineers, scholars, and researchers.
Job market
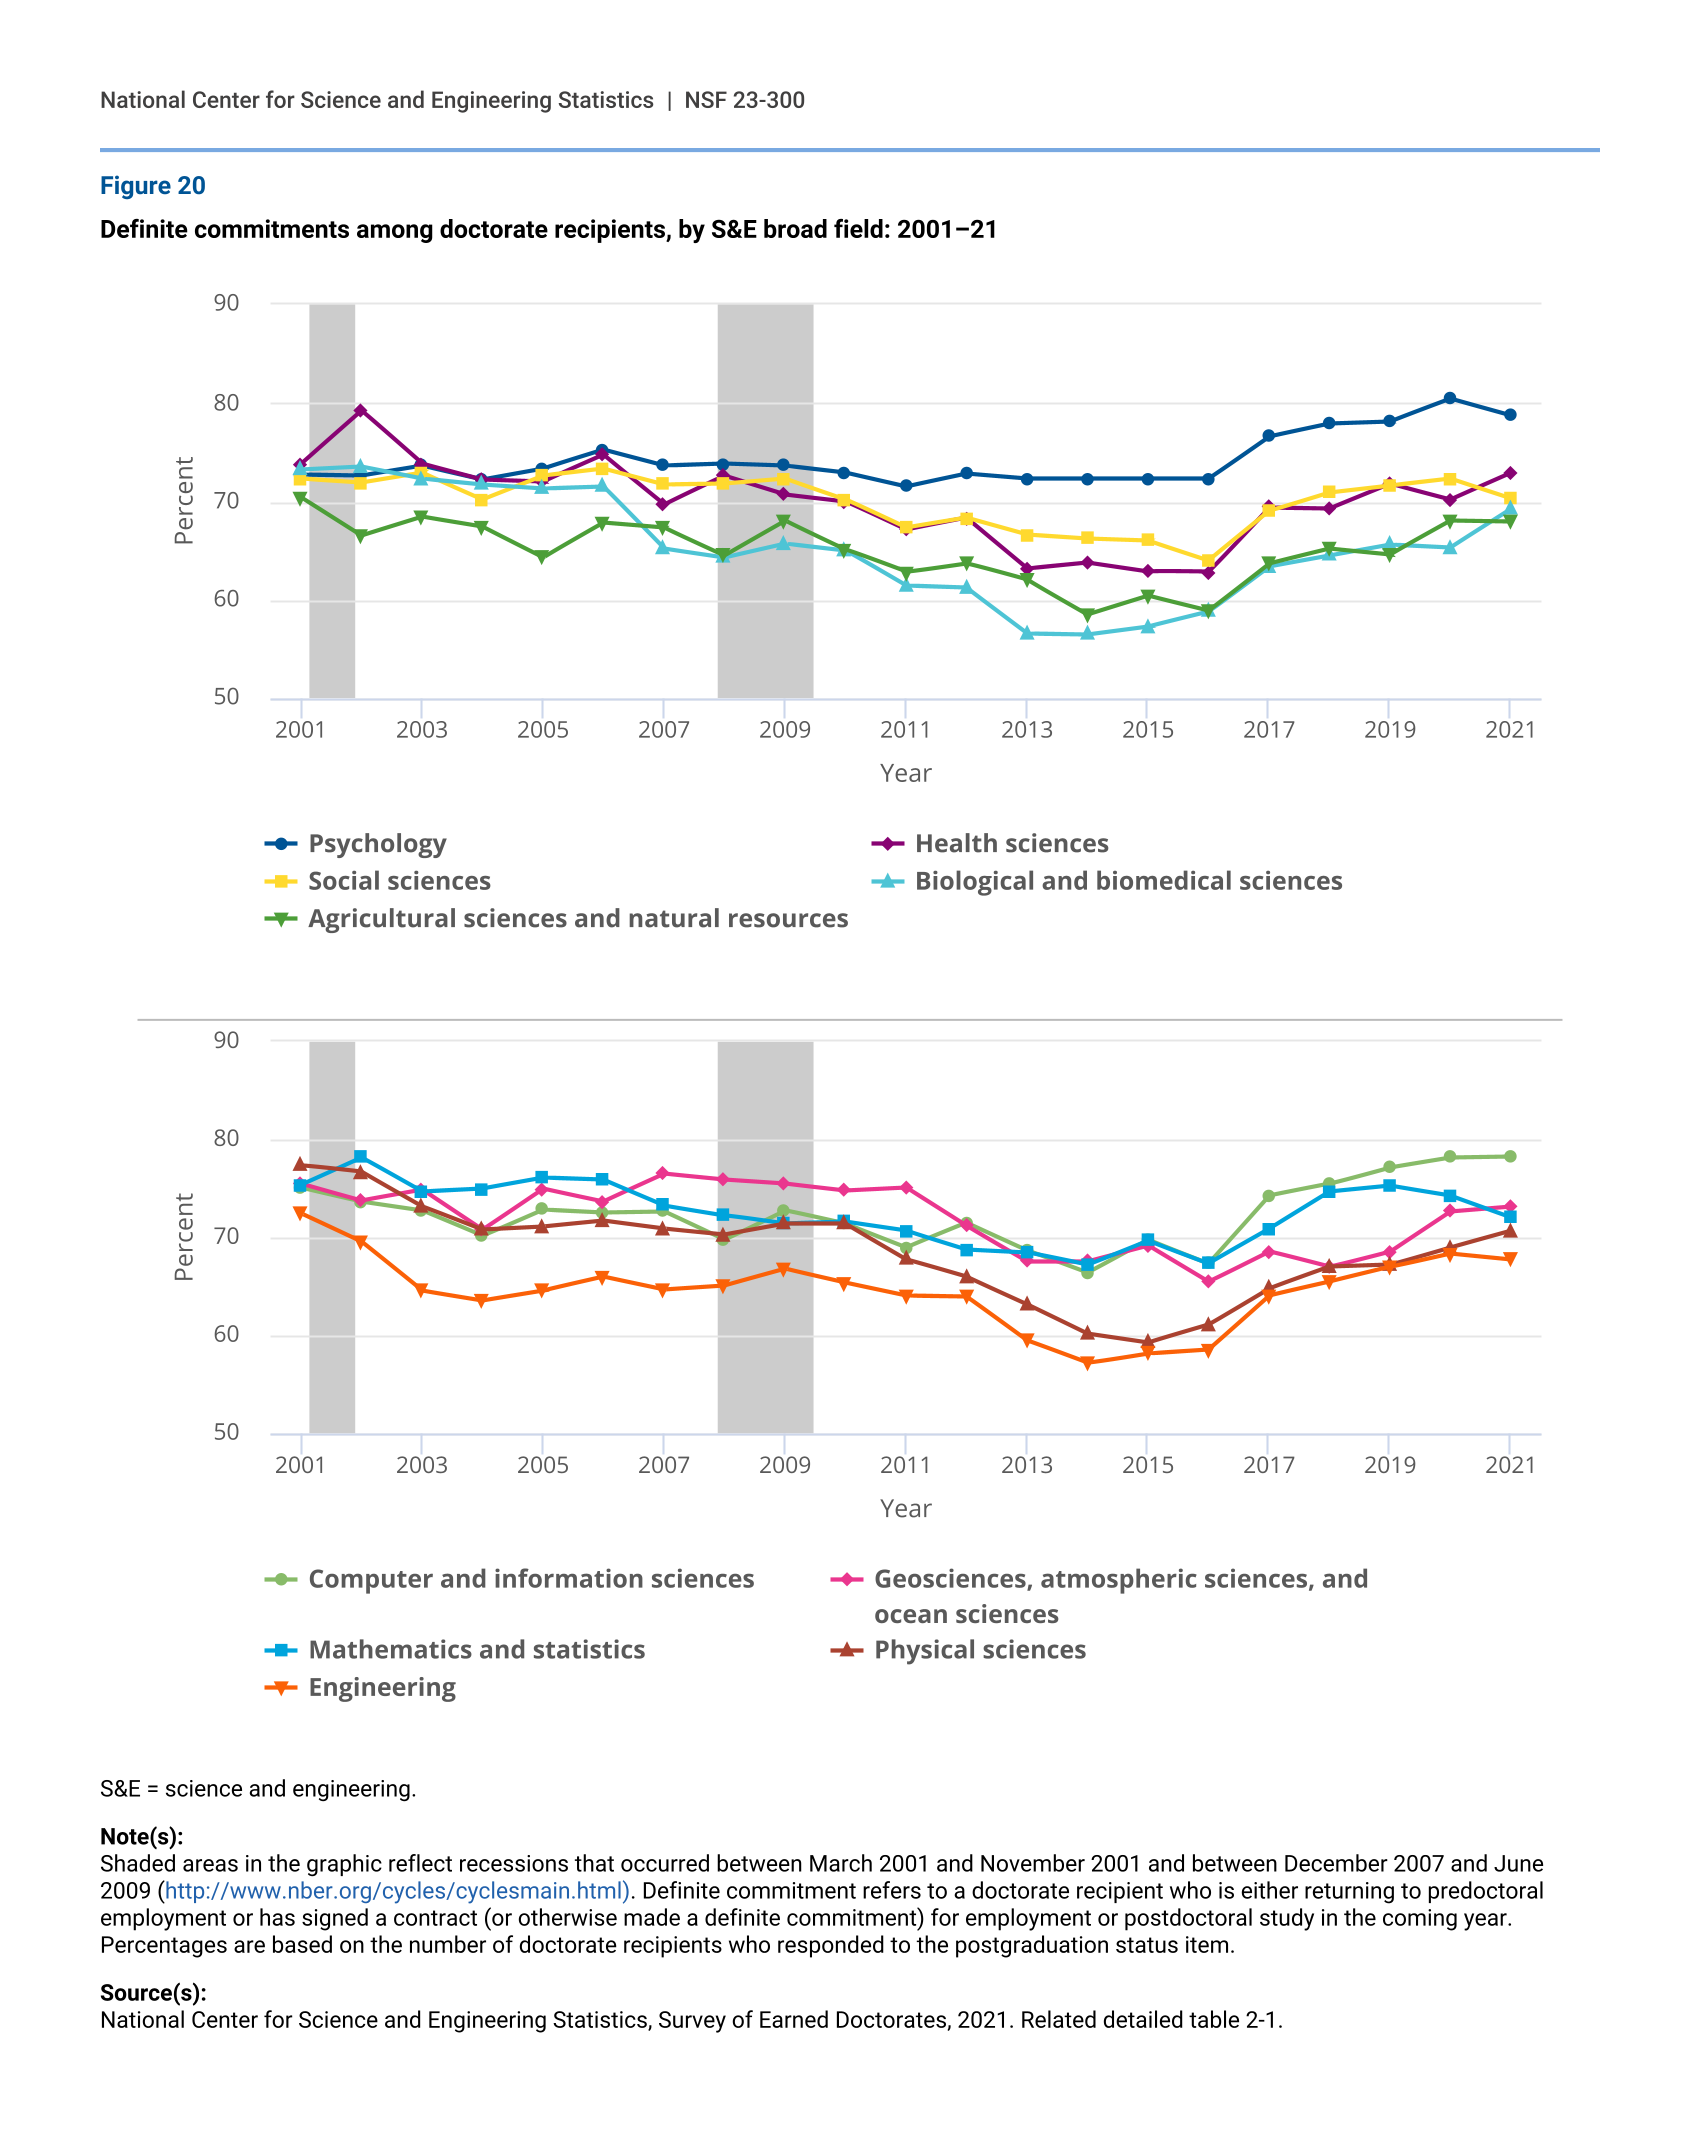
At any given time, the job market for new doctorate recipients will be better in some fields of study than in others. Though all fields tend to follow patterns that generally reflect overall trends in economic conditions, definite commitments at graduation are likely to be influenced by many factors. In general, doctorate recipients in S&E fields tend to have robust postgraduation career prospects. The proportions of 2021 doctorate recipients in S&E with definite commitments at graduation, including postdoctoral study positions (postdocs), ranged from 68% in engineering to 79% in psychology. Proportions were highest in computer and information sciences and psychology (78% and 79%, respectively). In computer and information sciences, this proportion peaked in 2021; in psychology, this proportion remains close to its all-time high in 2020 (figure 20).
In all other S&E fields, the proportion of doctorate recipients with definite commitments was lower compared to 20 years ago. The largest decline in this period was in physical sciences (from 77% in 2001 to 71% in 2021), engineering (from 73% to 68%), and biological and biomedical sciences (from 73% to 69%).
Compared to 2019, before the pandemic started, the proportion of doctorate recipients with definite commitments in 2021 increased in all fields except in mathematics and statistics and in social sciences, which declined by 3.2 and 1.3 percentage points, respectively. The largest increases in this proportion between 2019 and 2021 were in geosciences, atmospheric sciences, and ocean sciences (5 percentage points), biological and biomedical sciences (4 percentage points), and physical sciences (4 percentage points). (For more details on the effects of the pandemic on definite commitments, see section “Special focus: COVID-19 pandemic impacts on doctorate recipients.”)
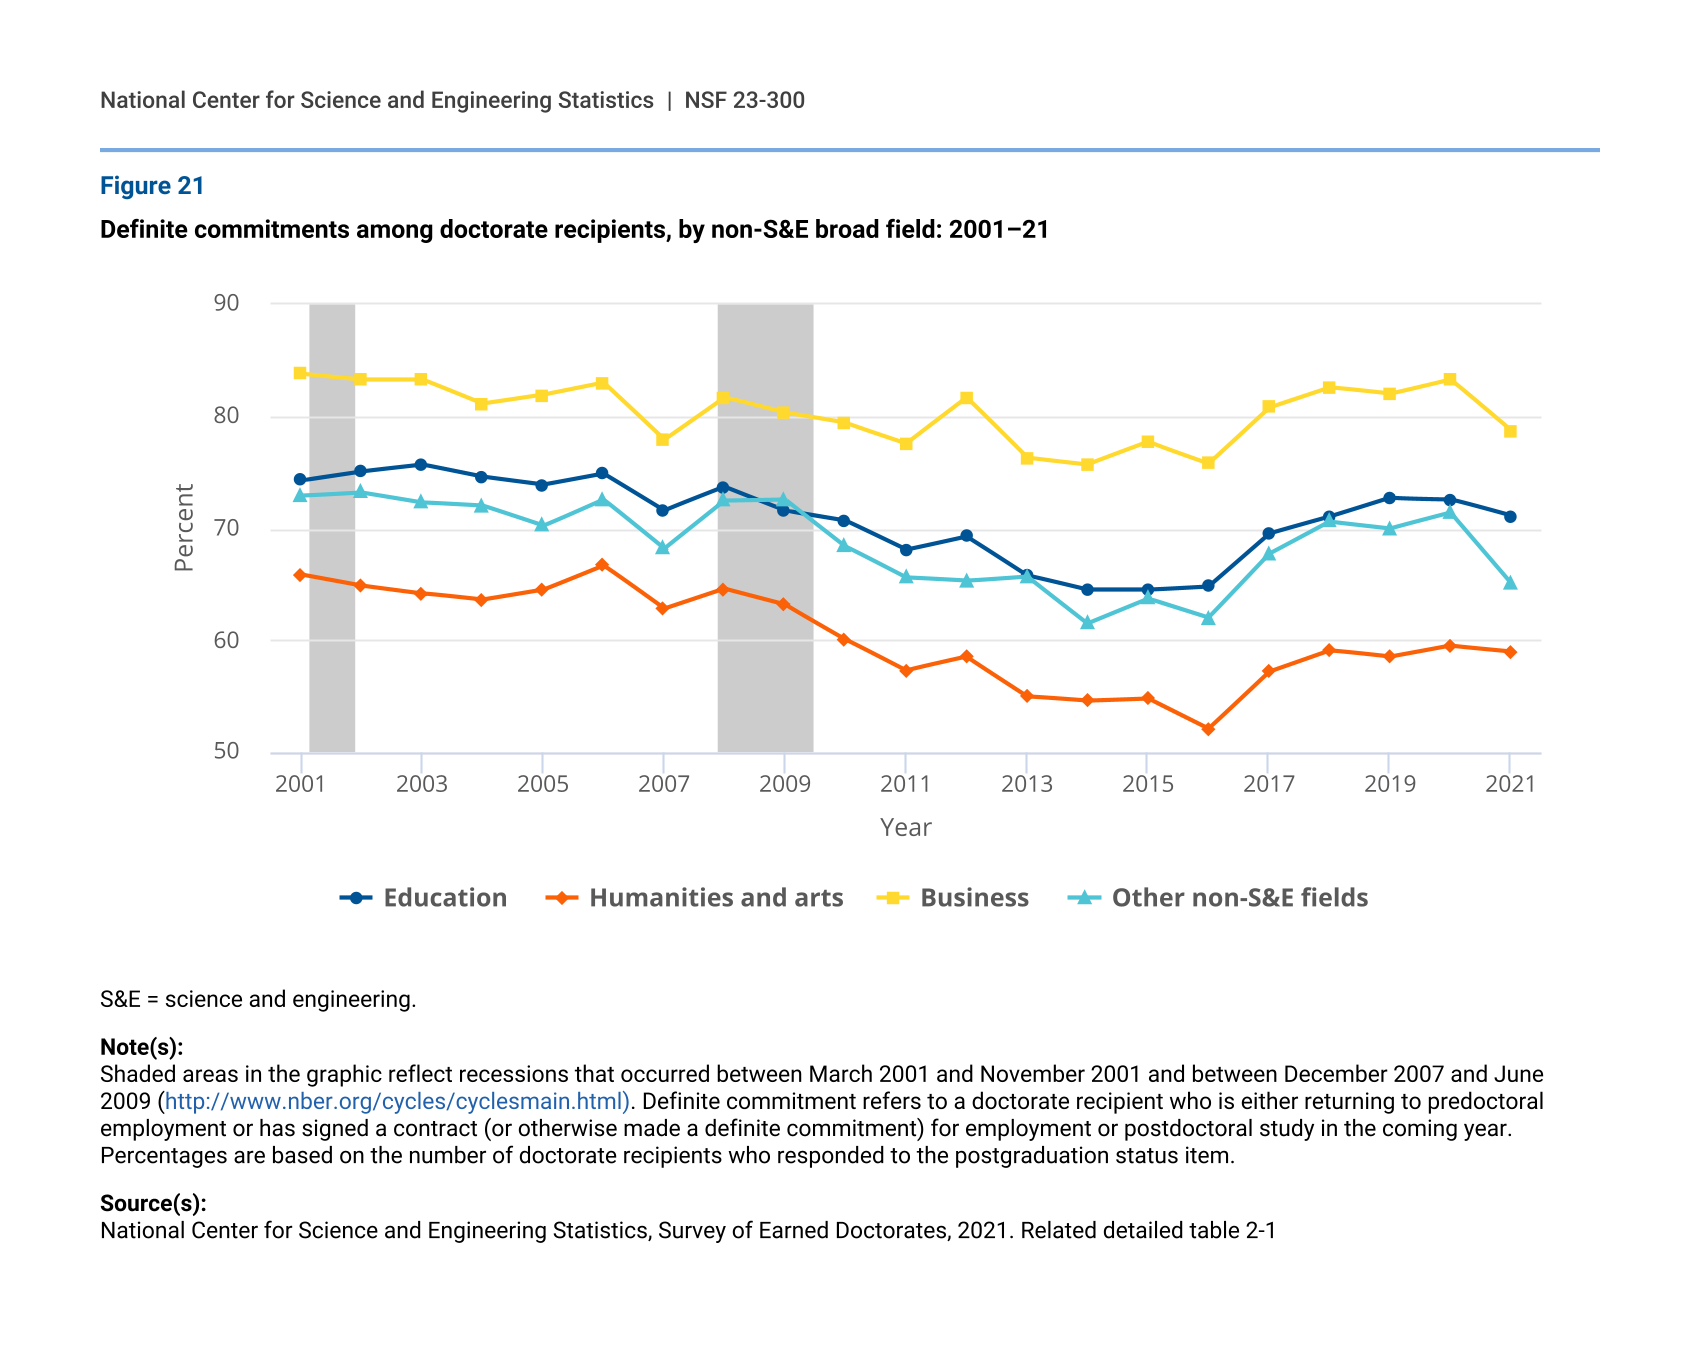
In non-S&E fields, the proportion of doctorate recipients reporting definite commitments in 2021 was lower when compared to 2001 in all fields (figure 21). These fields had recovered from lows in 2014–16 but declined again after 2019 except in humanities and arts, where the proportion remained flat at about 59%.
Definite commitments among doctorate recipients, by S&E broad field: 2001–21
| Year | Psychology | Health sciences | Social sciences | Biological and biomedical sciences | Agricultural sciences and natural resources |
|---|---|---|---|---|---|
| 2001 | 72.7 | 73.8 | 72.3 | 73.2 | 70.4 |
| 2002 | 72.6 | 79.2 | 71.9 | 73.5 | 66.5 |
| 2003 | 73.6 | 73.8 | 72.9 | 72.3 | 68.4 |
| 2004 | 72.2 | 72.2 | 70.2 | 71.7 | 67.4 |
| 2005 | 73.3 | 72.0 | 72.6 | 71.3 | 64.3 |
| 2006 | 75.2 | 74.7 | 73.3 | 71.5 | 67.8 |
| 2007 | 73.6 | 69.7 | 71.7 | 65.2 | 67.3 |
| 2008 | 73.8 | 72.6 | 71.8 | 64.3 | 64.5 |
| 2009 | 73.6 | 70.7 | 72.3 | 65.7 | 68.0 |
| 2010 | 72.9 | 70.0 | 70.2 | 65.0 | 65.1 |
| 2011 | 71.5 | 67.1 | 67.3 | 61.4 | 62.8 |
| 2012 | 72.8 | 68.3 | 68.3 | 61.2 | 63.7 |
| 2013 | 72.3 | 63.2 | 66.6 | 56.6 | 62.0 |
| 2014 | 72.3 | 63.8 | 66.2 | 56.5 | 58.5 |
| 2015 | 72.3 | 62.9 | 66.0 | 57.3 | 60.4 |
| 2016 | 72.3 | 62.8 | 64.0 | 58.8 | 58.9 |
| 2017 | 76.6 | 69.4 | 69.0 | 63.4 | 63.7 |
| 2018 | 77.9 | 69.3 | 70.9 | 64.5 | 65.2 |
| 2019 | 78.1 | 71.8 | 71.6 | 65.6 | 64.6 |
| 2020 | 80.4 | 70.2 | 72.3 | 65.3 | 68.0 |
| 2021 | 78.7 | 72.9 | 70.3 | 69.2 | 67.9 |
| Year | Computer and information sciences | Geosciences, atmospheric sciences, and ocean sciences | Mathematics and statistics | Physical sciences | Engineering |
|---|---|---|---|---|---|
| 2001 | 75.1 | 75.5 | 75.4 | 77.4 | 72.5 |
| 2002 | 73.7 | 73.8 | 78.2 | 76.7 | 69.6 |
| 2003 | 72.8 | 74.9 | 74.7 | 73.2 | 64.6 |
| 2004 | 70.2 | 70.8 | 75.0 | 70.8 | 63.6 |
| 2005 | 72.9 | 75.0 | 76.1 | 71.1 | 64.6 |
| 2006 | 72.6 | 73.7 | 75.9 | 71.7 | 66.0 |
| 2007 | 72.7 | 76.5 | 73.3 | 70.9 | 64.7 |
| 2008 | 69.8 | 75.9 | 72.3 | 70.3 | 65.1 |
| 2009 | 72.8 | 75.5 | 71.4 | 71.4 | 66.8 |
| 2010 | 71.4 | 74.8 | 71.6 | 71.4 | 65.4 |
| 2011 | 69.0 | 75.1 | 70.7 | 67.8 | 64.1 |
| 2012 | 71.5 | 71.2 | 68.8 | 66.0 | 64.0 |
| 2013 | 68.7 | 67.6 | 68.5 | 63.2 | 59.5 |
| 2014 | 66.4 | 67.6 | 67.2 | 60.2 | 57.2 |
| 2015 | 69.8 | 69.2 | 69.7 | 59.3 | 58.2 |
| 2016 | 67.4 | 65.5 | 67.4 | 61.1 | 58.6 |
| 2017 | 74.3 | 68.6 | 70.9 | 64.8 | 64.1 |
| 2018 | 75.5 | 67.0 | 74.7 | 67.0 | 65.5 |
| 2019 | 77.2 | 68.6 | 75.3 | 67.2 | 67.0 |
| 2020 | 78.2 | 72.7 | 74.3 | 69.0 | 68.4 |
| 2021 | 78.3 | 73.2 | 72.1 | 70.7 | 67.8 |
S&E = science and engineering.
Note(s):
Shaded areas in the graphic reflect recessions that occurred between March 2001 and November 2001 and between December 2007 and June 2009 (http://www.nber.org/cycles/cyclesmain.html). Definite commitment refers to a doctorate recipient who is either returning to predoctoral employment or has signed a contract (or otherwise made a definite commitment) for employment or postdoctoral study in the coming year. Percentages are based on the number of doctorate recipients who responded to the postgraduation status item.
Source(s):
National Center for Science and Engineering Statistics, Survey of Earned Doctorates, 2021. Related detailed table 2-1.
Definite commitments among doctorate recipients, by non-S&E broad field: 2001–21
| Year | Education | Humanities and arts | Business | Other non-S&E fields |
|---|---|---|---|---|
| 2001 | 74.3 | 65.9 | 83.8 | 72.9 |
| 2002 | 75.1 | 64.9 | 83.3 | 73.2 |
| 2003 | 75.7 | 64.2 | 83.3 | 72.3 |
| 2004 | 74.6 | 63.6 | 81.1 | 72.0 |
| 2005 | 73.9 | 64.5 | 81.9 | 70.2 |
| 2006 | 74.9 | 66.7 | 83.0 | 72.6 |
| 2007 | 71.6 | 62.8 | 77.9 | 68.2 |
| 2008 | 73.7 | 64.6 | 81.7 | 72.5 |
| 2009 | 71.6 | 63.2 | 80.3 | 72.6 |
| 2010 | 70.7 | 60.1 | 79.4 | 68.4 |
| 2011 | 68.1 | 57.3 | 77.6 | 65.6 |
| 2012 | 69.3 | 58.5 | 81.7 | 65.3 |
| 2013 | 65.8 | 55.0 | 76.3 | 65.7 |
| 2014 | 64.5 | 54.6 | 75.7 | 61.5 |
| 2015 | 64.5 | 54.8 | 77.7 | 63.7 |
| 2016 | 64.8 | 52.1 | 75.8 | 62.0 |
| 2017 | 69.5 | 57.2 | 80.8 | 67.7 |
| 2018 | 71.0 | 59.1 | 82.6 | 70.6 |
| 2019 | 72.7 | 58.5 | 82.0 | 70.0 |
| 2020 | 72.6 | 59.5 | 83.3 | 71.4 |
| 2021 | 71.1 | 59.0 | 78.7 | 65.1 |
S&E = science and engineering.
Note(s):
Shaded areas in the graphic reflect recessions that occurred between March 2001 and November 2001 and between December 2007 and June 2009 (http://www.nber.org/cycles/cyclesmain.html). Definite commitment refers to a doctorate recipient who is either returning to predoctoral employment or has signed a contract (or otherwise made a definite commitment) for employment or postdoctoral study in the coming year. Percentages are based on the number of doctorate recipients who responded to the postgraduation status item.
Source(s):
National Center for Science and Engineering Statistics, Survey of Earned Doctorates, 2021. Related detailed table 2-1
First postgraduate position
Academic employment
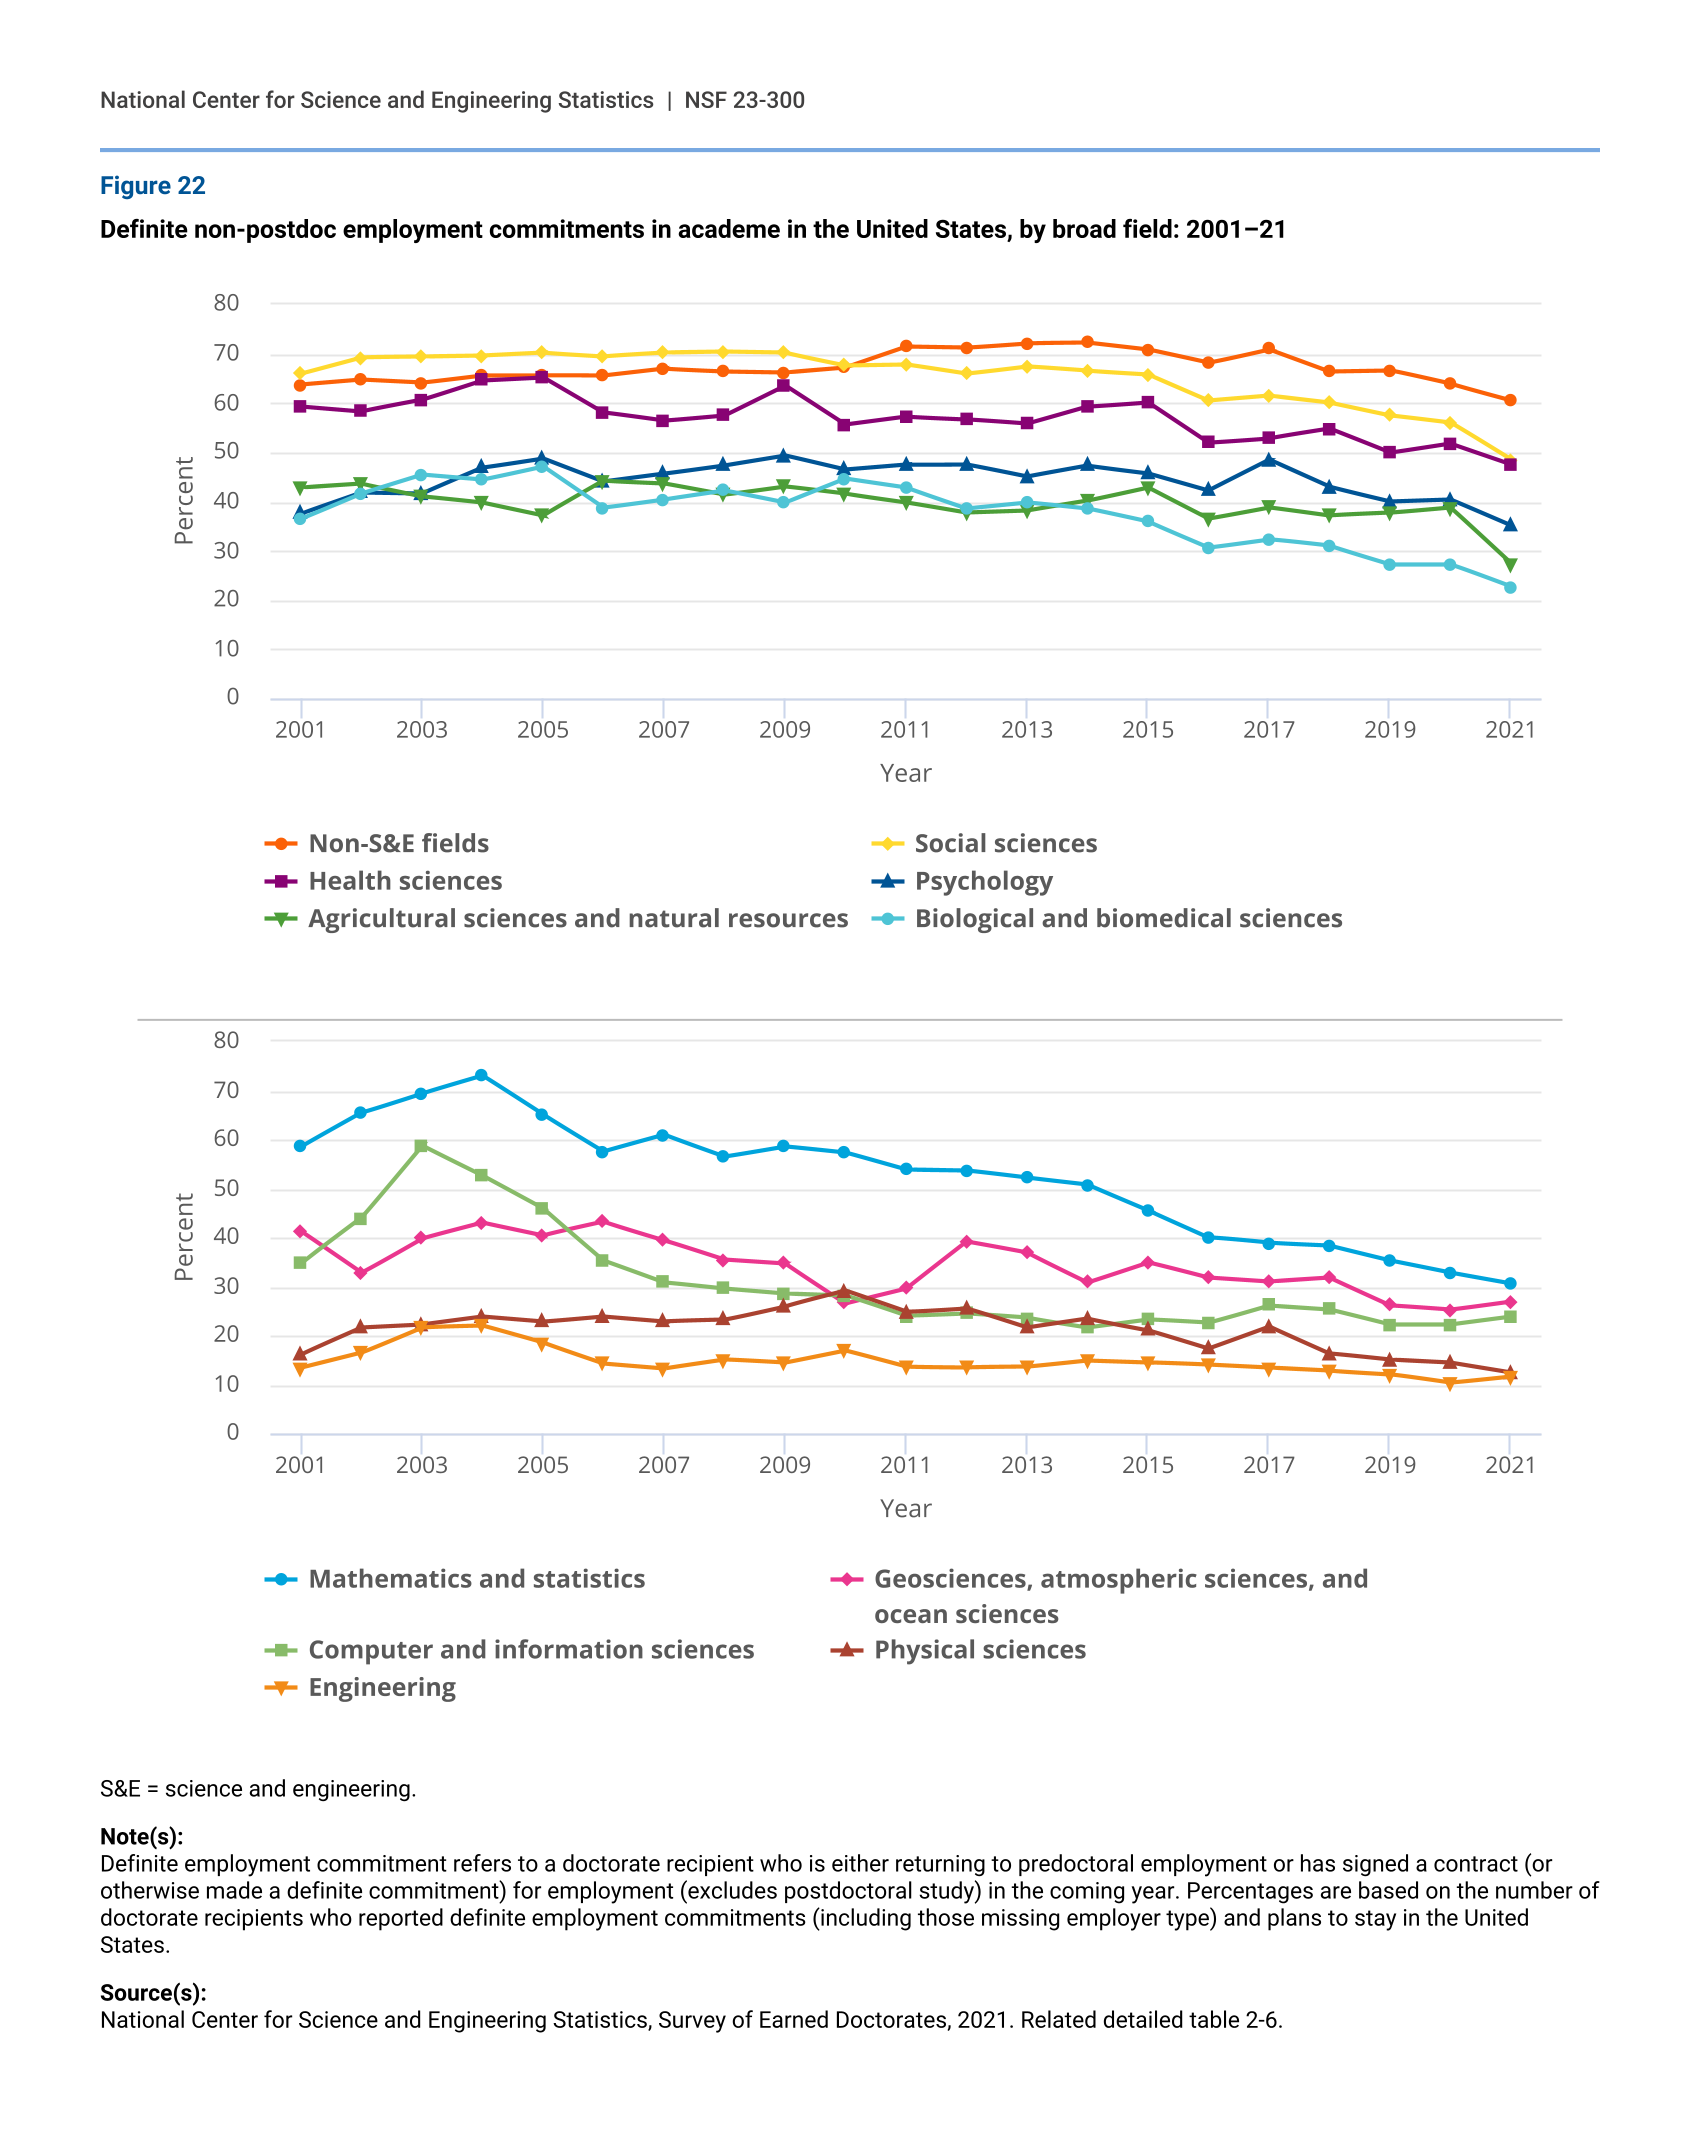
In 2021, 36% of doctorate recipients with definite non-postdoc employment commitments in the United States reported that their principal job would be in academe, down from 48% in 2001.
The highest rates of non-postdoc academic employment commitments in 2021 were reported by doctorate recipients in non-S&E fields, particularly by those in humanities and arts and in other non-S&E fields (65% and 68%, respectively). The lowest rates were in engineering (12%) and in physical sciences (12%) (figure 22).
In the past 20 years, the rate of non-postdoc academic employment commitments declined in all S&E fields. The largest decline was in mathematics and statistics, from 59% in 2001 to 31% in 2021. Between 2019 and 2021, the rate of commitments for employment in academe declined in all S&E fields except in computer and information sciences (2 percentage-point increase) and in geosciences, atmospheric sciences, and ocean sciences (1 percentage-point increase). The largest declines in this period were in agricultural sciences and natural resources (10 percentage-point decline) and social sciences (9 percentage-point decline).
Definite non-postdoc employment commitments in academe in the United States, by broad field: 2001–21
| Year | Non-S&E fields | Social sciences | Health sciences | Psychology | Agricultural sciences and natural resources | Biological and biomedical sciences |
|---|---|---|---|---|---|---|
| 2001 | 63.7 | 65.9 | 59.3 | 37.5 | 42.7 | 36.4 |
| 2002 | 64.7 | 69.2 | 58.3 | 41.8 | 43.5 | 41.6 |
| 2003 | 64.1 | 69.3 | 60.6 | 41.6 | 41.0 | 45.4 |
| 2004 | 65.6 | 69.5 | 64.6 | 46.8 | 39.7 | 44.4 |
| 2005 | 65.6 | 70.1 | 65.2 | 48.7 | 37.1 | 47.1 |
| 2006 | 65.5 | 69.4 | 58.0 | 44.0 | 44.1 | 38.7 |
| 2007 | 66.9 | 70.1 | 56.3 | 45.6 | 43.6 | 40.4 |
| 2008 | 66.4 | 70.3 | 57.4 | 47.3 | 41.3 | 42.2 |
| 2009 | 66.2 | 70.1 | 63.5 | 49.3 | 43.0 | 39.7 |
| 2010 | 67.2 | 67.6 | 55.5 | 46.4 | 41.5 | 44.6 |
| 2011 | 71.4 | 67.8 | 57.1 | 47.4 | 39.8 | 42.8 |
| 2012 | 71.2 | 65.9 | 56.6 | 47.5 | 37.7 | 38.6 |
| 2013 | 72.1 | 67.4 | 55.7 | 45.0 | 38.1 | 39.8 |
| 2014 | 72.2 | 66.5 | 59.2 | 47.2 | 40.1 | 38.5 |
| 2015 | 70.8 | 65.8 | 60.1 | 45.7 | 42.8 | 35.8 |
| 2016 | 68.1 | 60.5 | 51.9 | 42.2 | 36.5 | 30.6 |
| 2017 | 70.9 | 61.5 | 52.8 | 48.4 | 38.8 | 32.3 |
| 2018 | 66.4 | 60.1 | 54.7 | 42.9 | 37.1 | 30.9 |
| 2019 | 66.6 | 57.5 | 49.8 | 40.0 | 37.6 | 27.2 |
| 2020 | 63.8 | 56.0 | 51.7 | 40.4 | 38.7 | 27.2 |
| 2021 | 60.5 | 48.4 | 47.5 | 35.1 | 27.3 | 22.6 |
| Year | Mathematics and statistics | Geosciences, atmospheric sciences, and ocean sciences | Computer and information sciences | Physical sciences | Engineering |
|---|---|---|---|---|---|
| 2001 | 58.6 | 41.3 | 34.8 | 16.2 | 13.4 |
| 2002 | 65.5 | 32.8 | 44.0 | 21.6 | 16.5 |
| 2003 | 69.5 | 39.9 | 58.8 | 22.2 | 21.7 |
| 2004 | 73.1 | 43.1 | 52.7 | 23.8 | 22.0 |
| 2005 | 65.1 | 40.5 | 46.0 | 22.8 | 18.5 |
| 2006 | 57.6 | 43.2 | 35.4 | 23.9 | 14.3 |
| 2007 | 61.0 | 39.5 | 30.9 | 22.9 | 13.3 |
| 2008 | 56.6 | 35.5 | 29.6 | 23.2 | 15.1 |
| 2009 | 58.7 | 34.7 | 28.6 | 26.0 | 14.4 |
| 2010 | 57.4 | 26.6 | 28.2 | 29.1 | 16.9 |
| 2011 | 53.9 | 29.6 | 24.0 | 24.8 | 13.6 |
| 2012 | 53.7 | 39.2 | 24.5 | 25.6 | 13.5 |
| 2013 | 52.2 | 36.9 | 23.6 | 21.6 | 13.6 |
| 2014 | 50.8 | 30.9 | 21.7 | 23.4 | 14.9 |
| 2015 | 45.6 | 35.0 | 23.3 | 21.1 | 14.5 |
| 2016 | 40.1 | 31.8 | 22.6 | 17.3 | 14.0 |
| 2017 | 38.9 | 31.0 | 26.2 | 21.8 | 13.4 |
| 2018 | 38.4 | 31.8 | 25.4 | 16.3 | 12.8 |
| 2019 | 35.4 | 26.2 | 22.3 | 15.0 | 12.1 |
| 2020 | 32.9 | 25.3 | 22.3 | 14.4 | 10.3 |
| 2021 | 30.7 | 27.0 | 23.9 | 12.4 | 11.6 |
S&E = science and engineering.
Note(s):
Definite employment commitment refers to a doctorate recipient who is either returning to predoctoral employment or has signed a contract (or otherwise made a definite commitment) for employment (excludes postdoctoral study) in the coming year. Percentages are based on the number of doctorate recipients who reported definite employment commitments (including those missing employer type) and plans to stay in the United States.
Source(s):
National Center for Science and Engineering Statistics, Survey of Earned Doctorates, 2021. Related detailed table 2-6.
Postdoc positions
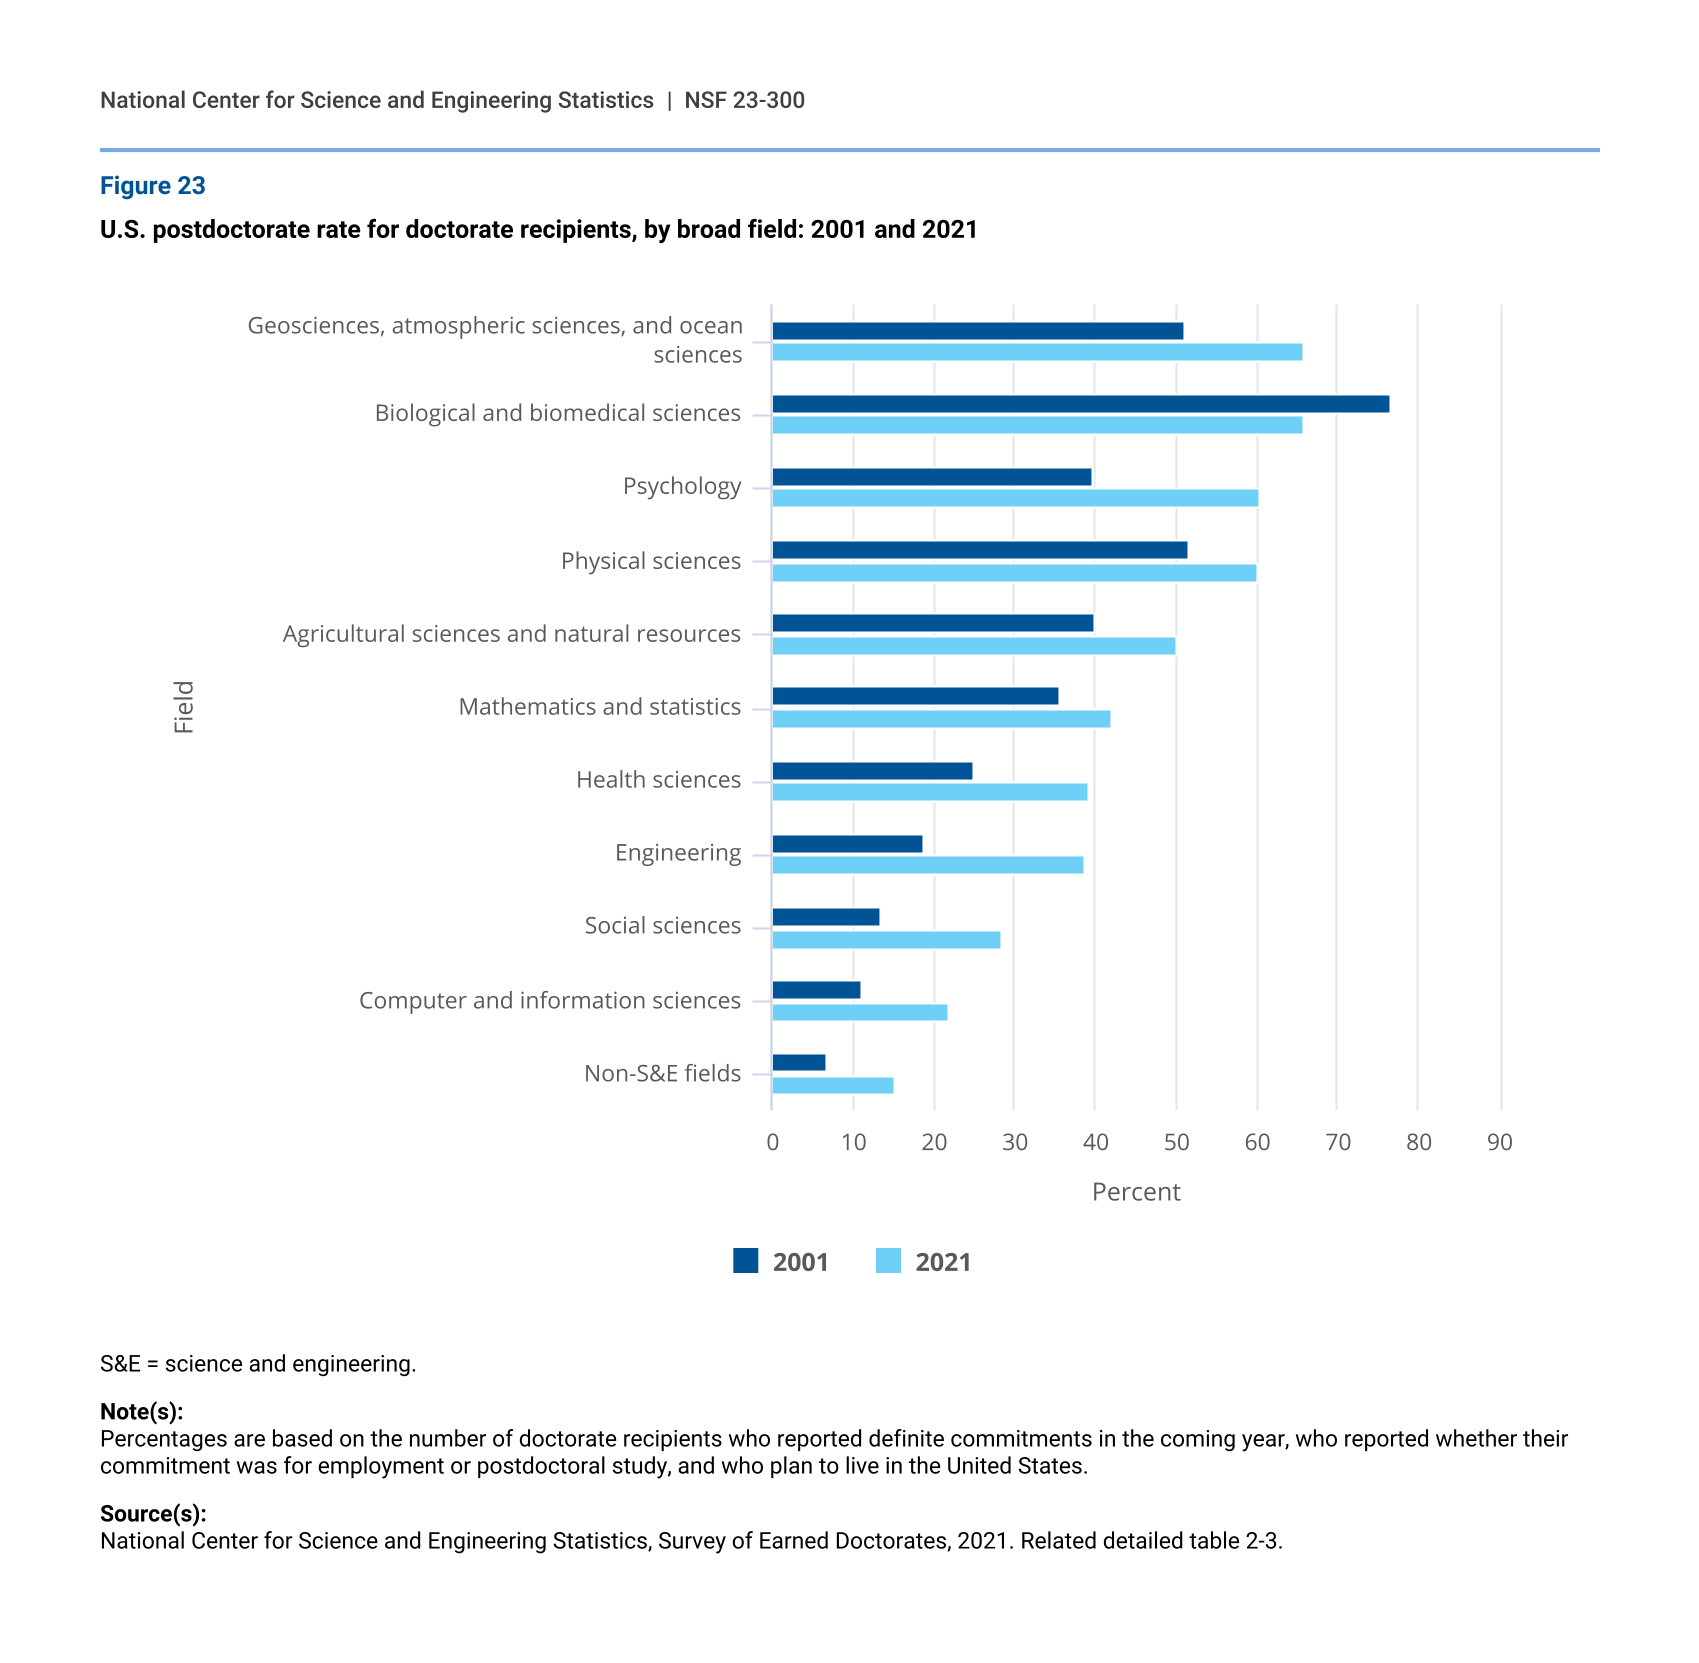
Historically, postdoc positions have been a customary part of the early career paths of doctorate recipients in biological and biomedical sciences; physical sciences; and geosciences, atmospheric sciences, and ocean sciences, making up over half of definite commitments. Since 2001, the postdoc rate in psychology increased and reached 60% in 2021, and agricultural sciences and natural resources postdoc rates also reached 50% in 2021. In the past 20 years, postdoc rates have also increased in mathematics and statistics, health sciences, engineering, social sciences, computer and information sciences, and non-S&E fields, though rates in these fields are not as high (figure 23).
U.S. postdoctorate rate for doctorate recipients, by broad field: 2001 and 2021
| Field | 2001 | 2021 |
|---|---|---|
| Geosciences, atmospheric sciences, and ocean sciences | 51.1 | 65.8 |
| Biological and biomedical sciences | 76.5 | 65.7 |
| Psychology | 39.8 | 60.4 |
| Physical sciences | 51.7 | 60.0 |
| Agricultural sciences and natural resources | 40.0 | 49.9 |
| Mathematics and statistics | 35.7 | 42.0 |
| Health sciences | 25.1 | 39.2 |
| Engineering | 18.8 | 38.6 |
| Social sciences | 13.4 | 28.4 |
| Computer and information sciences | 11.2 | 22.0 |
| Non-S&E fields | 6.8 | 15.3 |
S&E = science and engineering.
Note(s):
Percentages are based on the number of doctorate recipients who reported definite commitments in the coming year, who reported whether their commitment was for employment or postdoctoral study, and who plan to live in the United States.
Source(s):
National Center for Science and Engineering Statistics, Survey of Earned Doctorates, 2021. Related detailed table 2-3.
Between 2019 (before the pandemic started) and 2021, postdoc rates increased in all fields of study except biological and biomedical sciences, where it declined by 2 percentage points (table C). The largest increase was in geosciences, atmospheric sciences, and ocean sciences (7 percentage points).
U.S. postdoc rate for doctorate recipients, by broad field: 2019–21
S&E = science and engineering.
Note(s):
Percentages are based on the number of doctorate recipients who reported definite commitments in the coming year, who reported whether their commitment was for employment or postdoctoral study, and who plan to live in the United States.
Source(s):
National Center for Science and Engineering Statistics, Survey of Earned Doctorates, 2021. Related detailed table 2-3.
Median salaries
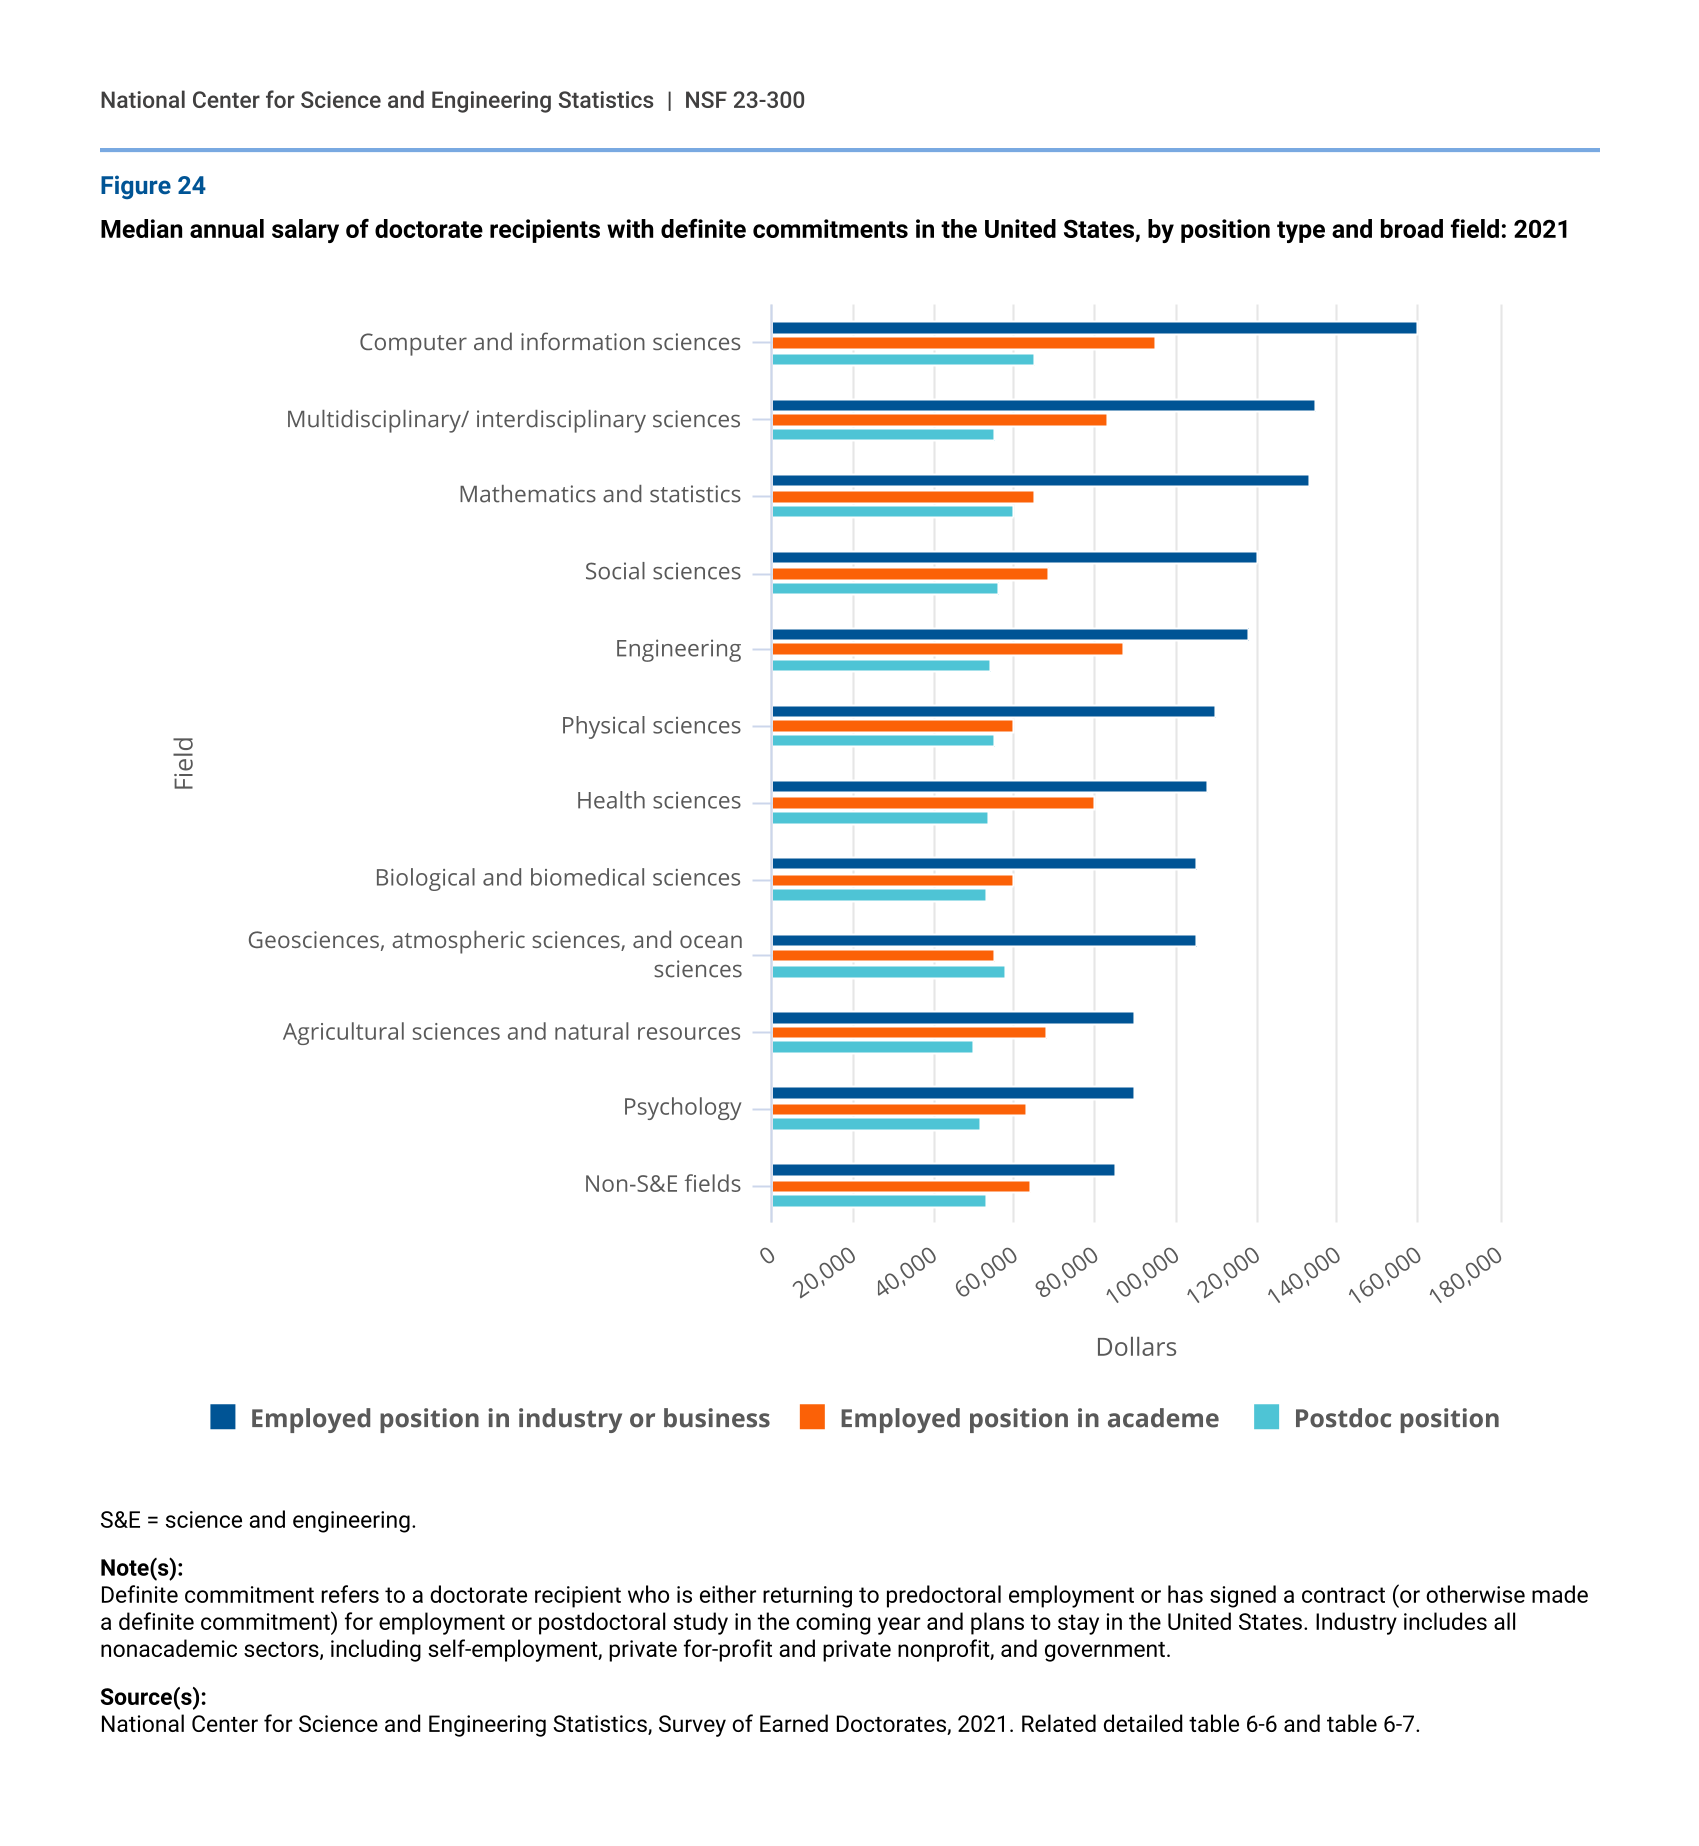
In 2021, doctorate recipients who had definite commitments for employment or a postdoc in the United States in the coming year reported basic annual salaries that varied by their doctorate field and the type of position to which they committed.
In every field, median expected salaries for doctorate recipients committing to jobs in industry and other nonacademic sectors were higher than those in postdocs and academe (figure 24). The median salaries for postdocs in most broad fields were relatively similar, ranging from $50,000 to $55,000. Postdocs in mathematics and statistics and in computer and information sciences were the exception, with respective median salaries of $60,000 and $65,000. Doctorate recipients in computer and information sciences reported the highest median academic salaries ($95,000) and also the highest median salaries in industry positions ($160,000).
Median annual salary of doctorate recipients with definite commitments in the United States, by position type and broad field: 2021
| Field | Employed position in industry or business | Employed position in academe | Postdoc position |
|---|---|---|---|
| Computer and information sciences | 160,000 | 95,000 | 65,000 |
| Multidisciplinary/ interdisciplinary sciences | 134,500 | 83,000 | 55,000 |
| Mathematics and statistics | 133,000 | 65,000 | 60,000 |
| Social sciences | 120,000 | 68,500 | 56,000 |
| Engineering | 118,000 | 87,000 | 54,000 |
| Physical sciences | 110,000 | 60,000 | 55,000 |
| Health sciences | 108,000 | 80,000 | 53,760 |
| Biological and biomedical sciences | 105,250 | 60,000 | 53,000 |
| Geosciences, atmospheric sciences, and ocean sciences | 105,000 | 55,000 | 58,000 |
| Agricultural sciences and natural resources | 90,000 | 68,000 | 50,000 |
| Psychology | 90,000 | 63,000 | 51,500 |
| Non-S&E fields | 85,000 | 64,000 | 53,000 |
S&E = science and engineering.
Note(s):
Definite commitment refers to a doctorate recipient who is either returning to predoctoral employment or has signed a contract (or otherwise made a definite commitment) for employment or postdoctoral study in the coming year and plans to stay in the United States. Industry includes all nonacademic sectors, including self-employment, private for-profit and private nonprofit, and government.
Temporary visa holders and postgraduation
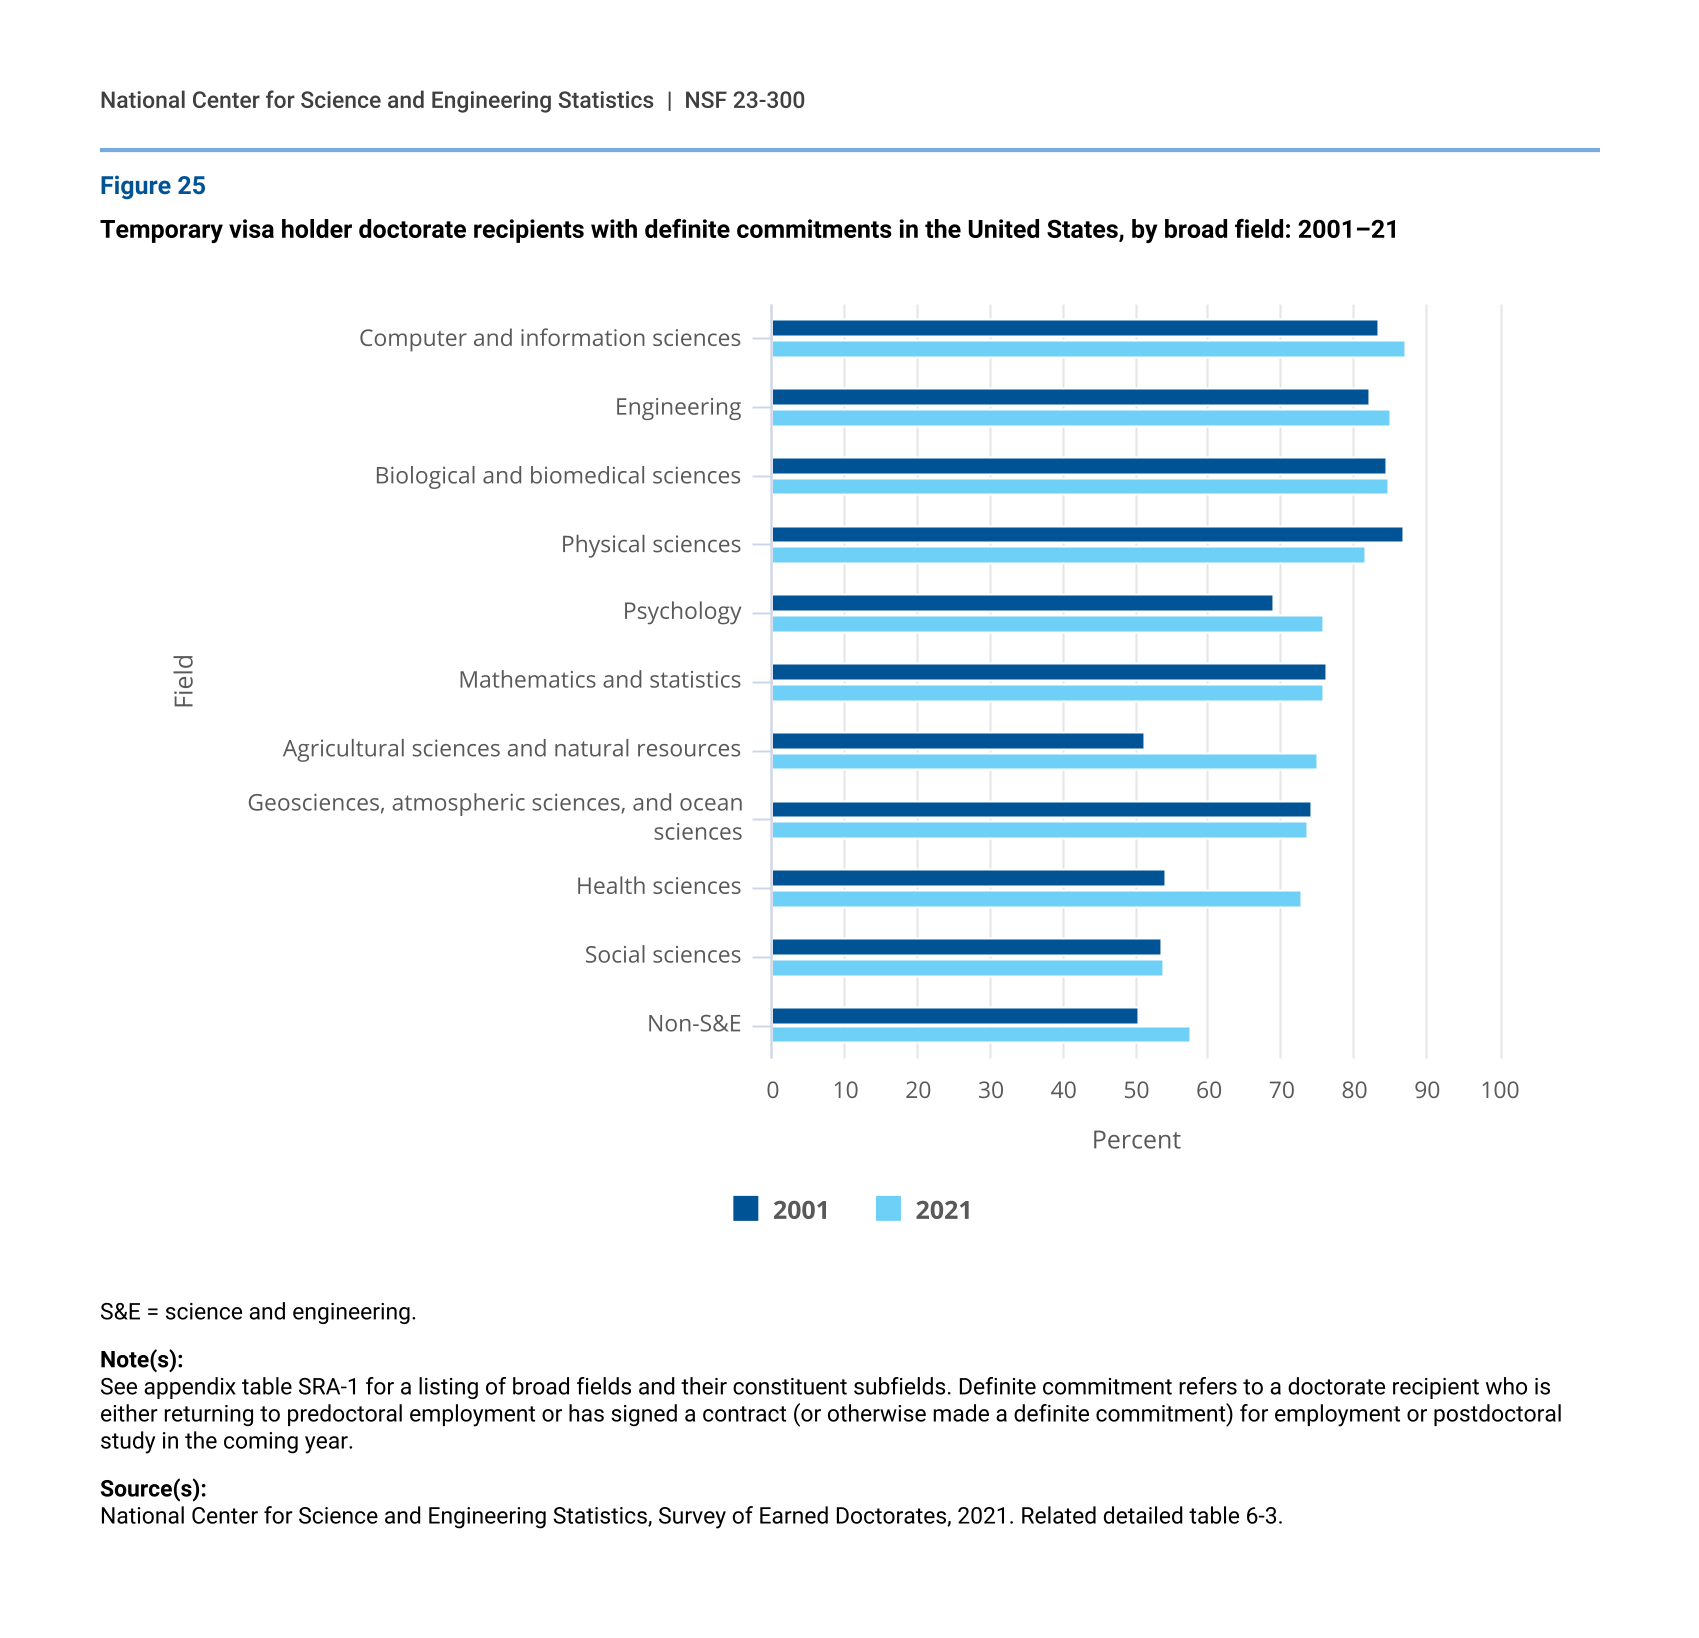
In 2021, 80% of S&E temporary visa holder doctorate recipients with definite commitments reported that the location of their postdoc or employment position was in the United States, up from 76% in 2001. Expected stay rates were highest (above 80%) in computer and information sciences, engineering, biological and biomedical sciences, and physical sciences and lowest in social sciences and non-S&E fields (54% and 58%, respectively). Between 2001 and 2021, expected stay rates increased the most in agricultural sciences and natural resources and in health sciences (figure 25).
Temporary visa holder doctorate recipients with definite commitments in the United States, by broad field: 2001–21
| Field | 2001 | 2021 |
|---|---|---|
| Computer and information sciences | 83.3 | 87.2 |
| Engineering | 82.2 | 85.2 |
| Biological and biomedical sciences | 84.6 | 84.7 |
| Physical sciences | 86.7 | 81.6 |
| Psychology | 69.0 | 76.0 |
| Mathematics and statistics | 76.3 | 75.9 |
| Agricultural sciences and natural resources | 51.4 | 75.2 |
| Geosciences, atmospheric sciences, and ocean sciences | 74.3 | 73.7 |
| Health sciences | 54.2 | 72.9 |
| Social sciences | 53.6 | 54.0 |
| Non-S&E | 50.4 | 57.5 |
S&E = science and engineering.
Note(s):
See appendix table SRA-1 for a listing of broad fields and their constituent subfields. Definite commitment refers to a doctorate recipient who is either returning to predoctoral employment or has signed a contract (or otherwise made a definite commitment) for employment or postdoctoral study in the coming year.
Source(s):
National Center for Science and Engineering Statistics, Survey of Earned Doctorates, 2021. Related detailed table 6-3.
Since 2019, which was before the pandemic started, the proportion of temporary visa holder doctorate recipients with definite commitments in the United States declined by 4 percentage points in mathematics and statistics, by 3 percentage points in social sciences, and by 9 percentage points in non-S&E fields. It increased or stayed flat in all other fields.