 An official website of the United States government
Report
Field of doctorate
As researchers expand their understanding of the world, new fields of study emerge and existing fields change. Observing which fields are attracting growing proportions of students can provide early insight into where future research breakthroughs may occur.
Field of doctorate trends
S&E
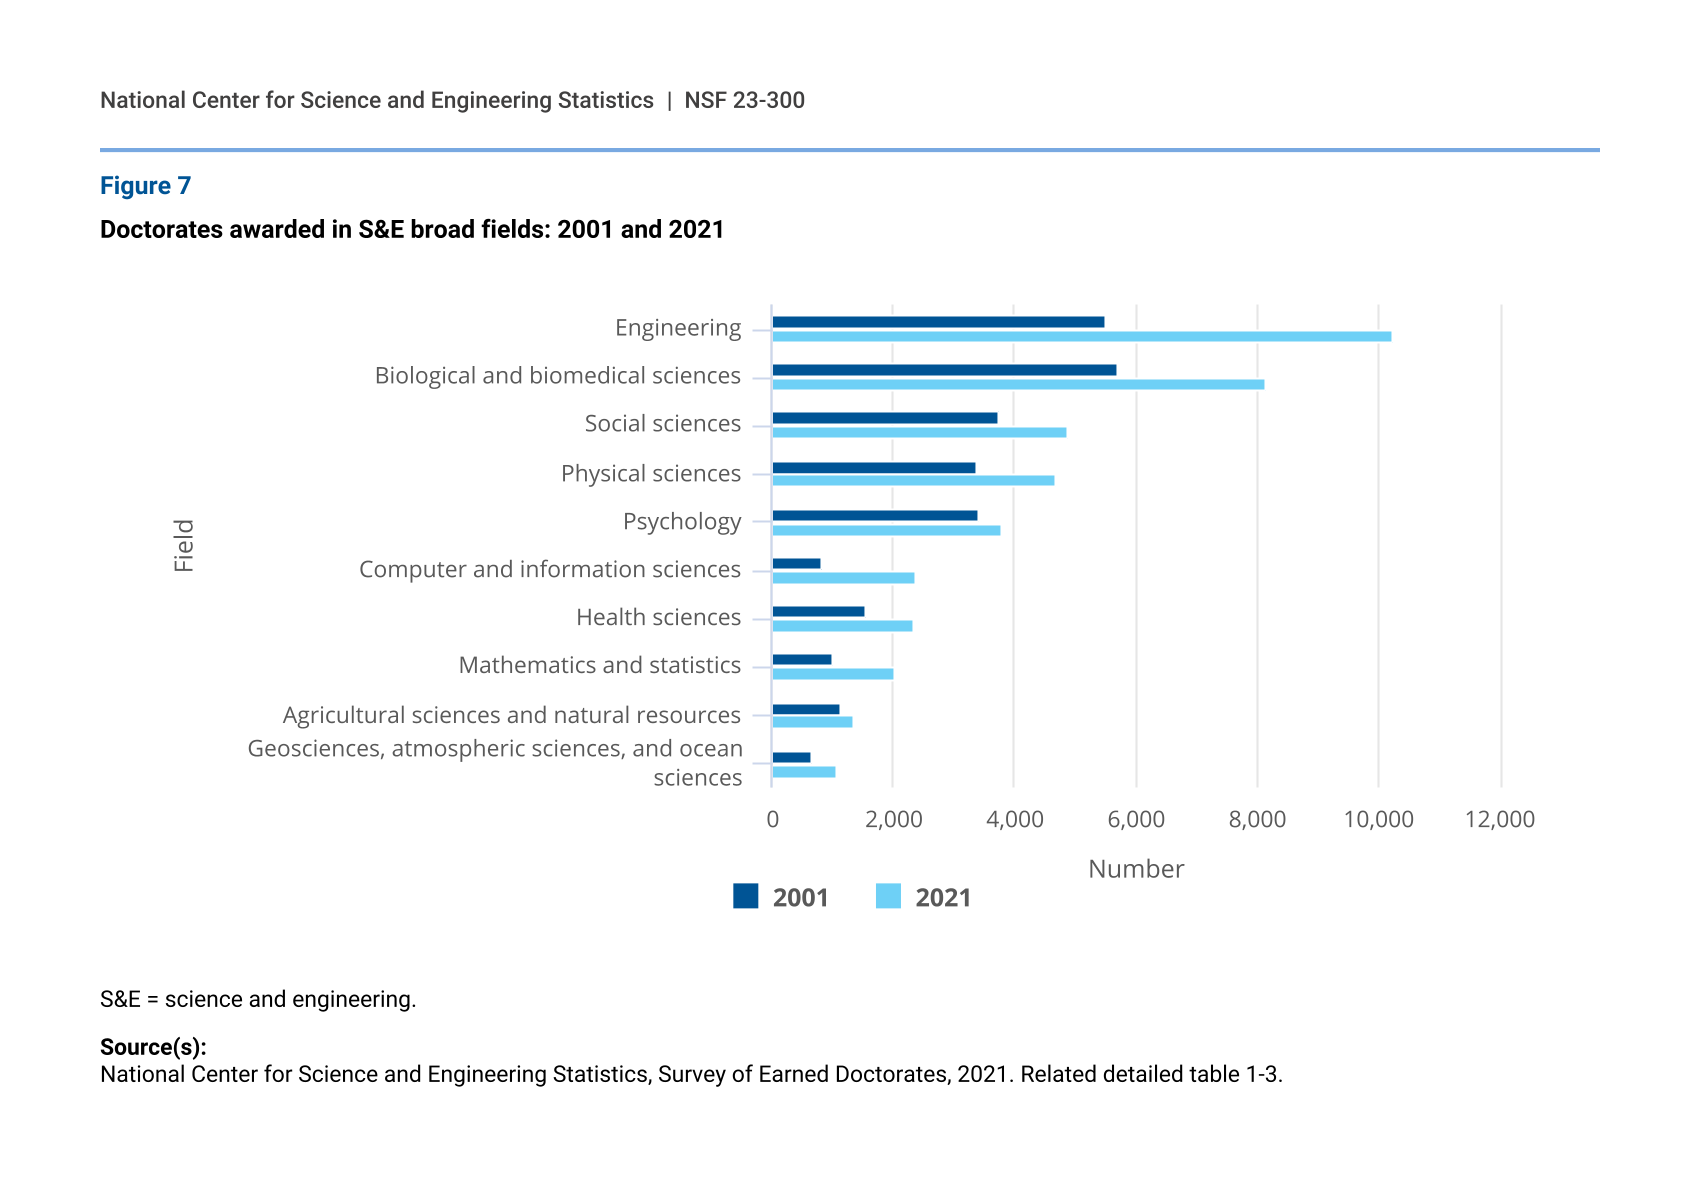
Doctorates in science and engineering (S&E) fields are a growing share of all doctorates awarded. Over the past 2 decades, every broad S&E field except psychology and agricultural sciences and natural resources increased both in number and share of all doctorates. These two fields increased in the number of doctorate recipients, but their share of all doctorates awarded declined. Among S&E fields, engineering grew the most, from 14% of all doctorates in 2001 to 20% in 2021 (figure 7).
Doctorates awarded in S&E broad fields: 2001 and 2021
| Field | 2001 | 2021 |
|---|---|---|
| Engineering | 5,512 | 10,240 |
| Biological and biomedical sciences | 5,697 | 8,149 |
| Social sciences | 3,751 | 4,878 |
| Physical sciences | 3,364 | 4,693 |
| Psychology | 3,400 | 3,797 |
| Computer and information sciences | 830 | 2,361 |
| Health sciences | 1,540 | 2,331 |
| Mathematics and statistics | 1,010 | 2,012 |
| Agricultural sciences and natural resources | 1,132 | 1,334 |
| Geosciences, atmospheric sciences, and ocean sciences | 660 | 1,064 |
S&E = science and engineering.
Source(s):
National Center for Science and Engineering Statistics, Survey of Earned Doctorates, 2021. Related detailed table 1-3.
Between 2020 and 2021, all S&E broad fields declined in the number of doctorate recipients (table A). The S&E fields with the largest declines in doctorate recipients were physical sciences (-307) and biological and biomedical sciences (-529); the S&E fields with the lowest declines were computer and information sciences (-2) and mathematics and statistics (-12).
Non-S&E
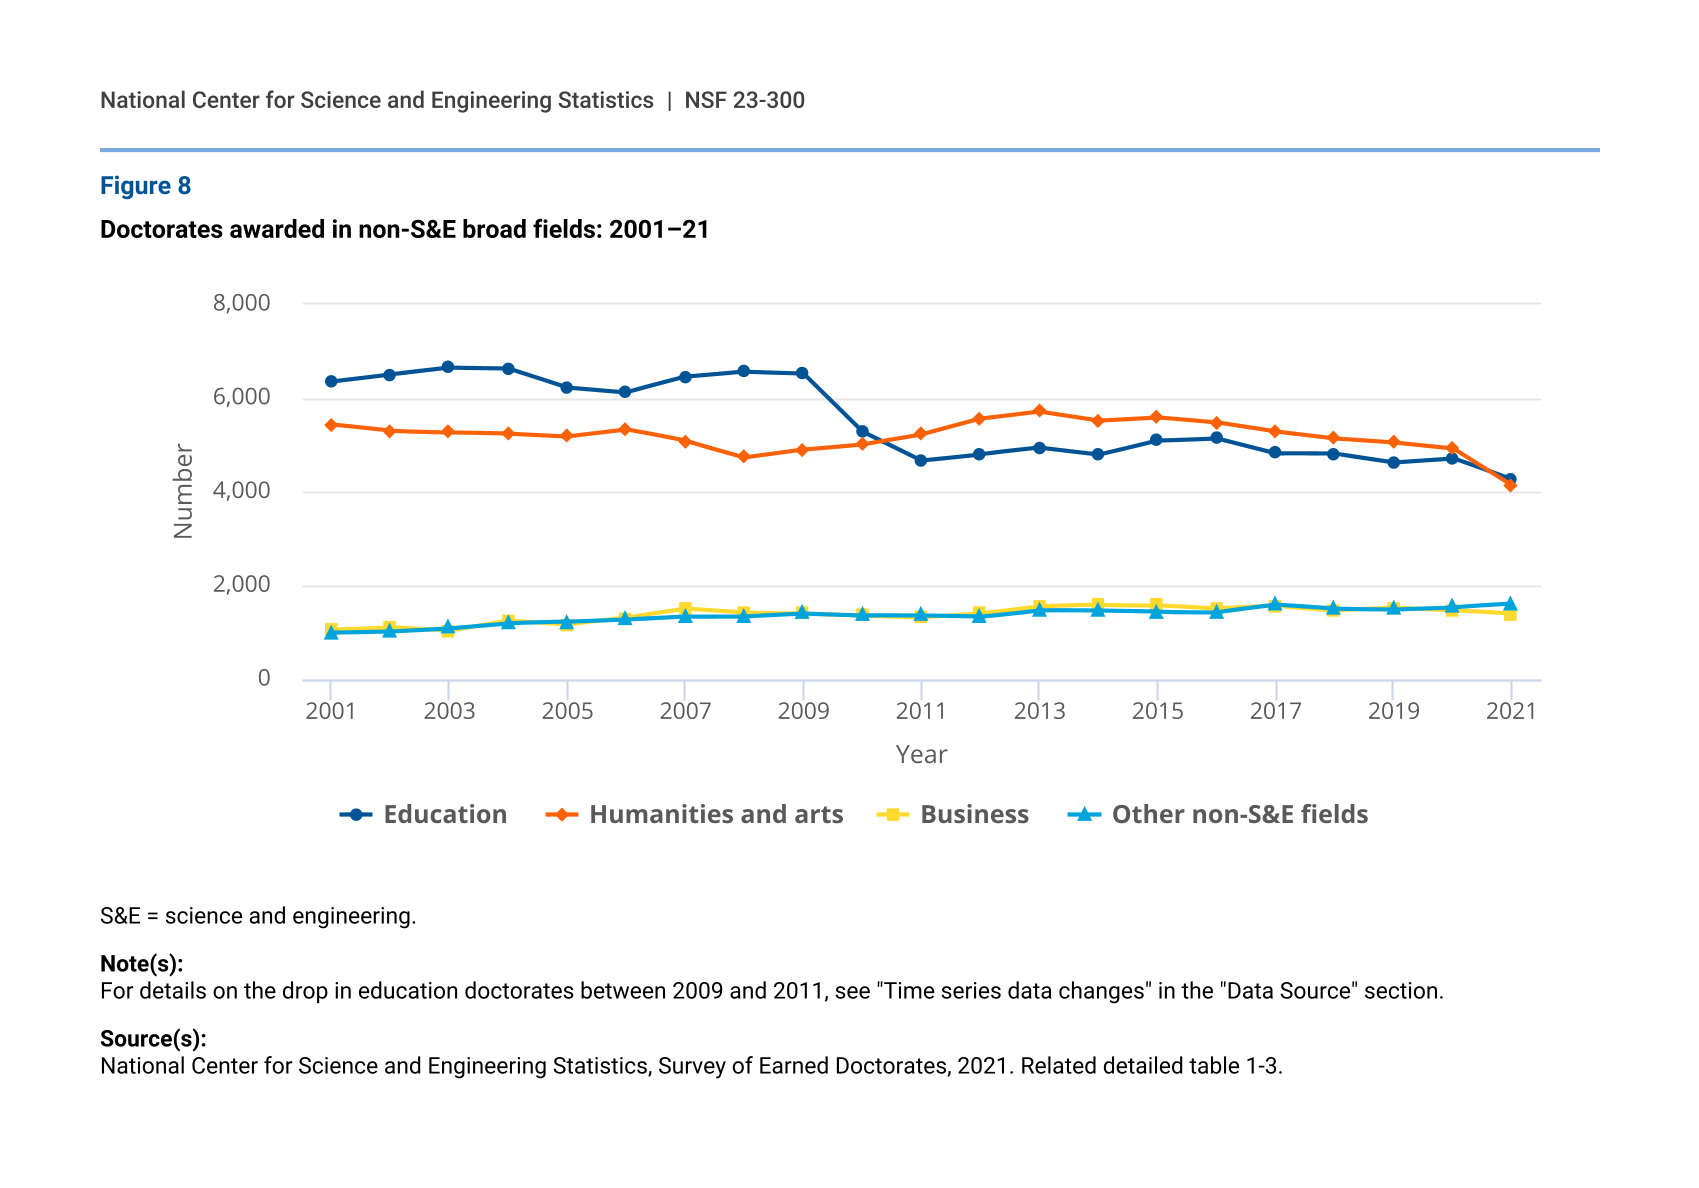
Among non-S&E broad fields, in the past 20 years the number of doctorates awarded in humanities and arts declined, while the number in business increased (figure 8). Since 2011, the number of doctorates in education declined by 418.
Doctorates awarded in non-S&E broad fields: 2001–21
| Year | Education | Humanities and arts | Business | Other non-S&E fields |
|---|---|---|---|---|
| 2001 | 6,356 | 5,430 | 1,064 | 998 |
| 2002 | 6,508 | 5,297 | 1,113 | 1,025 |
| 2003 | 6,651 | 5,272 | 1,036 | 1,090 |
| 2004 | 6,635 | 5,245 | 1,256 | 1,192 |
| 2005 | 6,227 | 5,187 | 1,171 | 1,222 |
| 2006 | 6,122 | 5,332 | 1,311 | 1,271 |
| 2007 | 6,448 | 5,085 | 1,506 | 1,335 |
| 2008 | 6,561 | 4,736 | 1,421 | 1,341 |
| 2009 | 6,528 | 4,904 | 1,405 | 1,402 |
| 2010 | 5,287 | 5,015 | 1,366 | 1,363 |
| 2011 | 4,670 | 5,225 | 1,327 | 1,356 |
| 2012 | 4,802 | 5,561 | 1,404 | 1,330 |
| 2013 | 4,934 | 5,715 | 1,551 | 1,472 |
| 2014 | 4,789 | 5,524 | 1,584 | 1,459 |
| 2015 | 5,098 | 5,594 | 1,582 | 1,437 |
| 2016 | 5,146 | 5,482 | 1,509 | 1,432 |
| 2017 | 4,826 | 5,286 | 1,565 | 1,587 |
| 2018 | 4,818 | 5,139 | 1,473 | 1,504 |
| 2019 | 4,633 | 5,051 | 1,533 | 1,494 |
| 2020 | 4,715 | 4,924 | 1,468 | 1,537 |
| 2021 | 4,252 | 4,137 | 1,392 | 1,610 |
S&E = science and engineering.
Note(s):
For details on the drop in education doctorates between 2009 and 2011, see "Time series data changes" in the "Data Source" section.
Source(s):
National Center for Science and Engineering Statistics, Survey of Earned Doctorates, 2021. Related detailed table 1-3.
Between 2020 and 2021, the number of doctorates in non-S&E broad fields declined. The largest drop was in humanities and arts (-787), followed by education (-463).
Temporary visa holders
In the past 2 decades, the number of doctorate recipients who are U.S. citizens and permanent residents increased in every broad field of study except in education and in humanities and arts. During this period, the number of doctorates awarded to temporary visa holders also increased in every broad field.
In 2021, temporary visa holders earned the majority of doctorates in computer and information sciences (65%), engineering (58%), and in mathematics and statistics (54%) (figure 9). The largest increases in the proportions of temporary visa holders since 2001 were in computer and information sciences, mathematics and statistics, and non-S&E fields.
Doctorate recipients on temporary visas, by broad fields: 2001 and 2021
| Field | 2001 | 2021 |
|---|---|---|
| Computer and information sciences | 45.5 | 64.7 |
| Engineering | 53.2 | 58.1 |
| Mathematics and statistics | 45.2 | 53.5 |
| Agricultural sciences and natural resources | 46.4 | 42.6 |
| Physical sciences | 37.2 | 40.7 |
| Social sciences | 28.9 | 33.8 |
| Geosciences, atmospheric sciences, and ocean sciences | 34.8 | 33.6 |
| Biological and biomedical sciences | 22.6 | 25.8 |
| Health sciences | 21.8 | 23.3 |
| Psychology | 4.8 | 9.7 |
| Non-S&E fields | 12.0 | 22.8 |
S&E = science and engineering.
Note(s):
Percentages are based on the number of doctorate recipients who reported citizenship.
Source(s):
National Center for Science and Engineering Statistics, Survey of Earned Doctorates, 2021. Related detailed table 1-6.
Minority U.S. citizens and permanent residents
In 2021, 67% of the 31,674 doctorate recipients who were U.S. citizens or permanent residents were White; 10% were Asian, 9% Hispanic or Latino, 8% Black or African American, and 3% identified as more than one race (table B). The remaining doctorate recipients were either American Indian or Alaska Native or Native Hawaiian or Other Pacific Islander, or they did not report their race or ethnicity.
Doctorates awarded to U.S. citizens and permanent residents, by race or ethnicity: 2021
S&E = science and engineering.
Note(s):
Percentages may not sum to 100 due to rounding.
Source(s):
National Center for Science and Engineering Statistics, Survey of Earned Doctorates, 2021. Related detailed table 1-11.
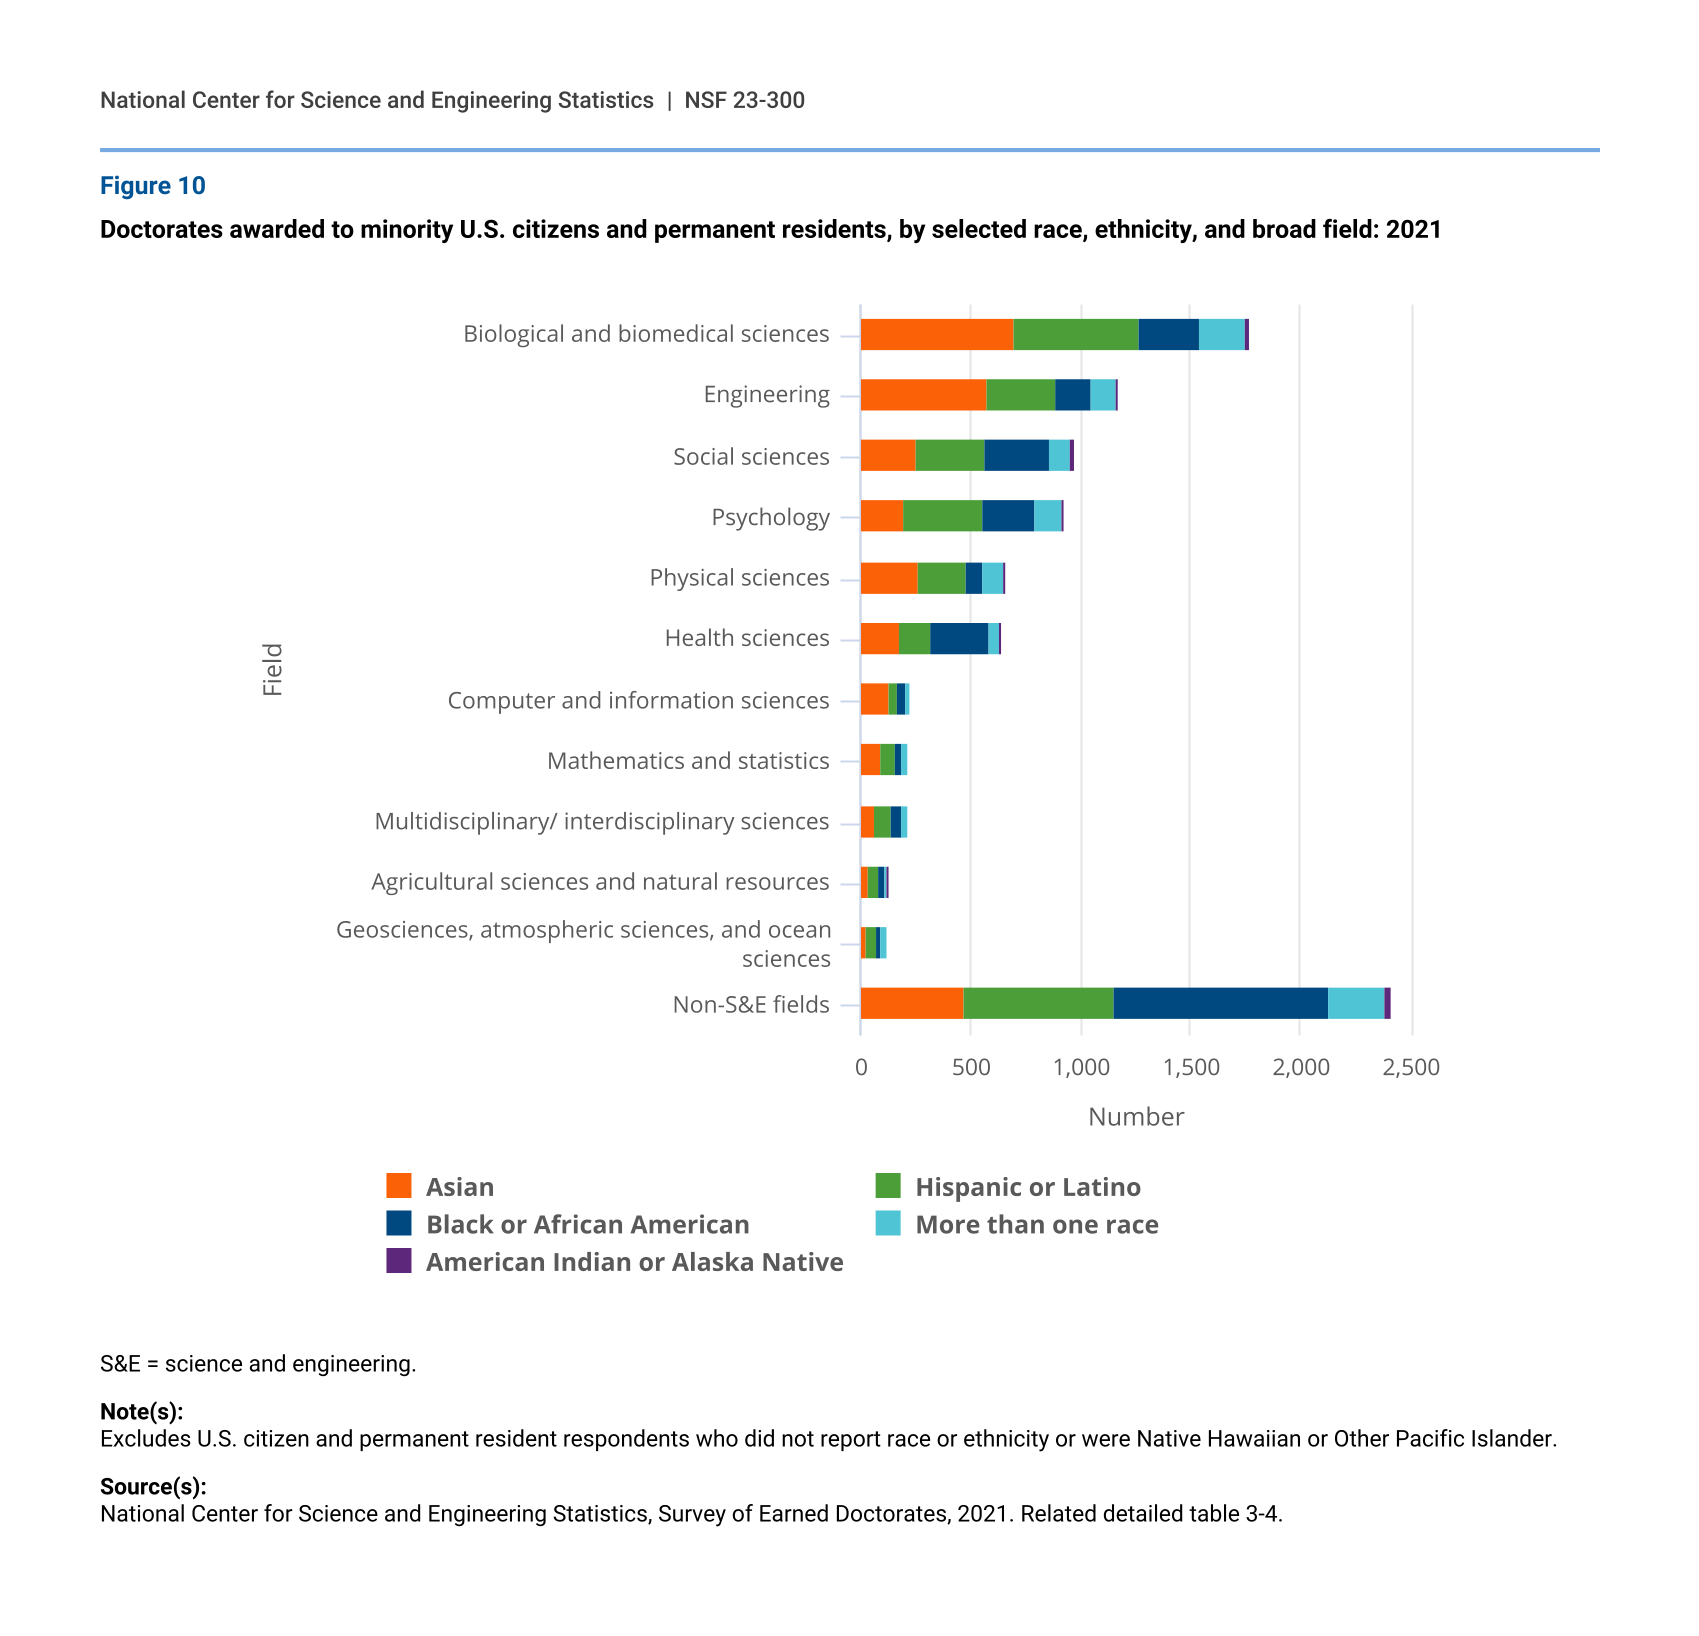
Among minority U.S. citizens and permanent residents, doctorate recipients of different racial or ethnic backgrounds are more heavily represented in some broad fields than in others. In 2021, Asians earned a larger share of doctorates than other racial and ethnic minority groups in computer and information sciences, engineering, mathematics and statistics, physical sciences, and biological and biomedical sciences. Black or African American doctorate recipients were the largest minority group in health sciences and in non-S&E fields (particularly in education), and Hispanics or Latinos were the largest minority group among doctorate recipients in psychology; social sciences; agricultural sciences and natural resources; and geosciences, atmospheric sciences, and ocean sciences (figure 10).
Doctorates awarded to minority U.S. citizens and permanent residents, by selected race, ethnicity, and broad field: 2021
| Field | Asian | Hispanic or Latino | Black or African American | More than one race | American Indian or Alaska Native |
|---|---|---|---|---|---|
| Biological and biomedical sciences | 700 | 571 | 269 | 214 | 13 |
| Engineering | 582 | 311 | 156 | 115 | 6 |
| Social sciences | 256 | 312 | 294 | 97 | 15 |
| Psychology | 195 | 360 | 243 | 125 | 9 |
| Physical sciences | 266 | 216 | 76 | 96 | 6 |
| Health sciences | 182 | 139 | 263 | 55 | 9 |
| Computer and information sciences | 136 | 32 | 36 | 27 | 0 |
| Mathematics and statistics | 96 | 65 | 28 | 33 | 0 |
| Multidisciplinary/ interdisciplinary sciences | 70 | 68 | 51 | 27 | 2 |
| Agricultural sciences and natural resources | 40 | 44 | 30 | 12 | 4 |
| Geosciences, atmospheric sciences, and ocean sciences | 30 | 48 | 13 | 33 | 2 |
| Non-S&E fields | 469 | 690 | 972 | 254 | 34 |
S&E = science and engineering.
Note(s):
Excludes U.S. citizen and permanent resident respondents who did not report race or ethnicity or were Native Hawaiian or Other Pacific Islander.
Source(s):
National Center for Science and Engineering Statistics, Survey of Earned Doctorates, 2021. Related detailed table 3-4.
Women
Overview
Women’s share of doctorates has grown over the past 2 decades in most S&E broad fields (figure 11). In 2021, women earned 49% or more of the doctorates in psychology, education, health sciences, biological and biomedical sciences, social sciences, agricultural sciences and natural resources, humanities and arts, and other non-S&E fields.
Doctorates awarded to women, by S&E broad field: 2001 and 2021
| Field | 2001 | 2021 |
|---|---|---|
| Psychology | 66.8 | 71.8 |
| Health sciences | 64.6 | 67.9 |
| Biological and biomedical sciences | 44.8 | 53.2 |
| Social sciences | 43.7 | 50.4 |
| Agricultural sciences and natural resources | 34.4 | 49.7 |
| Geosciences, atmospheric sciences, and ocean sciences | 30.0 | 44.2 |
| Physical sciences | 24.7 | 33.0 |
| Mathematics and statistics | 27.3 | 27.7 |
| Engineering | 16.9 | 25.9 |
| Computer and information sciences | 18.7 | 24.8 |
S&E = science and engineering.
Women earned between about 25% and 44% of the doctorates awarded in engineering; mathematics and statistics; computer and information sciences; physical sciences; and geosciences, atmospheric sciences, and ocean sciences in 2021. However, women’s shares of doctorates in most of these broad fields have grown over the past 20 years. From 2001 to 2021, the proportion of female doctorates grew between 8 and 15 percentage points in agricultural sciences and natural resources; geosciences, atmospheric sciences, and ocean sciences; engineering; biological and biomedical sciences; and physical sciences. In psychology, social sciences, and computer and information sciences, women’s share grew by about 5–7 percentage points each during this period.
Growing and declining S&E fields
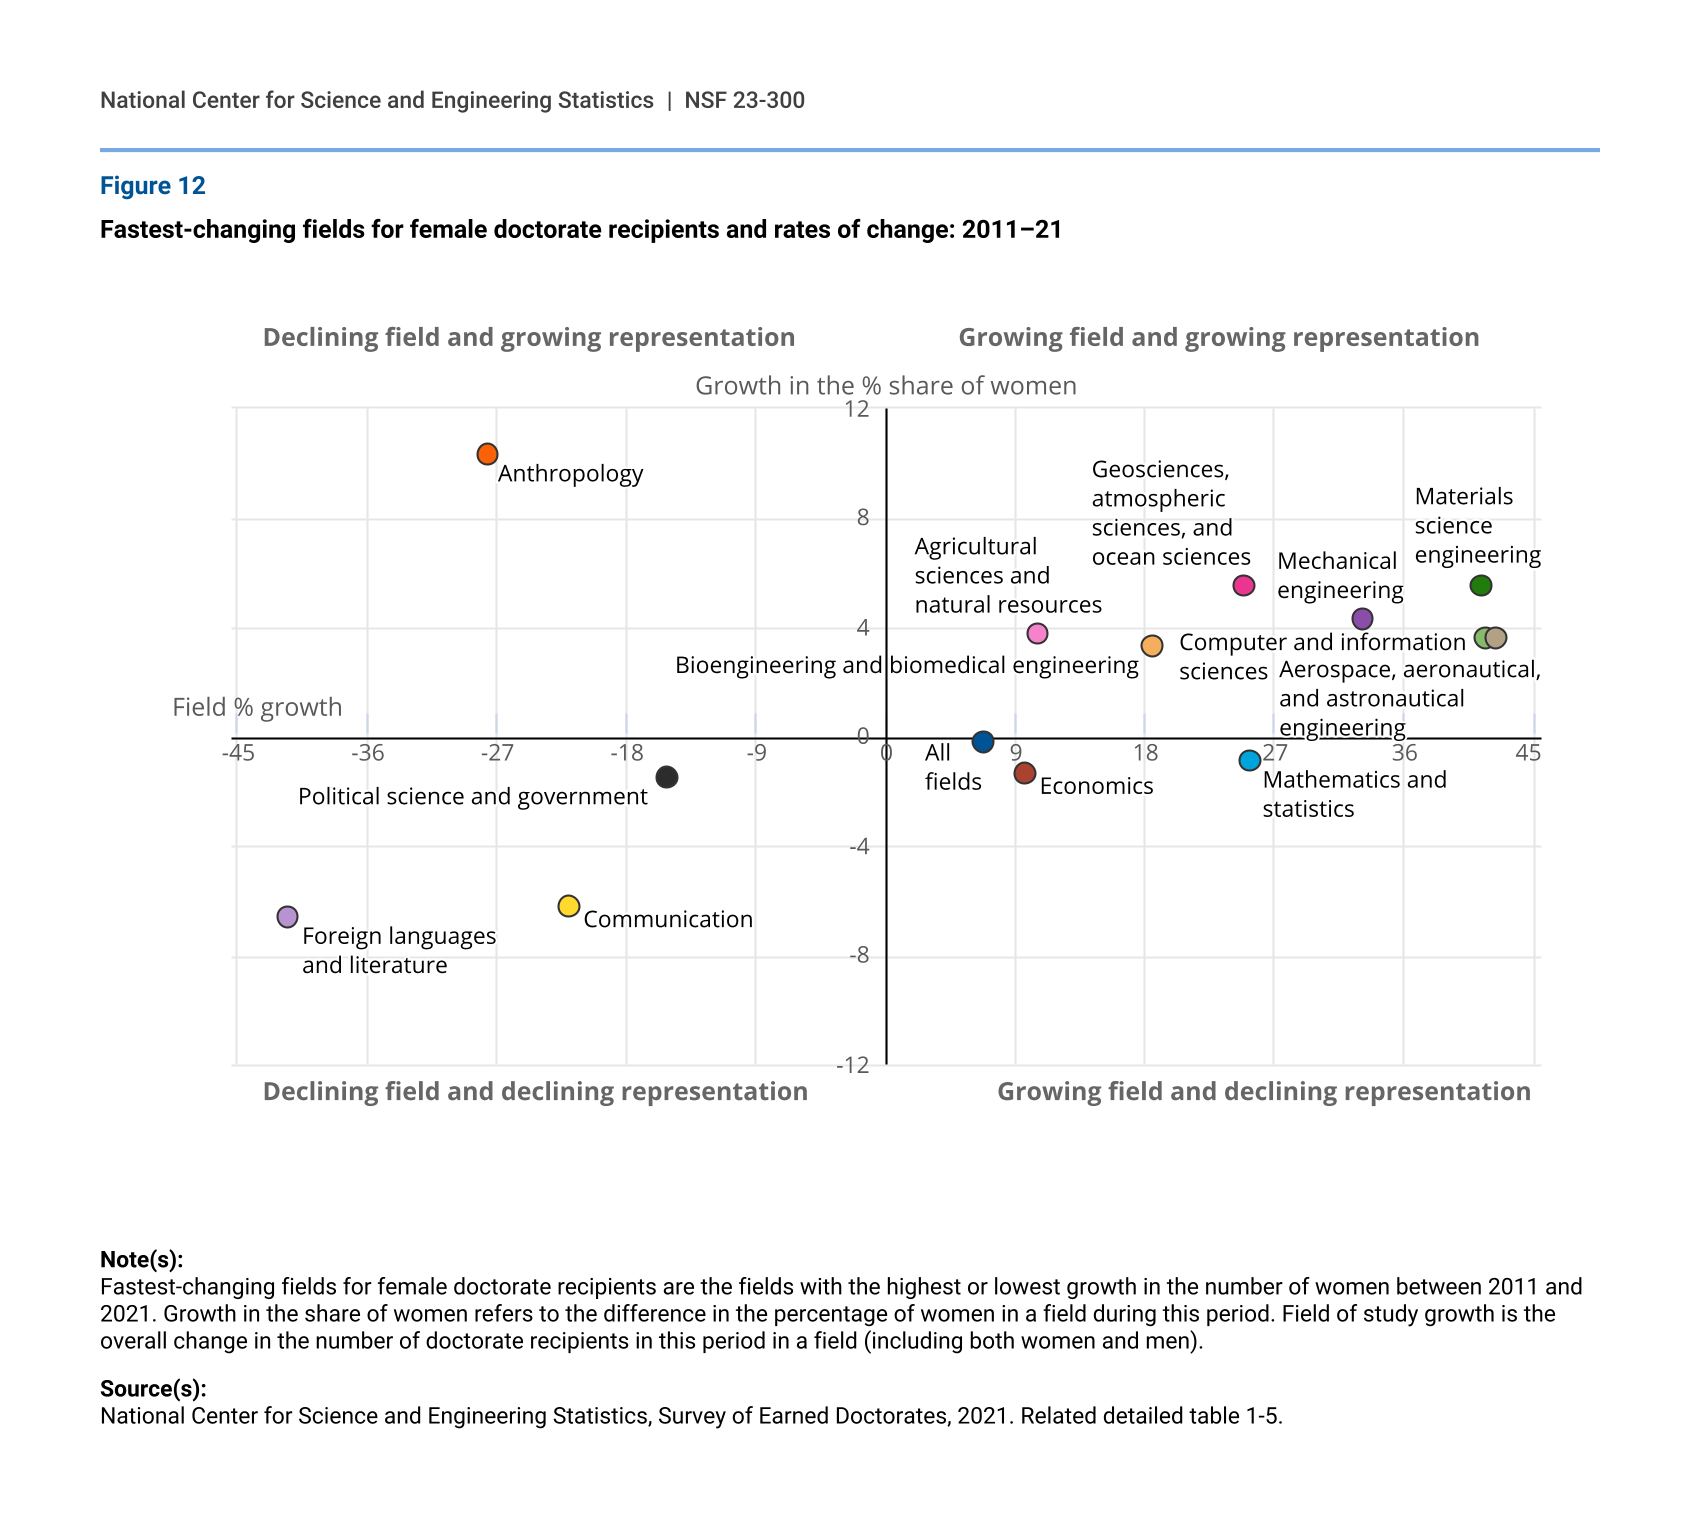
The growth or decline in the share of female doctorate recipients in different fields does not always track with the overall growth of those fields. Between 2011 and 2021, the number of doctorate recipients in all fields increased by 7% while the share of women declined by 0.2 percentage points (figure 12).
From 2011 to 2021, the proportion of female doctorate recipients increased between 3 and 6 percentage points in seven of the nine top growing fields: aerospace, aeronautical, and astronautical engineering; computer and information sciences; material science engineering; mechanical engineering; geosciences, atmospheric sciences, and ocean sciences; bioengineering and biomedical engineering; and agricultural sciences and natural resources. Women’s share of doctorates also increased 10 percentage points in anthropology, a field where the overall number of doctorates awarded declined by 28%.
Despite the growth in the number of doctorate recipients in mathematics and statistics and in economics in the past 10 years, women’s shares of doctorates in these fields declined about 1 percentage point. The proportion of female doctorate recipients also declined in communication, political science and government, and foreign languages and literature—fields in which the overall number of doctorates declined as well.
Fastest-changing fields for female doctorate recipients and rates of change: 2011–21
| Field | Growth in the % share of women | Field % growth |
|---|---|---|
| Anthropology | 10.3 | -27.7 |
| Geosciences, atmospheric sciences, and ocean sciences | 5.5 | 24.9 |
| Materials science engineering | 5.5 | 41.4 |
| Mechanical engineering | 4.3 | 33.2 |
| Agricultural sciences and natural resources | 3.8 | 10.6 |
| Computer and information sciences | 3.6 | 41.6 |
| Aerospace, aeronautical, and astronautical engineering | 3.6 | 42.4 |
| Bioengineering and biomedical engineering | 3.3 | 18.5 |
| All fields | -0.2 | 6.8 |
| Mathematics and statistics | -0.9 | 25.3 |
| Economics | -1.3 | 9.7 |
| Political science and government | -1.5 | -15.2 |
| Communication | -6.2 | -22.0 |
| Foreign languages and literature | -6.6 | -41.5 |
Note(s):
Fastest-changing fields for female doctorate recipients are the fields with the highest or lowest growth in the number of women between 2011 and 2021. Growth in the share of women refers to the difference in the percentage of women in a field during this period. Field of study growth is the overall change in the number of doctorate recipients in this period in a field (including both women and men).
Source(s):
National Center for Science and Engineering Statistics, Survey of Earned Doctorates, 2021. Related detailed table 1-5.