 An official website of the United States government
Where Are They Now? Most Early Career U.S.-Trained S&E Doctorate Recipients with Temporary Visas at Graduation Stay and Work in the United States after Graduation
Gaining a better understanding of foreign-born scientists and engineers in the United States is critical for policymakers and others. Foreign-born workers are a growing part of the U.S. S&E workforce, and in 2017, they made up nearly one-third of the 6.8 million workers with a bachelor’s degree or above working in S&E occupations (NSB/NSF 2019a). Many foreign-born S&E workers are trained in the United States; for example, temporary visa holders earned about one-third of S&E doctorate degrees awarded by U.S. institutions in 2017 (46,000) (NSB/NSF 2019b). Most (71%) of these S&E doctorate recipients remained in the United States for employment after graduation (NSB/NSF 2019a), and many (30%) become U.S. citizens or permanent residents (Finn and Pennington 2018).
This InfoBrief builds upon previous NCSES research (Chang and Milan 2012, 2014) by using data from the Survey of Earned Doctorates (SED) and the Survey of Doctorate Recipients (SDR) to analyze U.S. employment in 2017 among S&E doctorate holders who were in the early stage of their career (i.e., received their first doctorate between 2006 and 2015), received a doctorate from a U.S. academic institution, and held temporary visas at graduation. Nearly three-quarters (72%) of these S&E doctorate recipients with temporary visas at graduation were “stayers”—that is, they were residing in the United States in 2017 (table 1). China and India were the two largest source countries for U.S.-trained S&E doctorate holders with temporary visas at graduation, and S&E doctorate holders from these two countries had some of the highest rates of those who stayed in the United States post-graduation. At least half of the early career S&E doctorate holders with temporary visas at graduation who were in the United States in 2017 (early career stayers) worked in the same field as their doctorate, although this association varied widely across fields of study and occupation. Like their counterparts who were U.S. citizens or permanent residents at graduation, the early career stayers primarily work for private businesses or academic 4-year colleges, work for larger firms with more than 5,000 employees, and conduct research and development and design as their primary work activities.
Expected residency of U.S. S&E doctorate holders with temporary visas at graduation (2006–15) by actual residency: 2017
S&E = science and engineering.
Note(s):
Percentages are based on the number of doctorate recipients who reported their expected residency 1 year after graduation.
Source(s):
National Center for Science and Engineering Statistics, Survey of Doctorate Recipients, 2017, and Survey of Earned Doctorates, 2006–15.
Stay and Citizenship Rates of U.S.-Trained Foreign-Born S&E Doctorate Recipients
Many U.S. S&E doctorate holders with temporary visas at graduation expect to remain in the United States after graduation and subsequently were in the United States years after they received their doctorates. For the early career S&E doctorate holders reporting temporary visa status at graduation and expected post-graduation plans, 77% planned to remain in the United States in the year after graduation. Post-graduation expectations aligned closely with reported residency in 2017. The vast majority (87%) of those who expected to remain in the United States 1 year after graduation were in the United States in 2017. More than three-quarters (77%) of those who expected to live abroad 1 year after graduation were doing so in 2017 (table 1).
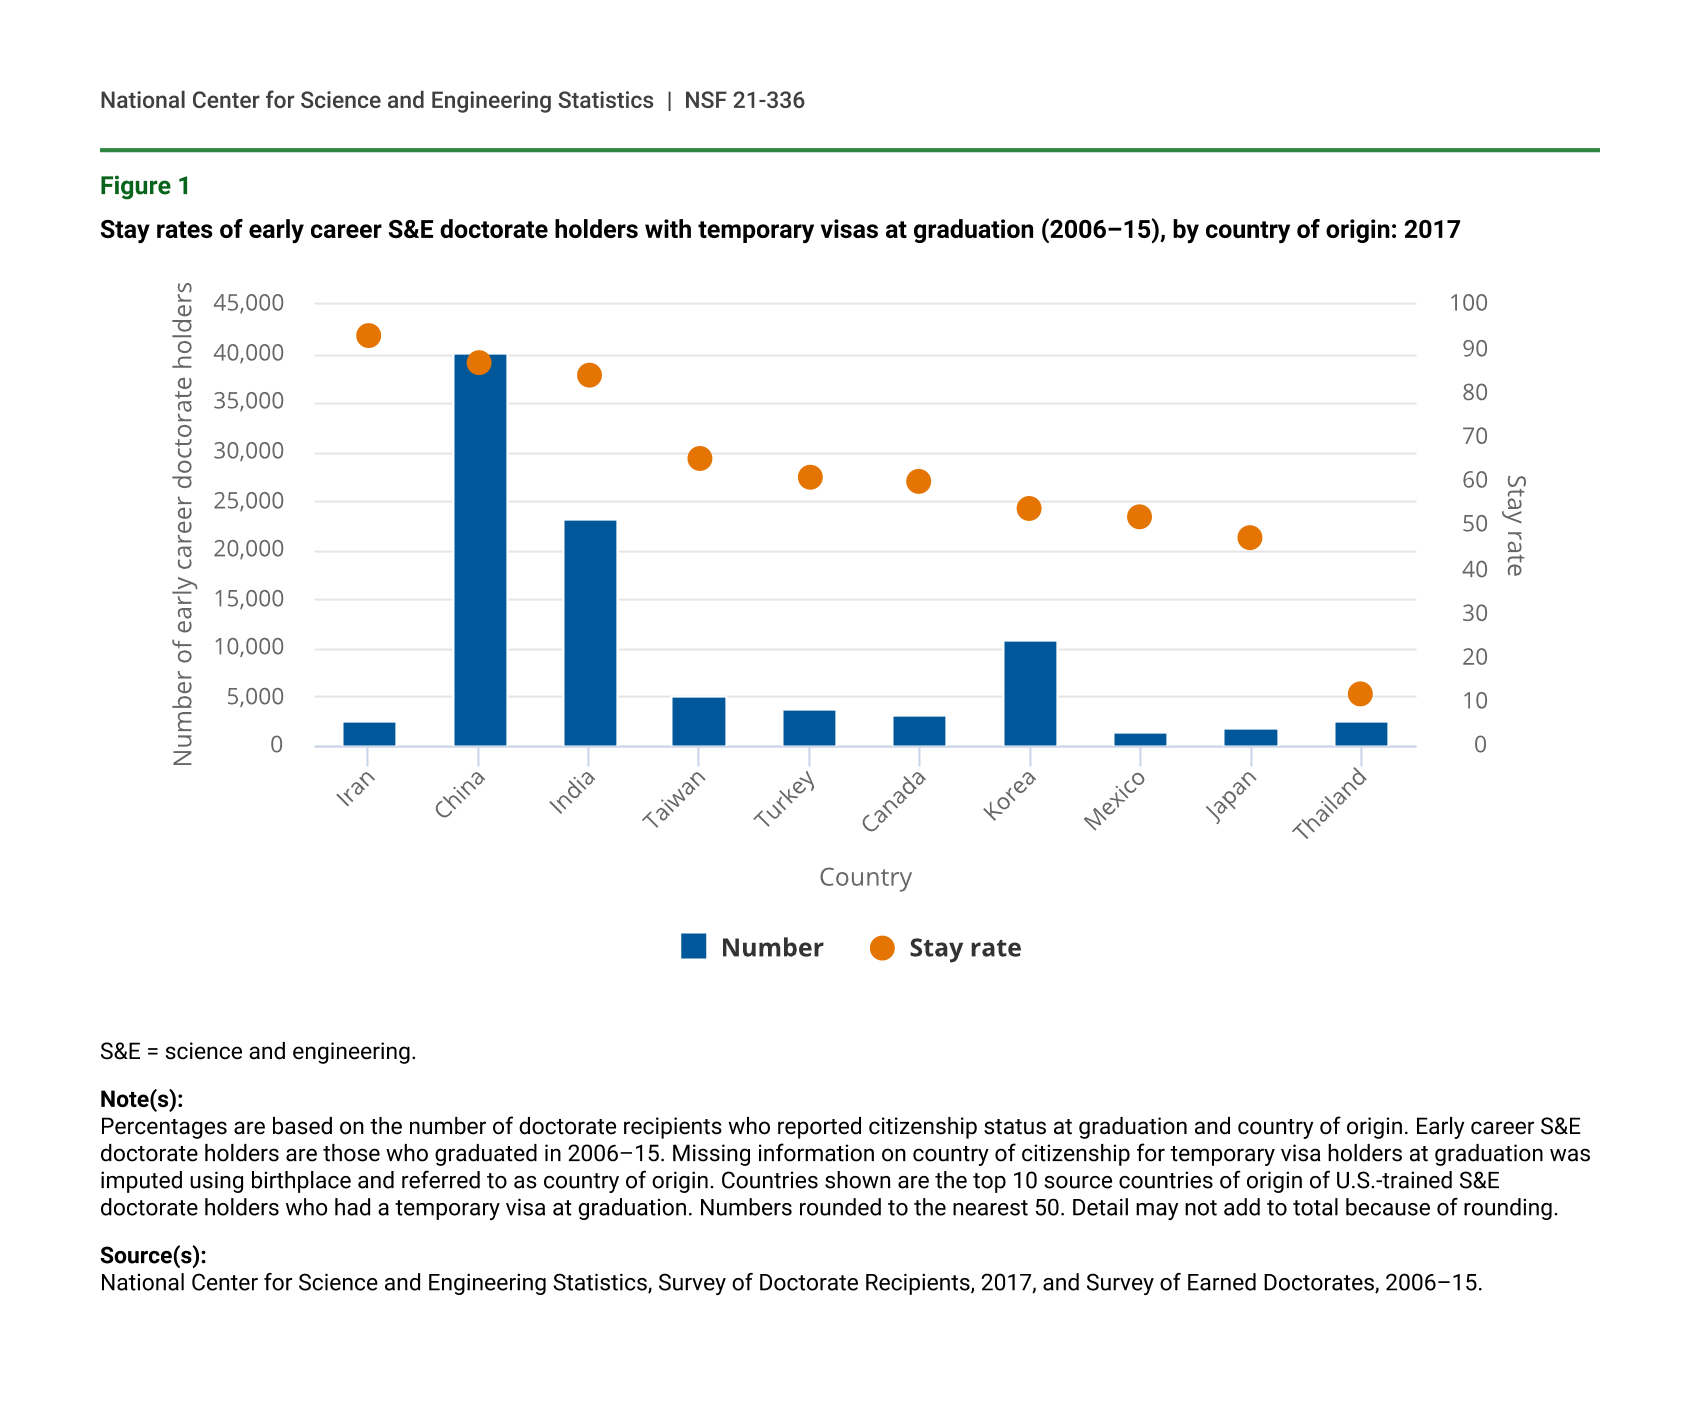
Stay rates varied across the top ten countries of origin, which account for 73% of all S&E doctorates on temporary visas at graduation (figure 1). Among those that reported country of origin and citizenship status at graduation, China and India were the largest source countries for U.S. S&E doctorate recipients with temporary visas at graduation, accounting for approximately 31% and 18%, respectively, of the 2006–15 graduating cohort. S&E doctorate recipients from these two countries tended to have the highest stay rates. S&E doctorate recipients from Iran had the highest stay rate (93%), although Iran was the country of origin for only 2% of the S&E doctorate recipients with temporary visas from the 2006–15 graduating cohort. Of the remaining top ten source countries, about one-half to two-thirds of these S&E doctorate recipients were in the United States in 2017. S&E doctorate recipients from Thailand had the lowest stay rate at 12%.
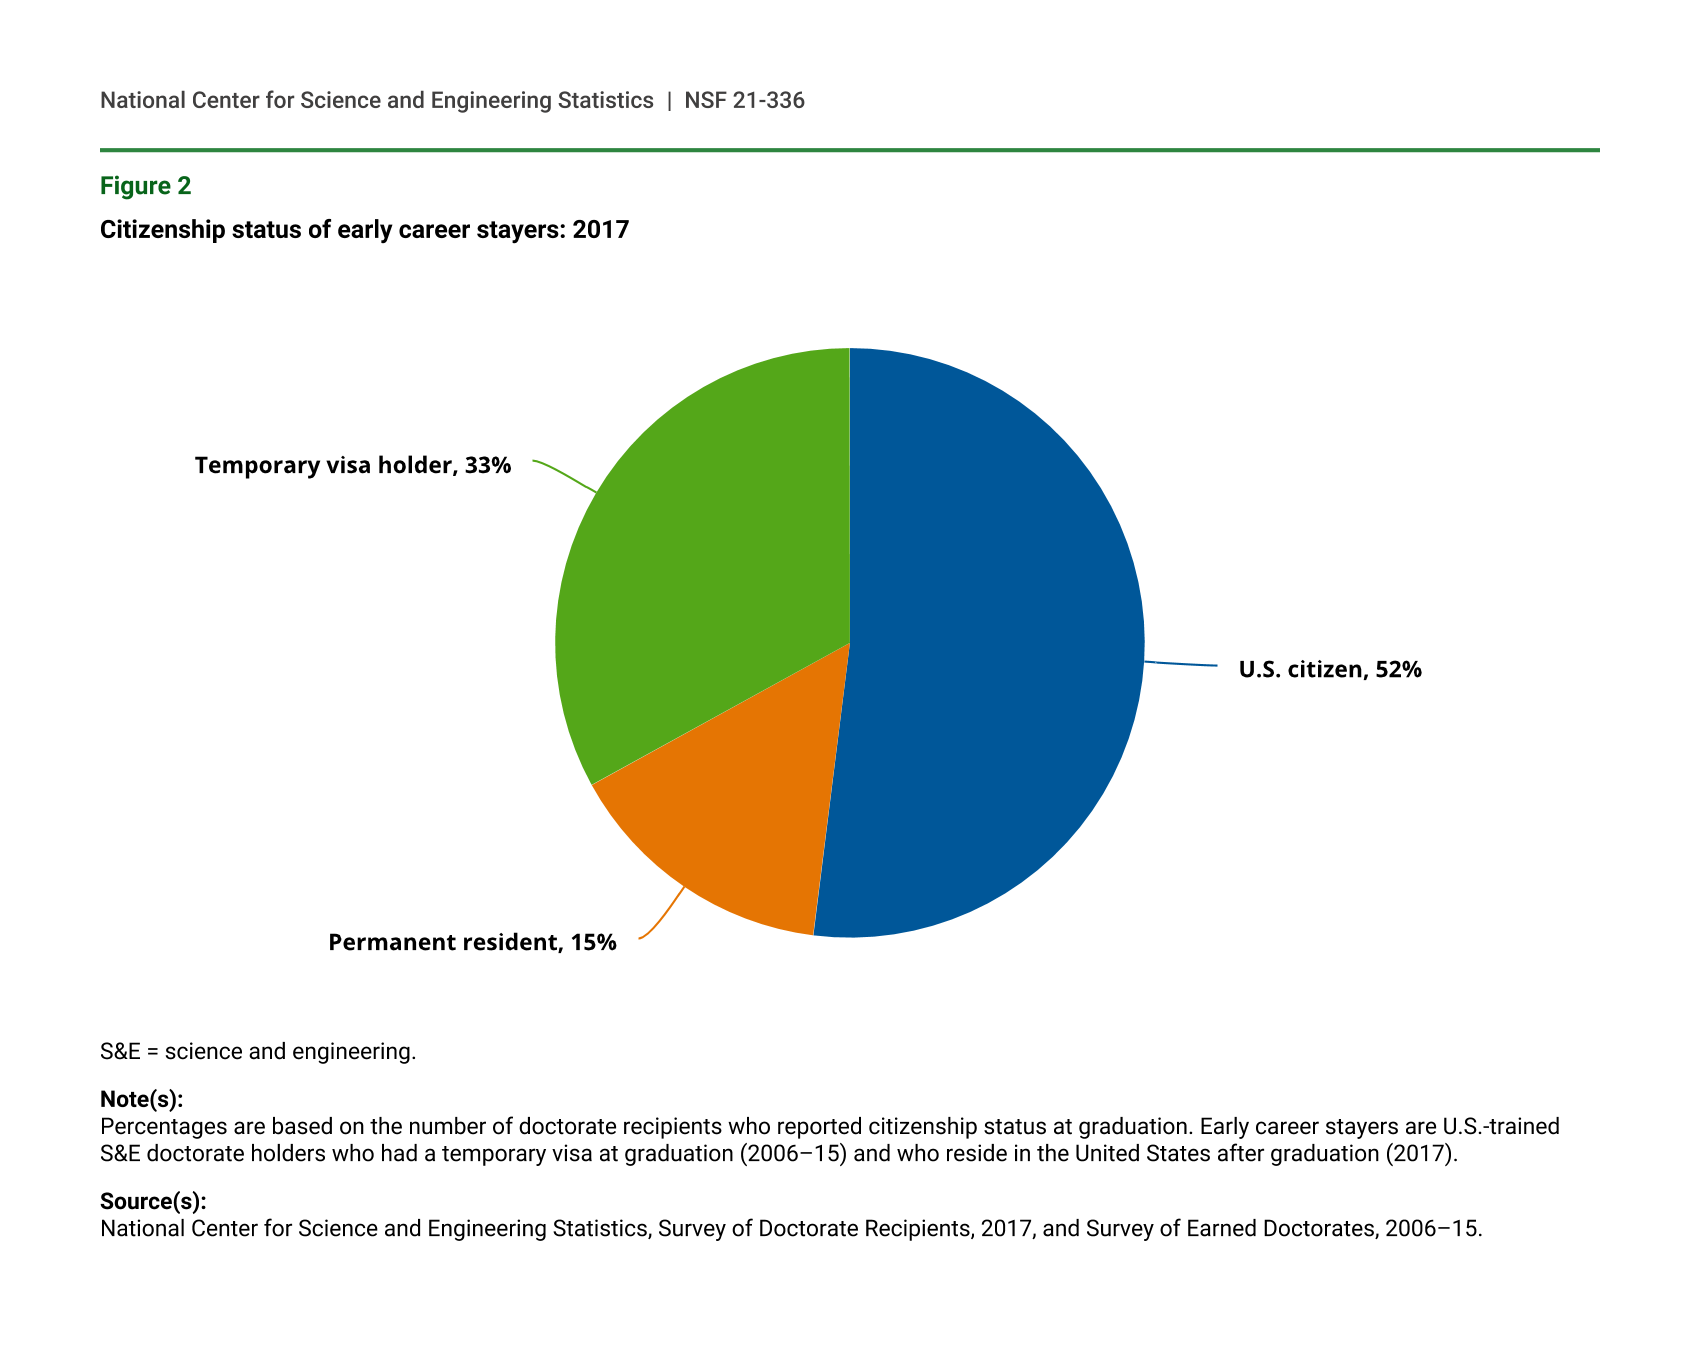
Many early career stayers became U.S. citizens or permanent residents after graduation. Students who stay in the United States typically proceed through some or all of the following immigration process: Optional Practical Training, temporary visa (i.e., H1-B visas), permanent resident, and finally, citizenship (Zwetsloot et al. 2019). Among the early career U.S. S&E doctorate holders in the United States in 2017 with reported citizenship status at graduation, nearly one-third (31%) were temporary visa holders at the time of graduation (table 2). In 2017, over two-thirds of these temporary visa holders (early career stayers) had become U.S. citizens or permanent residents (figure 2).,
Stay rates of early career S&E doctorate holders with temporary visas at graduation (2006–15), by country of origin: 2017
| Country | Number | Stay rate |
|---|---|---|
| Iran | 2,550 | 93 |
| China | 40,150 | 87 |
| India | 23,200 | 84 |
| Taiwan | 5,100 | 65 |
| Turkey | 3,800 | 61 |
| Canada | 3,150 | 60 |
| Korea | 10,750 | 54 |
| Mexico | 1,500 | 52 |
| Japan | 1,900 | 47 |
| Thailand | 2,500 | 12 |
S&E = science and engineering.
Note(s):
Percentages are based on the number of doctorate recipients who reported citizenship status at graduation and country of origin. Early career S&E doctorate holders are those who graduated in 2006–15. Missing information on country of citizenship for temporary visa holders at graduation was imputed using birthplace and referred to as country of origin. Countries shown are the top 10 source countries of origin of U.S.-trained S&E doctorate holders who had a temporary visa at graduation. Numbers rounded to the nearest 50. Detail may not add to total because of rounding.
Source(s):
National Center for Science and Engineering Statistics, Survey of Doctorate Recipients, 2017, and Survey of Earned Doctorates, 2006–15.
Sample and weighted counts of early career U.S. S&E doctorate holders, by subpopulation at graduation (2006–15) and residency: 2017
S&E = science and engineering.
Note(s):
Early career S&E doctorate holders are those who graduated in 2006–15. Imputed country of origin is country of citizenship at graduation for those reporting this information and it is birthplace for those not reporting country of citizenship. Item nonresponse in the Survey of Earned Doctorates affects citizenship status at graduation, country of origin, and expected post-graduation residency plans. All early career S&E doctorate holders include those with missing and nonmissing information. Weighted population counts rounded to the nearest 50. Detail may not add to total because of missing data due to item nonresponse.
Source(s):
National Center for Science and Engineering Statistics, Survey of Doctorate Recipients, 2017, and Survey of Earned Doctorates, 2006–15.
Citizenship status of early career stayers: 2017
| Citizenship status | Percent |
|---|---|
| U.S. citizen, | 52 |
| Permanent resident, | 15 |
| Temporary visa holder, | 33 |
S&E = science and engineering.
Note(s):
Percentages are based on the number of doctorate recipients who reported citizenship status at graduation. Early career stayers are U.S.-trained S&E doctorate holders who had a temporary visa at graduation (2006–15) and who reside in the United States after graduation (2017).
Source(s):
National Center for Science and Engineering Statistics, Survey of Doctorate Recipients, 2017, and Survey of Earned Doctorates, 2006–15.
Employment of Stayers
Employment of early career S&E doctorate recipients, by citizenship status at graduation (2006–15) and occupation: 2017
S&E = science and engineering.
Note(s):
Percentages are based on the number of doctorate recipients who reported citizenship status at graduation. Early career stayers are U.S.-trained S&E doctorate holders who had a temporary visa at graduation (2006–15) and who reside in the United States after graduation (2017). S&E, S&E-related, and non-S&E occupations are based on the major occupational classification used in the SDR (see https://ncsesdata.nsf.gov/doctoratework/2017/html/sdr17-dt-taba003.html). S&E-related occupations include health-related occupations. "Not working" includes early career S&E doctorate recipients who are unemployed or are not in the labor force.
Source(s):
National Center for Science and Engineering Statistics, Survey of Doctorate Recipients, 2017 and Survey of Earned Doctorates, 2006–15.
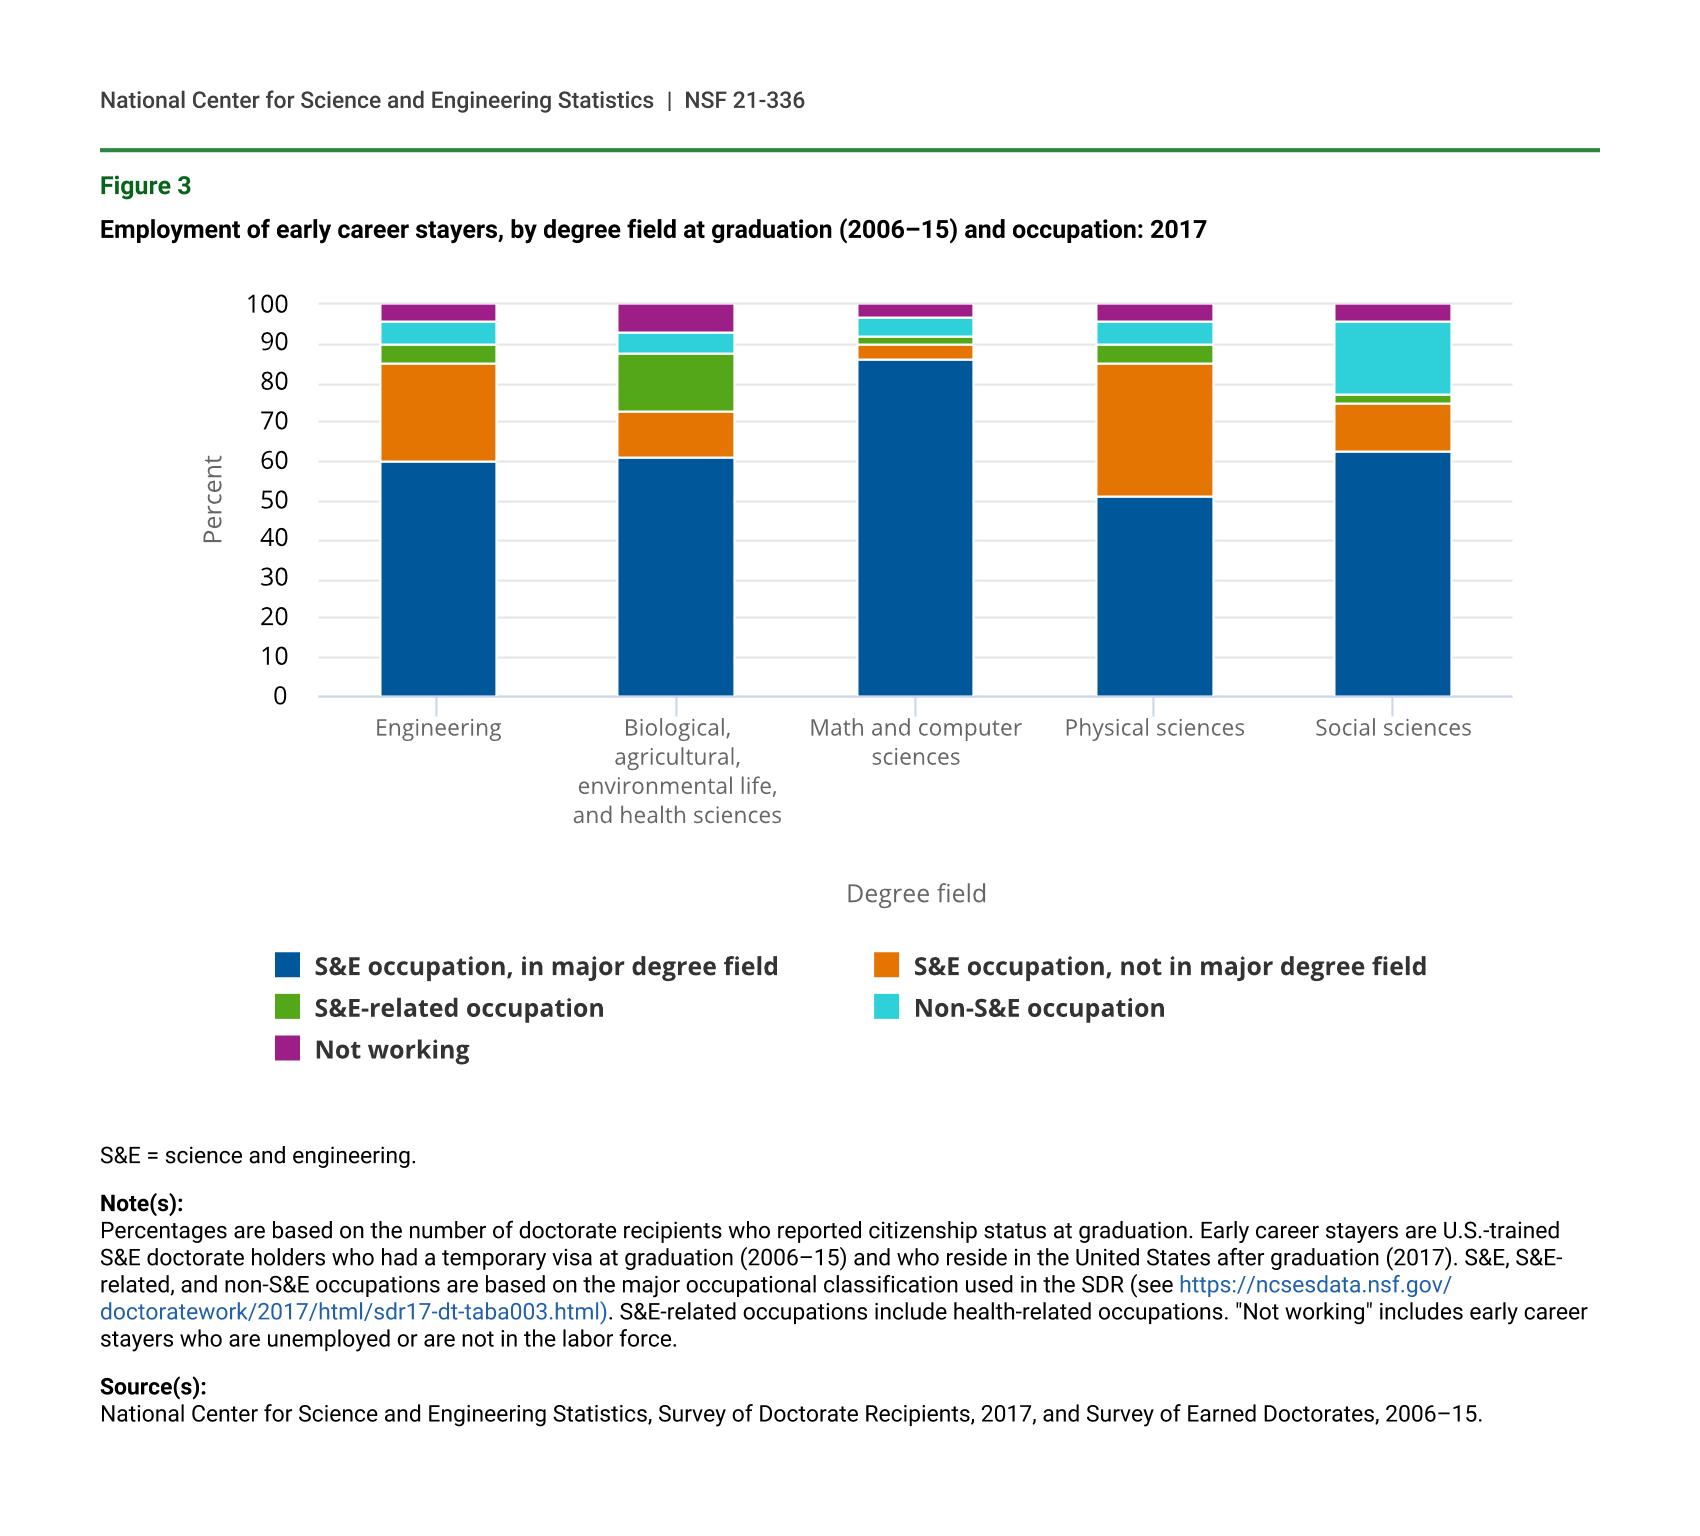
The rate at which early career stayers work in their field of doctoral degree varies across fields (figure 3). For example, early career stayers with a doctorate in mathematics and computer sciences have the highest proportion who work in the same field as their doctorate (86%), whereas those with a physical science doctorate have the lowest proportion (51%). Across all fields, 82% of early career stayers work in S&E, including those working in the same field as their doctorate or in an S&E occupation not in their doctoral field of study. Among early career stayers with a doctorate in physical sciences, about 51% worked as physical scientists and 34% worked in other S&E occupations. Most early career stayers with an engineering doctorate worked as engineers (60%) or in other S&E occupations (25%). Compared with other degree fields, a relatively large proportion of early career stayers with a doctorate in biological, agricultural, environmental life, and health sciences work in S&E-related occupations (15%), which includes health-related occupations. Among all fields, very few early career stayers work in non-S&E occupations (7%) although social science doctorate holders have the largest percentage of early career stayers working in non-S&E occupations—nearly 20%.
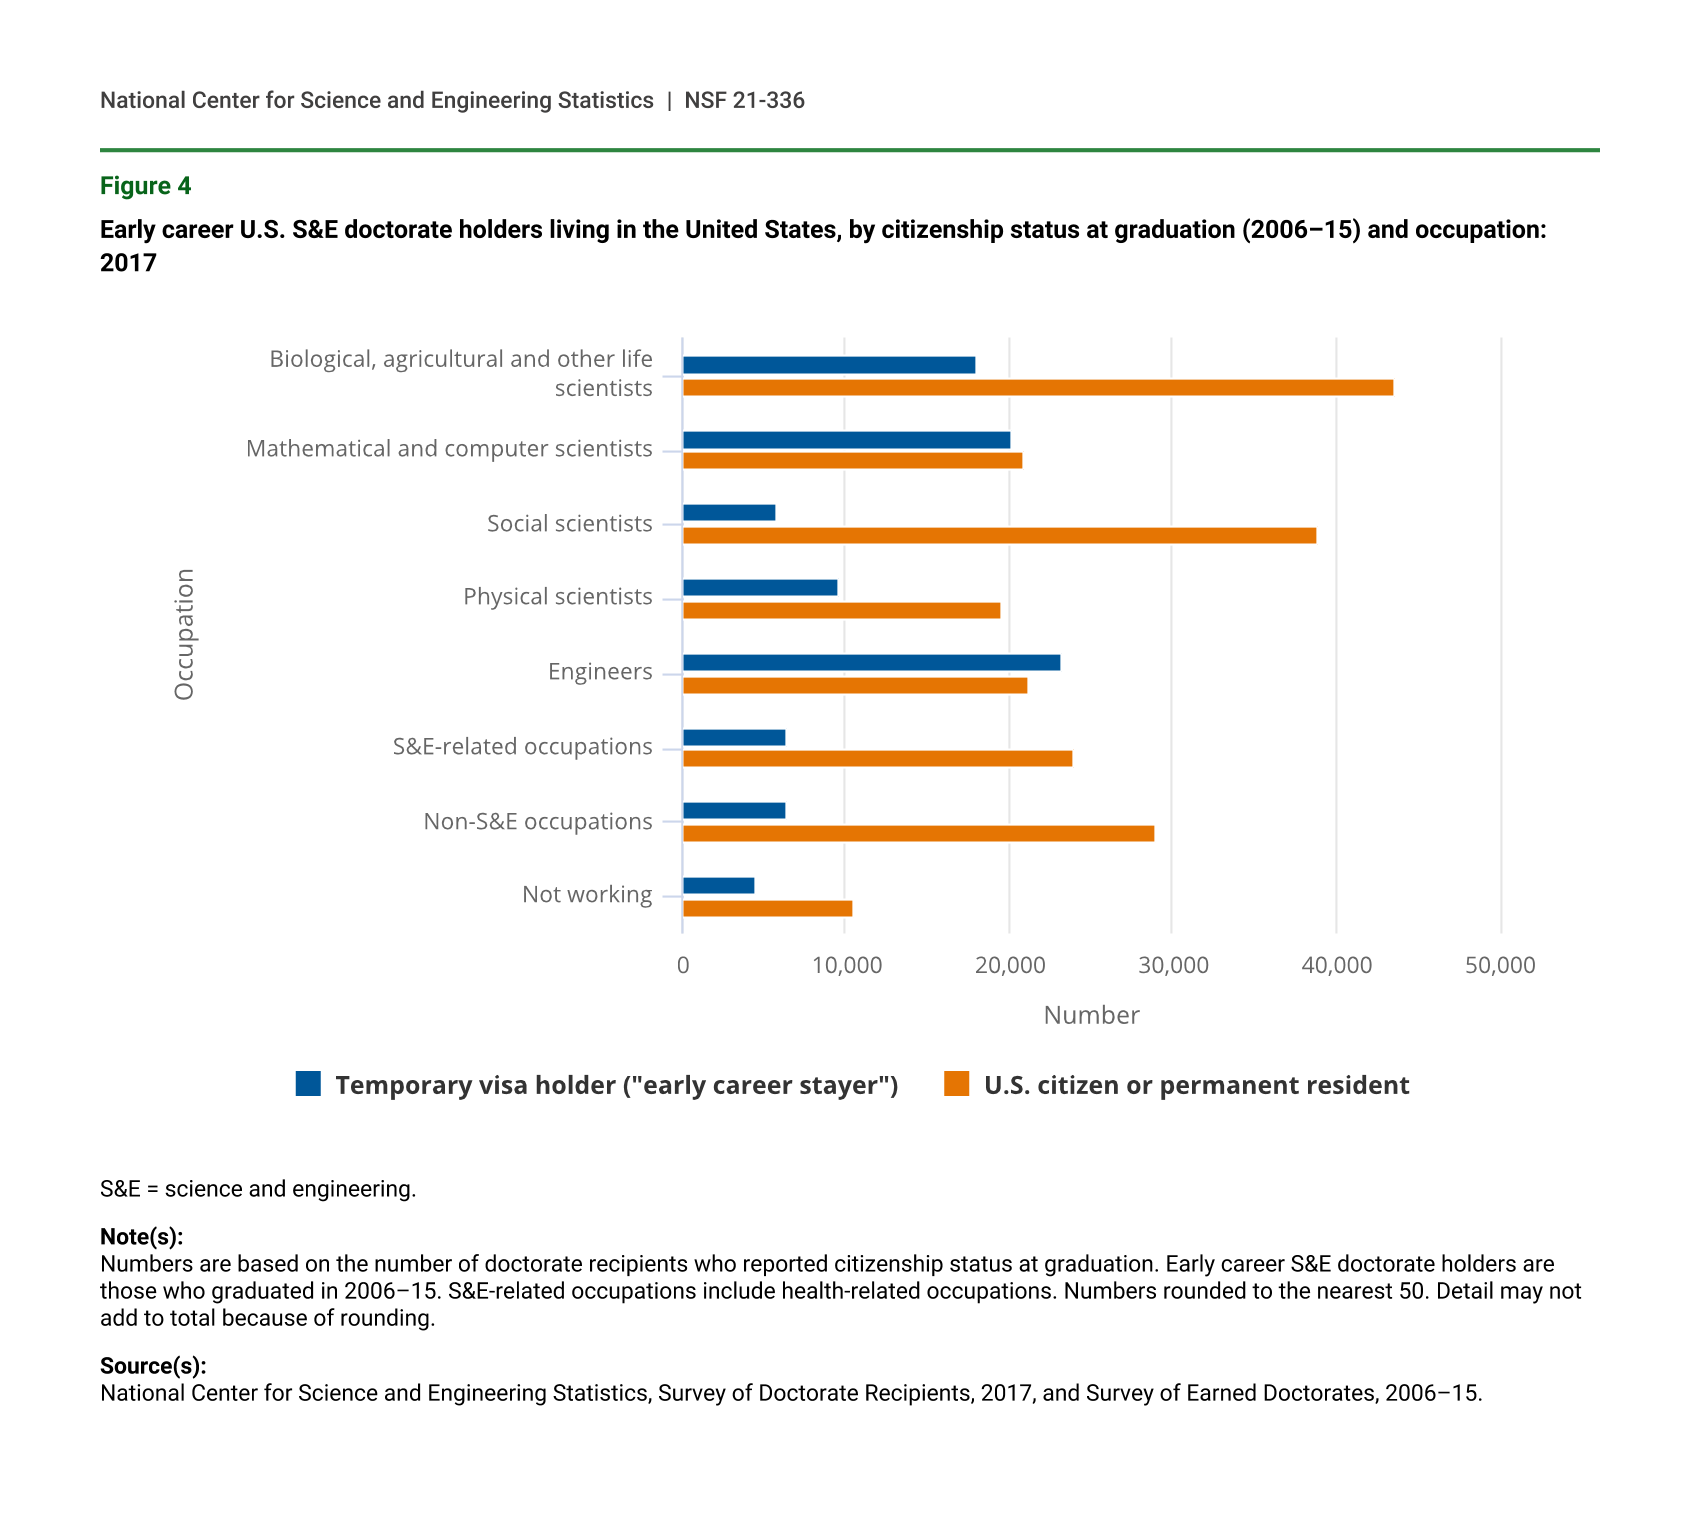
Among early career S&E doctorate recipients residing in the United States, about one-half of computer and mathematical scientists (49%) and engineers (52%) were temporary visa holders at graduation (figure 4). However, the concentration of early career stayers among this U.S.-trained early career cohort who were working in 2017 varies across occupation group. This proportion, for example, was lower (29%) among early career stayers who were working as biological, agricultural, and other life scientists in 2017—the largest occupational group among early career doctorate holders. For social scientists, another large occupational group, only 13% were temporary visa holders at graduation in 2006–15.
Employment of early career stayers, by degree field at graduation (2006–15) and occupation: 2017
| Degree field | S&E occupation, in major degree field | S&E occupation, not in major degree field | S&E-related occupation | Non-S&E occupation | Not working |
|---|---|---|---|---|---|
| Engineering | 60 | 25 | 5 | 6 | 4 |
| Biological, agricultural, environmental life, and health sciences | 61 | 12 | 15 | 5 | 7 |
| Math and computer sciences | 86 | 4 | 2 | 5 | 3 |
| Physical sciences | 51 | 34 | 5 | 6 | 4 |
| Social sciences | 63 | 12 | 2 | 19 | 4 |
S&E = science and engineering.
Note(s):
Percentages are based on the number of doctorate recipients who reported citizenship status at graduation. Early career stayers are U.S.-trained S&E doctorate holders who had a temporary visa at graduation (2006–15) and who reside in the United States after graduation (2017). S&E, S&E-related, and non-S&E occupations are based on the major occupational classification used in the SDR (see https://ncsesdata.nsf.gov/doctoratework/2017/html/sdr17-dt-taba003.html). S&E-related occupations include health-related occupations. "Not working" includes early career stayers who are unemployed or are not in the labor force.
Source(s):
National Center for Science and Engineering Statistics, Survey of Doctorate Recipients, 2017, and Survey of Earned Doctorates, 2006–15.
Early career U.S. S&E doctorate holders living in the United States, by citizenship status at graduation (2006–15) and occupation: 2017
| Occupation | Temporary visa holder ("early career stayer") | U.S. citizen or permanent resident |
|---|---|---|
| Biological, agricultural and other life scientists | 18000 | 43650 |
| Mathematical and computer scientists | 20100 | 20900 |
| Social scientists | 5700 | 38850 |
| Physical scientists | 9600 | 19500 |
| Engineers | 23250 | 21200 |
| S&E-related occupations | 6400 | 24000 |
| Non-S&E occupations | 6400 | 28950 |
| Not working | 4450 | 10500 |
S&E = science and engineering.
Note(s):
Numbers are based on the number of doctorate recipients who reported citizenship status at graduation. Early career S&E doctorate holders are those who graduated in 2006–15. S&E-related occupations include health-related occupations. Numbers rounded to the nearest 50. Detail may not add to total because of rounding.
Source(s):
National Center for Science and Engineering Statistics, Survey of Doctorate Recipients, 2017, and Survey of Earned Doctorates, 2006–15.
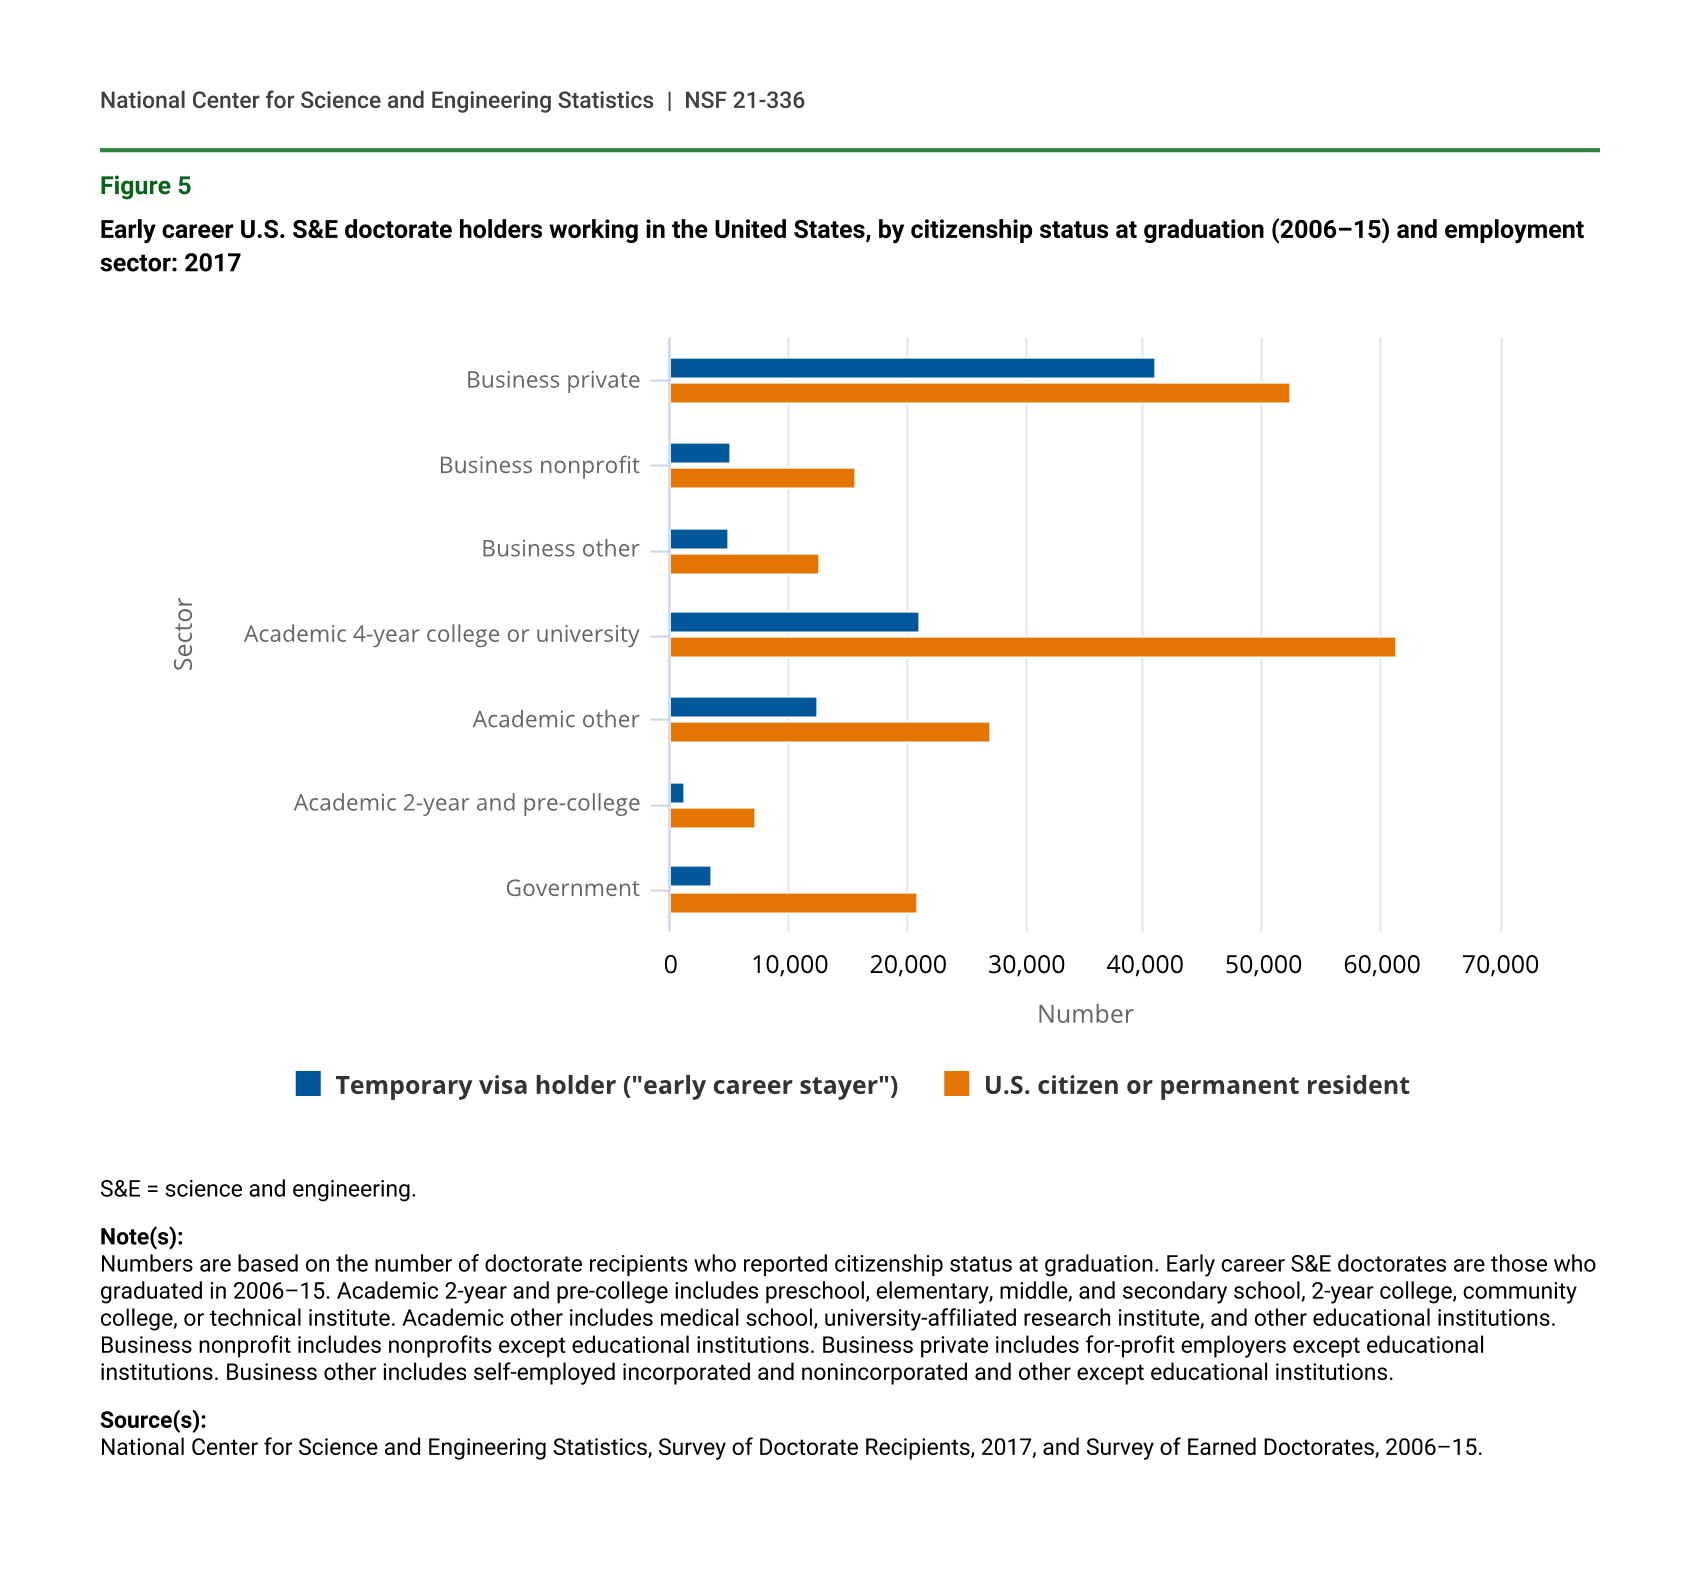
Although most employed early career U.S.-trained S&E doctorate holders (all citizenship statuses at graduation) worked primarily for private businesses in 2017, a greater proportion of early career stayers worked in private, for-profit businesses relative to their counterpart group of U.S. citizens and permanent residents. Forty-six percent of employed early career stayers worked for for-profit businesses, compared with 27% of their U.S. citizen and permanent resident counterparts. In contrast, the U.S. citizen and permanent resident counterparts had a higher proportion who worked in 4-year academic institutions than did early career stayers (31% versus 24%) (figure 5).
Early career U.S. S&E doctorate holders working in the United States, by citizenship status at graduation (2006–15) and employment sector: 2017
| Sector | Temporary visa holder ("early career stayer") | U.S. citizen or permanent resident |
|---|---|---|
| Business private | 41,050 | 52,350 |
| Business nonprofit | 5,100 | 15,650 |
| Business other | 5,000 | 12,650 |
| Academic 4-year college or university | 21,050 | 61,350 |
| Academic other | 12,450 | 27,000 |
| Academic 2-year and pre-college | 1,150 | 7,150 |
| Government | 3,600 | 20,900 |
S&E = science and engineering.
Note(s):
Numbers are based on the number of doctorate recipients who reported citizenship status at graduation. Early career S&E doctorates are those who graduated in 2006–15. Academic 2-year and pre-college includes preschool, elementary, middle, and secondary school, 2-year college, community college, or technical institute. Academic other includes medical school, university-affiliated research institute, and other educational institutions. Business nonprofit includes nonprofits except educational institutions. Business private includes for-profit employers except educational institutions. Business other includes self-employed incorporated and nonincorporated and other except educational institutions.
Source(s):
National Center for Science and Engineering Statistics, Survey of Doctorate Recipients, 2017, and Survey of Earned Doctorates, 2006–15.
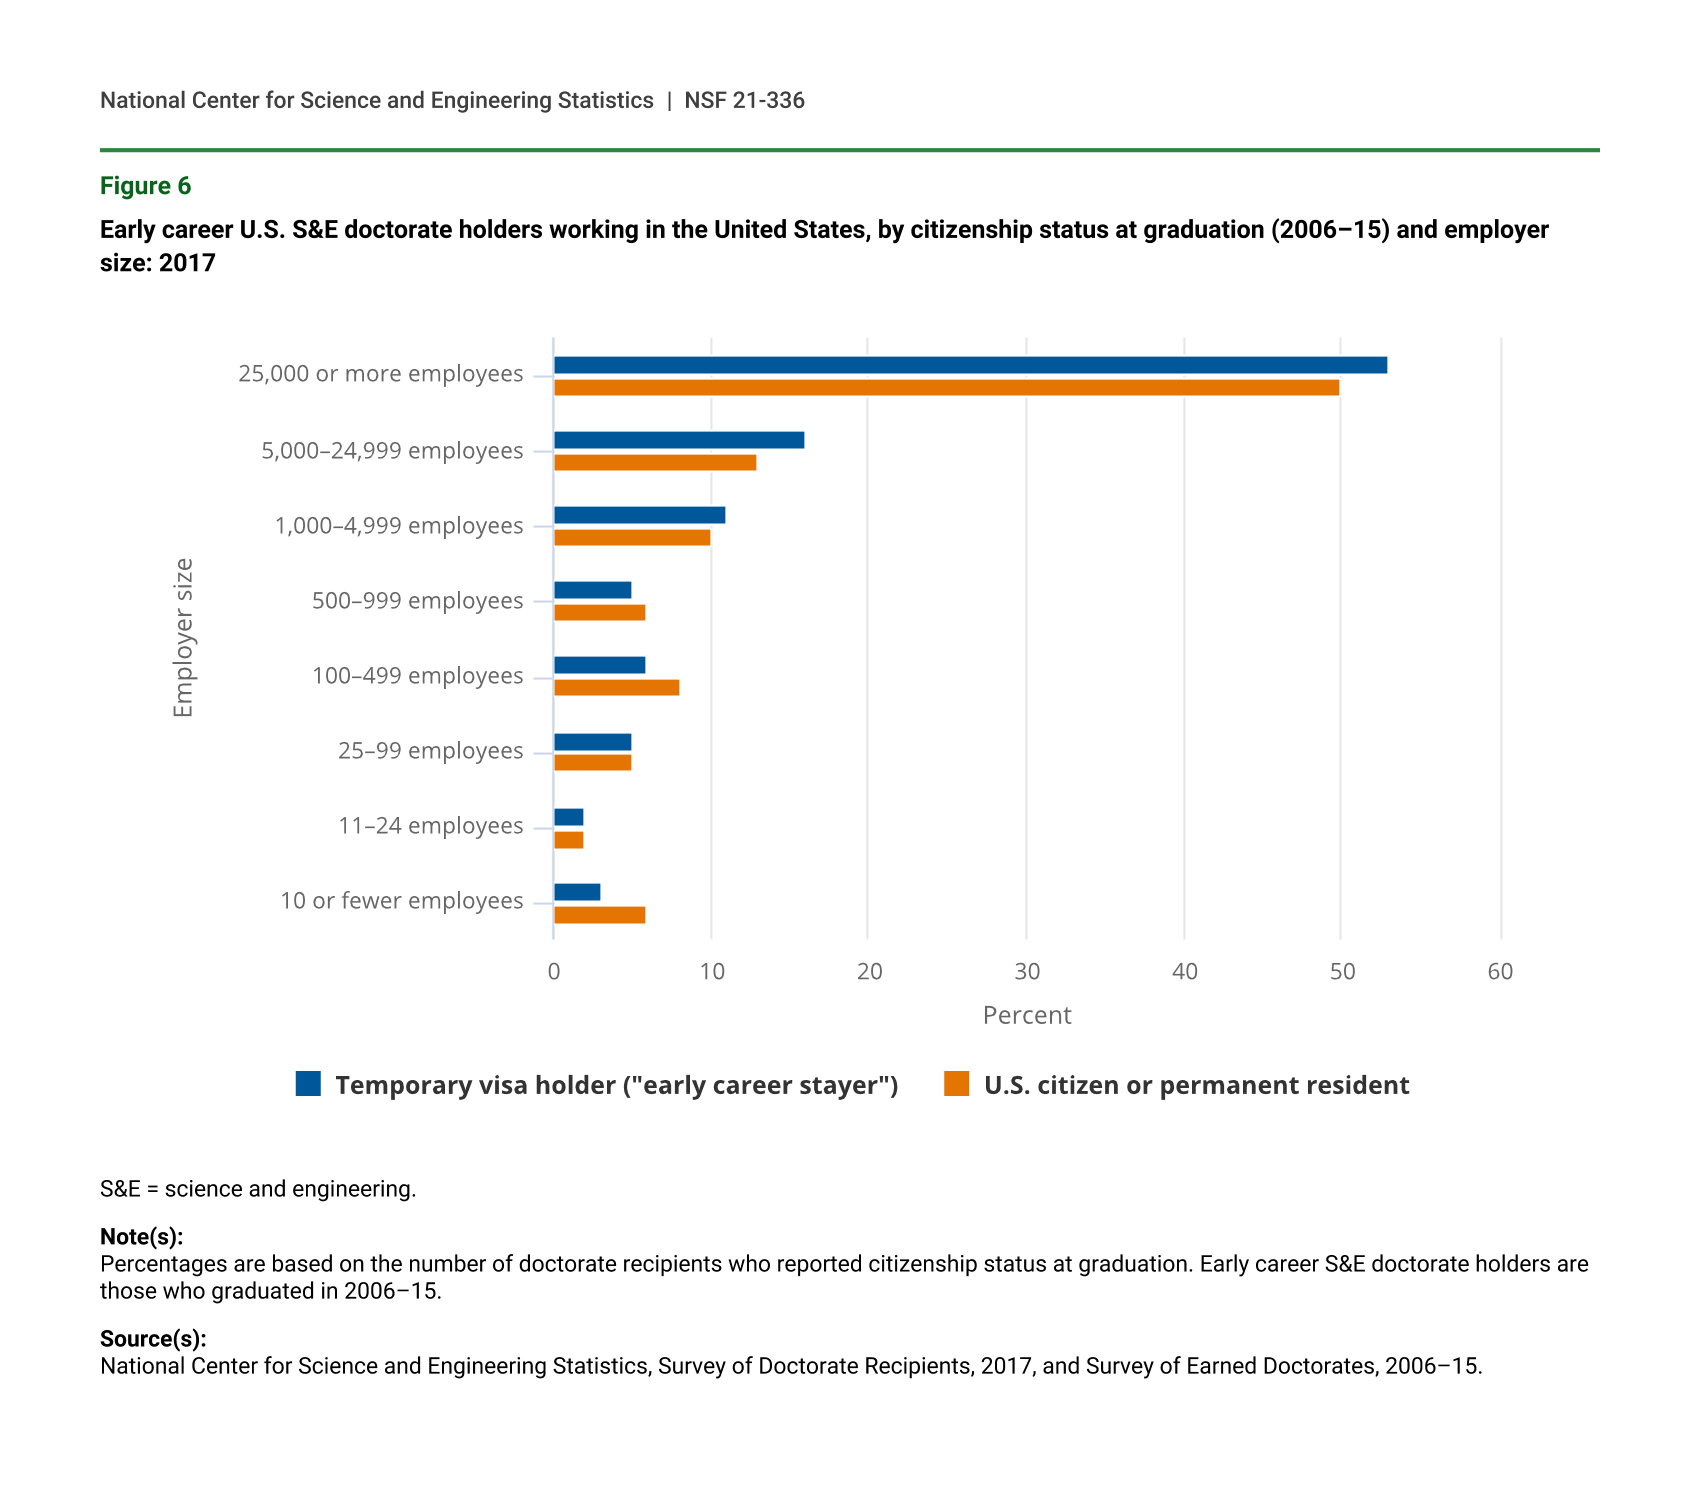
About 53% of employed early career stayers and 50% of their employed U.S. citizen and permanent resident counterparts worked for companies categorized as having the largest number of employees (i.e., 25,000 or more employees) (figure 6). The pattern of employment by number of employees was similar for both citizenship status groups (figure 6), with higher shares of both groups working for the three largest employer categories and smaller shares working for employers with fewer than 1,000 employees. However, early career stayers were employed less frequently at firms with 10 or fewer employees (3%), compared with their U.S. citizen and permanent resident counterparts (6%).
Early career U.S. S&E doctorate holders working in the United States, by citizenship status at graduation (2006–15) and employer size: 2017
| Employer size | Temporary visa holder ("early career stayer") | U.S. citizen or permanent resident |
|---|---|---|
| 25,000 or more employees | 53 | 50 |
| 5,000–24,999 employees | 16 | 13 |
| 1,000–4,999 employees | 11 | 10 |
| 500–999 employees | 5 | 6 |
| 100–499 employees | 6 | 8 |
| 25–99 employees | 5 | 5 |
| 11–24 employees | 2 | 2 |
| 10 or fewer employees | 3 | 6 |
S&E = science and engineering.
Note(s):
Percentages are based on the number of doctorate recipients who reported citizenship status at graduation. Early career S&E doctorate holders are those who graduated in 2006–15.
Source(s):
National Center for Science and Engineering Statistics, Survey of Doctorate Recipients, 2017, and Survey of Earned Doctorates, 2006–15.
Primary Work Activities of Early Career U.S.-Trained S&E Doctorate Recipients Living in The United States
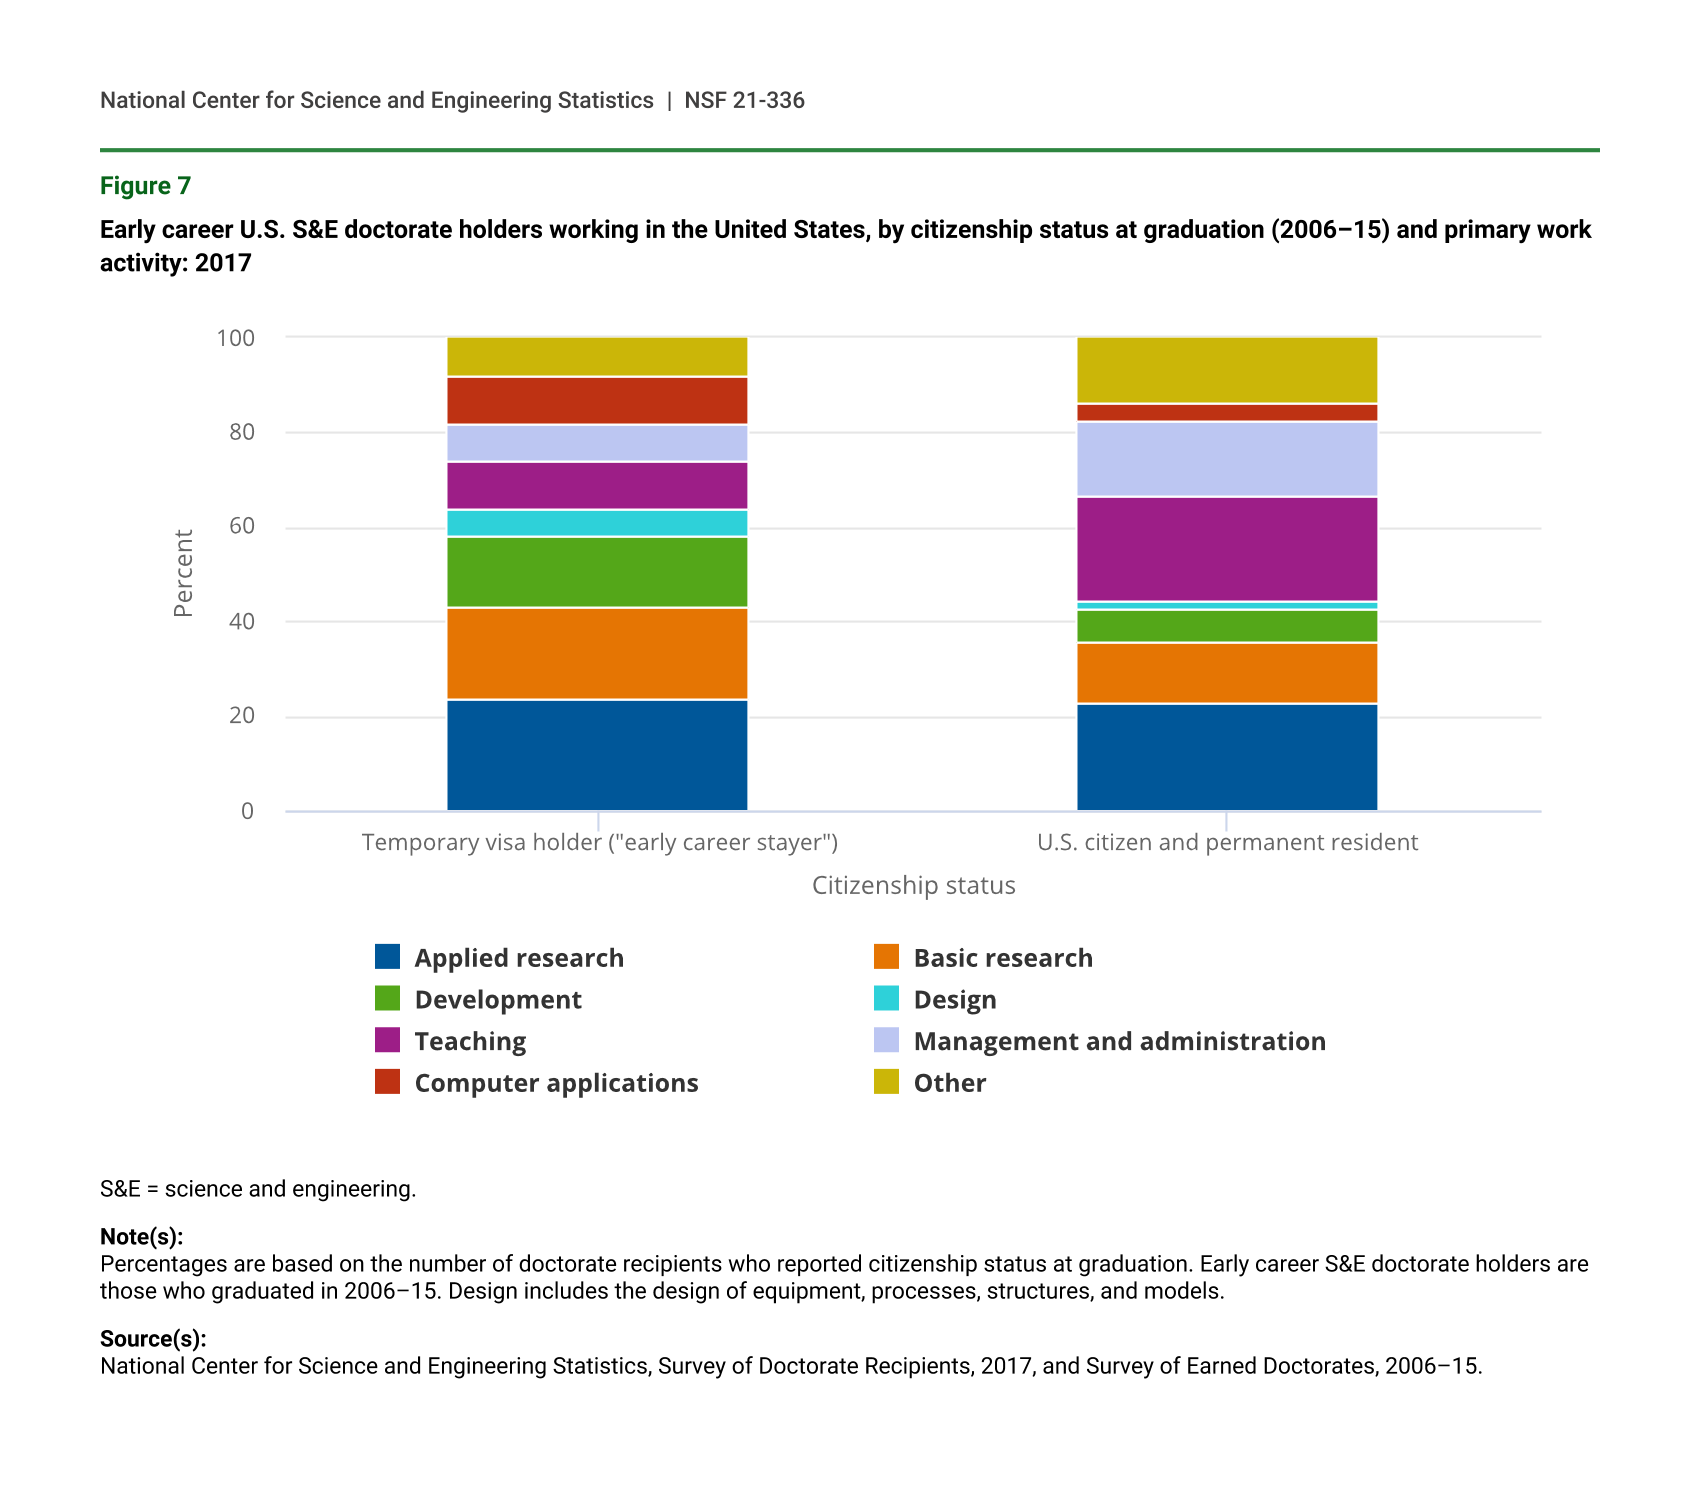
Early career U.S. S&E doctorate holders working in the United States, by citizenship status at graduation (2006–15) and primary work activity: 2017
| Citizenship status | Applied research | Basic research | Development | Design | Teaching | Management and administration | Computer applications | Other |
|---|---|---|---|---|---|---|---|---|
| Temporary visa holder ("early career stayer") | 24 | 19 | 15 | 6 | 10 | 8 | 10 | 8 |
| U.S. citizen and permanent resident | 23 | 13 | 7 | 2 | 22 | 16 | 4 | 14 |
S&E = science and engineering.
Note(s):
Percentages are based on the number of doctorate recipients who reported citizenship status at graduation. Early career S&E doctorate holders are those who graduated in 2006–15. Design includes the design of equipment, processes, structures, and models.
Source(s):
National Center for Science and Engineering Statistics, Survey of Doctorate Recipients, 2017, and Survey of Earned Doctorates, 2006–15.
Stayers represent a considerable proportion of employed early career scientists and engineers with a doctorate living in the United States and conducting R&D in 2017. Of all of the S&E doctorate holders who were in the early stage of their career and who were working primarily on basic and applied research, employed early career stayers represented about 19% of social scientists and about half (51%) of engineers and mathematical and computer scientists (table 4). Most engineers (62%) and mathematical and computer scientists (68%) conducting development as their primary work activity were early career stayers.
Early career U.S. S&E doctorate holders working primarily on R&D, by citizenship status at graduation, R&D primary activity, and occupation: 2017
S = suppressed for reasons of confidentiality or reliability.
S&E = science and engineering.
Note(s):
Percentages are based on the number of doctorate recipients who reported citizenship status at graduation. Early career S&E doctorate holders are those who graduated in 2006–15. S&E-related occupations include health-related occupations.
Source(s):
National Center for Science and Engineering Statistics, Survey of Doctorate Recipients, 2017, and Survey of Earned Doctorates, 2006–15.
Data Sources, Limitations, and Availability
The primary data sources for this analysis were the 2006–15 Surveys of Earned Doctorates (SED) and the 2017 Survey of Doctorate Recipients (SDR). The SED is a census of U.S. research doctorial graduates and collects information relevant to this analysis on degree field and citizenship status. Since the SED is a census, it is not subject to sampling error, but it is subject to nonsampling error (for more details see SED webpage, https://www.nsf.gov/statistics/srvydoctorates/#sd). The SDR is a subsample of the SED that is followed at least 2 years after graduation, collecting relevant information used in this analysis on residency, occupation, and citizenship status.
The SDR uses a fixed panel design with a sample of new doctoral graduates added to the panel in each biennial survey cycle. For the 2017 SDR, all doctorate holders who were included in the 2015 SDR sample and who remained age eligible (i.e., less than 76 years) for the 2017 survey were retained, and a sample of new graduates who had earned their degrees between 1 July 2013 and 30 June 2015 were added. The new sample of graduates was selected by using a stratified sample design, where the strata were defined by fine fields of study listed in the SED. The SDR is subject to sampling and nonsampling errors (for more details see SDR webpage, https://www.nsf.gov/statistics/srvydoctoratework/#tabs-1&sd).
The analysis of degree fields and occupations follows standard NCSES definitions. Doctoral degree fields follow the NCSES Taxonomy of Disciplines for broad fields except the analyses within this InfoBrief combine the broad fields of (1) health sciences and (2) biological, agricultural, and environmental life sciences (for a more detailed description of the Taxonomy of Disciplines for broad fields, see https://ncsesdata.nsf.gov/doctoratework/2017/html/sdr17-dt-taba002.html). Occupations are classified into S&E, S&E-related (including health occupations), or non-S&E following the major occupational classification used in the SDR (see https://ncsesdata.nsf.gov/doctoratework/2017/html/sdr17-dt-taba003.html). Respondents working in an S&E occupation (i.e., computer and mathematical scientists; biological, agricultural, and other life scientists; physical and related scientists; social scientists; and engineers) are further classified as working in their major degree field if their major occupational group is the same as their major degree field.
A limitation of this research is that the SED and SDR do not allow for analysis of S&E doctorate recipients who earned a degree outside of the United States. According to the 2017 National Survey of College Graduates (NSCG), which collects information on U.S. employment for college graduates regardless of where they obtained their degree, about 88% of individuals with S&E doctorate degrees earned their degree in the United States (for more details see NSCG webpage, https://www.nsf.gov/statistics/srvygrads/). For more information on foreign-trained S&E doctorate holders working in the United States, see Chang and Milan (2012; 2014).
Another limitation of this research is that information is missing for a subset of SED respondents on the following variables that are used in this analysis: citizenship status at graduation, expected location 1 year after graduation, and country of citizenship at graduation. For example, 320,250 U.S. S&E doctorate holders who were in the early stage of their career were living in the United States in 2017, but citizenship status at graduation was known for only 301,350 (table 2). Similarly, there were 45,600 early career U.S. S&E doctorates living abroad in 2017 but only 43,400 reported citizenship status at graduation. Country of citizenship at graduation was missing for a small number of respondents who reported having temporary visas at graduation (< 40). This missing information was imputed using birthplace and is referred to as “country of origin” in the analysis.
All reported percentages in this analysis are based on early career S&E doctorate recipients (graduated between 2006 and 2015) without missing information on citizenship status at graduation. In addition, estimates of expected location after graduation were based on respondents without missing citizenship status and expected location after graduation. Item nonresponse on citizenship status at graduation and expected location after graduation could bias the reported estimates in this analysis. The direction and magnitude of the bias is difficult to predict in the cross tabulations presented in this analysis. To gauge the maximum bias arising from item nonresponse in the SED, the 1,355 respondents with missing citizenship status at graduation were assumed to be temporary visa holders. Based on this assumption, the stay rates of early career doctorates increase to 75%, compared with 72% when respondents with missing citizenship status at graduation are dropped. In an effort to provide high-quality, relevant, and timely data products, NCSES will continue to explore various options to address missing data in the analysis and research it conducts.
Notes
1Reported estimates of early career S&E doctorate holders living in the United States in 2017 are based on respondents with non-missing information on citizenship status at graduation (2006–15). See “Data Sources, Limitations, and Availability” section for more details.
2Country of origin is country of citizenship at graduation for those reporting this information, and it is birthplace for those not reporting country of citizenship.
3Optional Practical Training allows graduates who were on student visas (i.e., F-1) to stay in the United States for up to 3 additional years to work full-time on their student visa (Zwetsloot et al. 2019). Optional Practical Training approvals (257,000) outpaced initial H-1B approvals (115,000) between 2014 and 2016, and more than half (53%) of the Optional Practical Training participants were STEM (science, technology, engineering, and mathematics) graduates (Ruiz and Budiman 2018).
4Reported citizenship status between graduation (2006–15) and 2017 appear to be inconsistent for a small number of respondents (138). This includes respondents reporting being a U.S. citizen at graduation and reporting being a temporary or permanent resident in 2017.
5The rate at which stayers become U.S. citizens or permanent residents is higher for those graduating in the older cohorts. For example, roughly 9% of stayers who graduated in 2006 became U.S. citizens or permanent residents by 2017, compared to 3%–4% of stayers that graduated in 2014 and 2015.
References
Chang WY, Milan LM; National Center for Science and Engineering Statistics (NCSES). 2012. International Mobility and Employment Characteristics of Recent Recipients of U.S. Doctorates. InfoBrief NSF 13-300. Arlington, VA: National Science Foundation. Available at https://www.nsf.gov/statistics/infbrief/nsf13300/.
Chang WY, Milan LM; National Center for Science and Engineering Statistics (NCSES). 2014. Employment Decisions of U.S. and Foreign Doctoral Graduates: A Comparative Study. InfoBrief NSF 15-302. Arlington, VA: National Science Foundation. Available at https://www.nsf.gov/statistics/2015/nsf15302/.
Finn M, Pennington LA. 2018. Stay Rates of Foreign Doctorate Recipients from U.S. Universities, 2013. Report prepared by the Oak Ridge Institute for Science and Education for NCSES. Available at https://orise.orau.gov/stem/reports/stay-rates-foreign-doctorate-recipients-2013.pdf.
National Science Board, National Science Foundation (NSB/NSF). 2019a. Science and Engineering Labor Force. Science and Engineering Indicators 2020. Available at https://ncses.nsf.gov/pubs/nsb20198.
National Science Board, National Science Foundation (NSB/NSF). 2019b. Higher Education in Science and Engineering. Science and Engineering Indicators 2020. Available at https://ncses.nsf.gov/pubs/nsb20197.
Ruiz NG, Budiman A. 2018. Number of Foreign College Students Staying and Working in U.S. After Graduation Surges. Washington, DC: Pew Research Center. Available at https://www.pewresearch.org/global/2018/05/10/number-of-foreign-college-students-staying-and-working-in-u-s-after-graduation-surges/#opt-approvals-outpaced-initial-h-1b-visa-approvals-in-recent-years#opt-approvals-outpaced-initial-h-1b-visa-approvals-in-recent-years) .
Zwetsloot R, Dunham J, Arnold Z, Huang T. 2019. Keeping Top AI Talent in the United States: Findings and Policy Options for International Graduate Student Retention. Washington, DC: Center for Security and Emerging Technology. Available at https://cset.georgetown.edu/wp-content/uploads/Keeping-Top-AI-Talent-in-the-United-States.pdf.
Suggested Citation
Contact Us
NCSES
National Center for Science and Engineering Statistics
Directorate for Social, Behavioral and Economic Sciences
National Science Foundation
2415 Eisenhower Avenue, Suite W14200
Alexandria, VA 22314
Tel: (703) 292-8780
FIRS: (800) 877-8339
TDD: (800) 281-8749
E-mail: ncsesweb@nsf.gov