 An official website of the United States government

Matching SDR Respondents to Investigators of NSF Awards
Disclaimer
Working papers (WPs) are intended to report exploratory results of research and analysis undertaken by the National Center for Science and Engineering Statistics at the National Science Foundation (NSF). Any opinions, findings, conclusions, or recommendations expressed in this WP do not necessarily reflect the views of NSF. This WP has been released to inform interested parties of ongoing research or activities and to encourage further discussion of the topic.
Abstract
Developing linkages between administrative data and National Center for Science and Engineering Statistics (NCSES) survey data provides new opportunities to examine the impacts of federal funding on the U.S. science and engineering enterprise. This working paper describes a novel effort to match respondents of the NCSES Survey of Doctorate Recipients (SDR) to investigators in the National Science Foundation (NSF) awards database. Specific inputs to the matching process included data from the 2015 SDR—which consisted of 78,320 respondents, representing 920,050 U.S.-residing and 127,800 non-U.S.-residing doctoral scientists and engineers—and roughly 700,000 NSF award-investigator records spanning the last 60 years. Matching was performed sequentially using deterministic methods, primarily relying on survey respondent and award investigator names and e-mail addresses, as well as institution information. The matching process resulted in 7,363 SDR respondents matched to NSF awards, with an average of 4.4 awards matched to each individual who was matched to any award. Data limitations of this matched set, as well as illustrative use examples, are discussed. This proof-of-concept exploration indicates the potential of data linkages to improve the utility of NCSES survey data and to open a wide range of applications for research and program evaluation.
Introduction
The National Center for Science and Engineering Statistics (NCSES) conducts a broad range of surveys on topics, including science and engineering (S&E) education, workforce, research facilities, and research and development funding and expenditures. The results of these surveys inform policymakers, educators, and the public on topics ranging from U.S. competitiveness to science, technology, engineering, and mathematics (STEM) education. As a statistical agency within the National Science Foundation (NSF), NCSES is in a unique position to provide statistical expertise per Title I of the Foundations for Evidence-Based Policymaking Act of 2018 (Evidence Act), and to offer rich and highly relevant data for studying the effects of federal funding on the U.S. S&E enterprise.
Linking of federal awards, survey, and administrative data has been conducted to assess the effects of federal research funding on workforce, innovation, and productivity and to analyze educational and career outcomes of individuals supported by federal science training and research projects. Recent work in this area of research has suggested that “the richness and complexity of the research enterprise is such that linking data from a variety of sources is likely to be an important way to get new understanding about the multiple facets of scientific activity” (Chang et al. 2019:1487). Large-scale bibliometric linkages have been used to derive insights on the effects of federal research on patenting, including the significant and increasing reliance of U.S. patents on federally supported research (Fleming et al. 2019).
The UMETRICS data set, containing wage and vendor transactions by major U.S. research universities supported by federal awards, has been a particularly fruitful resource for scholarship in this field (Lane et al. 2015), including data linking efforts. Buffington et al. (2016) linked personnel supported by federal research grants in UMETRICS to U.S. Census Bureau earnings records and then utilized the linked data to explore differences in STEM training environments and labor market placement outcomes across gender and household characteristics. More recently, research personnel in UMETRICS have been linked to individuals in the NCSES Survey of Earned Doctorates (SED), a major source of data on U.S. doctoral training and plans for employment. The authors demonstrated how the linked information could increase knowledge of federal funding flows and the importance of federal funding by doctoral field (Chang et al. 2019).
For this project, a matching process was developed to link award and investigator data in the public NSF awards database to restricted-use data in the Survey of Doctorate Recipients (SDR). The aims of this exploratory analysis were to determine the feasibility of linking publicly available NSF administrative data with NCSES survey response data and to assess new avenues for evaluating the impacts of NSF investments. Specifically, three goals were identified, including to (1) explore the potential of utilizing the public NSF awards database and expand knowledge and use of this data set, (2) identify best practices for matching federal award data with other data sets, and (3) enhance the analytical potential of NCSES data for science policy research. As this was exploratory, no inferences should be made with data presented in this paper.
The project described in this working paper establishes that individual-level records can be linked between the two data sources. It identifies a new way to significantly improve the utility of the NCSES survey data and open a wide range of applications for research and program evaluation. This paper outlines the matching process and identifies potential opportunities for future research to utilize the matched set. Ultimately, such data resources can aid NSF in fulfilling its goals under the Evidence Act and in building a culture of evidence-based planning and policymaking.
Data Sources and Preparation
NSF funds research and education in all fields of S&E, through grants, contracts, and cooperative agreements. The foundation accounts for nearly a quarter of federal obligations for basic research performed by U.S. academic institutions (see NCSES report Federal Funds for Research and Development: Fiscal Years 2019–20: table 27). To conduct this analysis, several variables were obtained from the NSF awards database and the NCSES SDR.
National Science Foundation Awards Database
The public NSF awards database includes data on all active and expired awards funded by the foundation. The complete database is available in bulk via API and XML downloads. Differences in field availability exist between the API and XML. Specifically, the XML files reflect what is available on the NSF website, with a total of 464,647 award records at the time of access (spring 2020). The NSF awards database classifies awards by award instrument, funding directorate or office and division, and several field and program reference attributes. Summary data on how NSF awards are classified on these dimensions, as well as two new classifications developed for this project, are provided in Appendix A: NSF Awards Summary Data.
In the XML file, two substructures are utilized in this matching project: Investigators, and Institutions. The Investigator block contains the following elements for each investigator on an award as follows:
- First name
- Last name
- E-mail address
- Start date
- End date
- Role code—Principal Investigator (PI), Co-Principal Investigator (co-PI), Former PI, or Former Co-PI.
All NSF awards have an assigned PI and may have one or more co-PIs. Awards may be transferred to new PIs (or co-PIs), in which case the existing PI in the record will be reclassified into the role code former PI, and the new PI added to the record. Each PI and co-PI had an associated institution.
The Institution block contained the following elements for each awardee institution:
- Name
- City
- ZIP code
- Phone number
- Street address
- Country
- State name
- State abbreviation
The resulting data set included 700,488 records in which each award may have had multiple rows—one for each PI or co-PI that was extracted from the XML files. Fifty-two awards with malformed XMLs were removed, as were 82 duplicate records that matched on all the above data elements, leaving a total of 700,354 unique records.
Data Cleaning
The NSF awards database required extensive cleaning prior to matching. A small number of award records included the name of a PI twice—one record marked as PI, and another record marked as former PI (about 4%). Therefore, it was necessary for matching to create a unique list of award number, first name, last name, and e-mail address field to be used for matching.
After removing the role code, start date, and end date columns, deduplication was performed on the award, name, and e-mail entries. This resulted in 695,261 award-investigator pairs representing 455,552 unique awards.
The NSF awards database has coverage of awards dating back to 1959. Data quality issues plagued some of the pre-1973 award dates. A combination of manual coding based on the award number, the “minimum letter amended date” field, and “award effective date” was used to determine award year. For example, award 7723272 is listed with an award effective date of 10 January 1917, so its initial amendment date of 14 December 1977 was used instead. Thirteen remaining awards were assigned a start date based on the first two letters in the award number. For the vast majority of the data, the year value in the “award effective date” field was used.
A full e-mail address (meaning at least X@Y.Z) was used for 85.5% of records, 14.4% had no e-mail information, and very few (0.1%) had partial information or server information. However, noise in the e-mail address field necessitated extensive cleaning. For example, some award-investigator pairs had two e-mail addresses in the e-mail address field for one award, while other award-investigator pairs had multiple entries to account for multiple e-mail addresses. Therefore, observations with multiple e-mail addresses in the e-mail address field were split into as many rows as e-mails, retaining the same award-investigator ID. In addition, the duplicate award and name entries were examined and assigned consistent award-investigator IDs so that the same person on the award was always assigned the same ID, even if multiple e-mail addresses (and, hence, observations) existed. The resulting data set was deduplicated, leaving 695,320 entries (because some award-investigator pairs have multiple e-mail addresses, they have multiple rows) representing 695,190 unique award-PI pairs and 455,552 unique awards.
Further cleaning was required on a small subset of records. Because some awards date back to before the adoption of modern e-mail, some e-mail address fields were bitnet or omninet addresses. Where possible with bitnet, the username and server formation were retained for use in matching. Some records were assigned a nonpersonal e-mail address, which is not useful for the person-person matching performed here; however, the server information was still retained for matching purposes. Other records required removal of spaces or unallowed special characters, as well as changing of erroneous commas into periods. These steps only applied to a small number of records, with over 99% requiring no cleaning.
A new derived data field, called “e-mail stem,” was created to match the NSF investigator e-mail field with the SDR respondent e-mail field. An email stem defined here refers to the organization plus domain type portion of the e-mail. E-mail stems were created using the value before the “@” and the last two segments of the text after the “@.” E-mails were stemmed manually using Excel functions, but this can also be done algorithmically.
Finally, special non-English language characters in investigator names were replaced with their English equivalents for standardization. Beyond this step, names were not cleaned.
Survey of Doctorate Recipients
The SDR provides demographic, education, and career history information from individuals with a U.S. research doctoral degree in a science, engineering, or health (SEH) field. The SDR is sponsored by NCSES and the National Institutes of Health (NIH). Conducted since 1973, the SDR is a unique source of information about the educational and occupational achievements and career movement of U.S.-trained doctoral scientists and engineers in the United States and abroad.
The SDR restricted-use data reside on a secure data enclave, accessed through secure credentials. The personally identifiable information (PII) used in this project is only available to a very small number of individuals and is only accessed through contractual mechanisms and a restricted-use data license. This project used the results from the 2015 SDR, which consists of 78,320 respondents, representing 920,050 U.S.-residing and 127,800 non-U.S.-residing doctoral scientists and engineers that meet the following criteria:
- Earned an SEH research doctorate degree from a U.S. academic institution prior to 1 July 2013.
- Are not institutionalized or terminally ill on 1 February 2015.
- Are less than 76 years of age as of 1 February 2015.
Most SDR records (REFID) contain multiple e-mail address fields. The SDR data set was manipulated to create a new row for each e-mail address listed within a particular record. To do this, an e-mail matching list was created by flattening this structure to give each e-mail address its own observation associated with the REFID. Not every SDR respondent had an entry for e-mail; therefore, this action resulted in a data set with 135,493 rows representing 73,985 unique REFIDs.
Data Cleaning
Only minor special character replacement was necessary on the SDR data set. E-mail addresses were stemmed in the same way as the e-mail addresses in the NSF awards data set. E-mail addresses that were found to be erroneous during quality assurance work were recorded in a separate file, and the e-mail addresses were removed by the code during matching. Additionally, all data were turned to uppercase.
Approach
Matching was performed sequentially using deterministic methods in the following steps. The outcome of the matching process is a list of NSF awards linked to an SDR respondent (REFID). At the end of each matching step, the matched award-investigator IDs were used to subset the universe of potential matches, and the subsequent matching algorithms were applied to that subset of unmatched award-PI pairs. Probabilistic matching, such as fuzzy matching, was explored, but true differences in e-mails can be one letter. Names in both data sources were relatively clean, and experiments with fuzzy matching resulted in significantly more false positives than true positives. A list of the elements used to match between the data sets is shown below in table 1.
Data elements used for matching
NSF = National Science Foundation; SDR = Survey of Doctorate recipients.
a Initially, it was assumed that these e-mail addresses were the e-mail addresses the survey contractor used to communicate with the respondent, making it a very high-quality data element. However, during the matching process, it was observed that some e-mail addresses were clearly for other individuals besides the respondent. These e-mails may be connected to the alternate contacts in the record or co-principal investigators on grants.
Source(s):
National Center for Science and Engineering Statistics, Survey of Doctorate Recipients, 2015, linked to the public NSF Awards Database (https://www.nsf.gov/awardsearch/download.jsp).
Match Step
Match Step 1: Whole E-mails and Last Name
The first step in the matching process compared cleaned e-mail addresses in the SDR and NSF data sets. A direct match was considered to be a true positive, as it is highly unlikely that two separate individuals in this small subset would have the exact same e-mail address over time. In the process of this first match step, incorrect e-mails were identified in both the SDR and NSF data sets through manual review. These e-mails were manually removed to prevent inaccurate matches.
The presence of incorrect e-mails indicated that e-mail address itself cannot be a sole link between two records. Therefore, an exact match on the last name was also required. The remaining 10 steps in the matching process utilize both the Doctorate Records File (DRF) last name and the 2015 SDR last name. These fields were cycled through each step that used last name as a matching variable. The same process was undertaken for first names in the steps that utilize first names.
Match Step 2: Stemmed E-mails, First Name, Last Name
E-mail addresses were reduced to their stems and matched. A last name match and first name match were also required.
Matching on first names required additional actions. The SDR respondent data contain both the first name(s) and middle name(s) or initial(s) in the field. It cannot be assumed that two names in the field are first or middle names because some individuals have hyphenated names or two first names. Therefore, each first name match was performed first using the text before the space in the first name column and then matched using the whole text of the field, including spaces.
Match Step 3: First Name, Last Name, and E-mail Server
The e-mail institution information (e.g., sri.com) can provide high-quality information about an individual’s institution and does not suffer from the variety of ways an institution can be listed. The following high-frequency e-mail servers were filtered out: gmail.com, hotmail.com, yahoo.com, aol.com, verizon.net, and comcast.net.
Match Step 4: First Name, Last Name, and Employer ZIP to Award Institution ZIP
This step performed an exact match on the first name, last name, and the SDR employer ZIP to the award institution ZIP.
Match Step 5: First Name, Last Name, and Respondent ZIP to Award Institution ZIP
This step performed an exact match on the first name, last name, and the SDR respondent ZIP to the award institution ZIP.
Match Step 6: First Name, Last Name, and Respondent DRF ZIP to Award Institution ZIP
This step is the same as step 5 but also used respondents’ DRF ZIP.
Match Step 7: First Name, Last Name, and Employer City to Award Institution City
This step performed an exact match on the first name, last name, and the SDR respondent employer city and the award institution city.
Match Step 8: First Name, Last Name, and Respondent City to Award Institution City and State
This step performed an exact match on the first name, last name, and the state and city of the SDR respondent and the grant institution.
Match Step 9: First Name, Last Name, and Respondent DRF City to Award Institution City
This step performed an exact match on the first name, last name, and the SDR respondent DRF city and the award institution city.
Match Step 10: First Name, Last Name, and Employer to Award Institution
This step performed an exact match on the first name, last name, and the SDR respondent employer to the award institution.
Match Step 11: First Name, Last Name, and Respondent E-mail Institution to Award Institution
The SDR PII record contains historical e-mail addresses but not historical employers. It is likely that a subset of respondents obtained NSF awards while employed at other institutions. Therefore, these historical e-mail addresses provide information about past employers. To create an “after the @” (such as sri.com) to institution name (such as SRI International) crosswalk, institution names and investigator addresses from the NSF awards database were extracted and manually cleaned and filtered to 2,564 high-quality links between e-mail servers and institutions. This information was then appended to the SDR records using the “after the @” part of the e-mail stem. This final match step performed an exact match on the first name, last name, and the SDR appended institution affiliation name and the award institution name.
Quality Assurance
A review was completed for the underlying code used to conduct this analysis as well as an examination of the matched file in the restricted data environment. No issues were identified in the code. It was confirmed that the award-investigator pairs matched to REFIDs were appropriately flagged by match step, ensuring the number of matches reported in the results accurately reflect the matching steps that are described.
Results
Collated Matching Results by Match Step
Table 2 shows the collated results of the matching process by match step. Seven percent of unique awards in the NSF awards database were matched to an SDR respondent, and 9% of the 2015 SDR respondents were matched to an NSF award. The vast majority of matches occurred in the initial e-mail-based portion (steps 1 and 2) of the process. The presence of e-mail addresses increased the likelihood of a match. Only 1% of respondents without at least one e-mail address were matched to an NSF award, compared to 11% of respondents with e-mail addresses.
Collated matching results
NSF = National Science Foundation.
Note(s):
Match steps 10 and 11 are combined for disclosure purposes.
Source(s):
National Center for Science and Engineering Statistics, Survey of Doctorate Recipients, 2015, linked to the public NSF Awards Database (https://www.nsf.gov/awardsearch/download.jsp).
Distribution of Matched NSF Award-Investigator Pairs by Award Year
Figure 1 shows the number of matched award-investigator pairs by award year. The vast majority of matched awards are from the last 30 years. This distribution reflects the general increase in the number of grants but also can be attributed to data quality related to e-mail addresses.
Distribution of matched NSF award-investigator pairs, by year: 1959–2021
| Award year | Number |
|---|---|
| 1959–72 | 7 |
| 1973 | 19 |
| 1974 | 39 |
| 1975 | 52 |
| 1976 | 71 |
| 1977 | 116 |
| 1978 | 120 |
| 1979 | 159 |
| 1980 | 166 |
| 1981 | 175 |
| 1982 | 161 |
| 1983 | 163 |
| 1984 | 217 |
| 1985 | 259 |
| 1986 | 270 |
| 1987 | 340 |
| 1988 | 359 |
| 1989 | 382 |
| 1990 | 417 |
| 1991 | 548 |
| 1992 | 551 |
| 1993 | 529 |
| 1994 | 620 |
| 1995 | 594 |
| 1996 | 613 |
| 1997 | 682 |
| 1998 | 718 |
| 1999 | 746 |
| 2000 | 870 |
| 2001 | 886 |
| 2002 | 970 |
| 2003 | 1,118 |
| 2004 | 1,004 |
| 2005 | 1,017 |
| 2006 | 1,088 |
| 2007 | 1,101 |
| 2008 | 1,167 |
| 2009 | 1,515 |
| 2010 | 1,450 |
| 2011 | 1,162 |
| 2012 | 1,201 |
| 2013 | 1,204 |
| 2014 | 1,206 |
| 2015 | 1,263 |
| 2016 | 1,278 |
| 2017 | 1,195 |
| 2018 | 1,127 |
| 2019 | 1,032 |
| 2020–21 | 104 |
NSF = National Science Foundation.
Source(s):
National Center for Science and Engineering Statistics, Survey of Doctorate Recipients, 2015, linked to the public NSF Awards Database (https://www.nsf.gov/awardsearch/download.jsp).
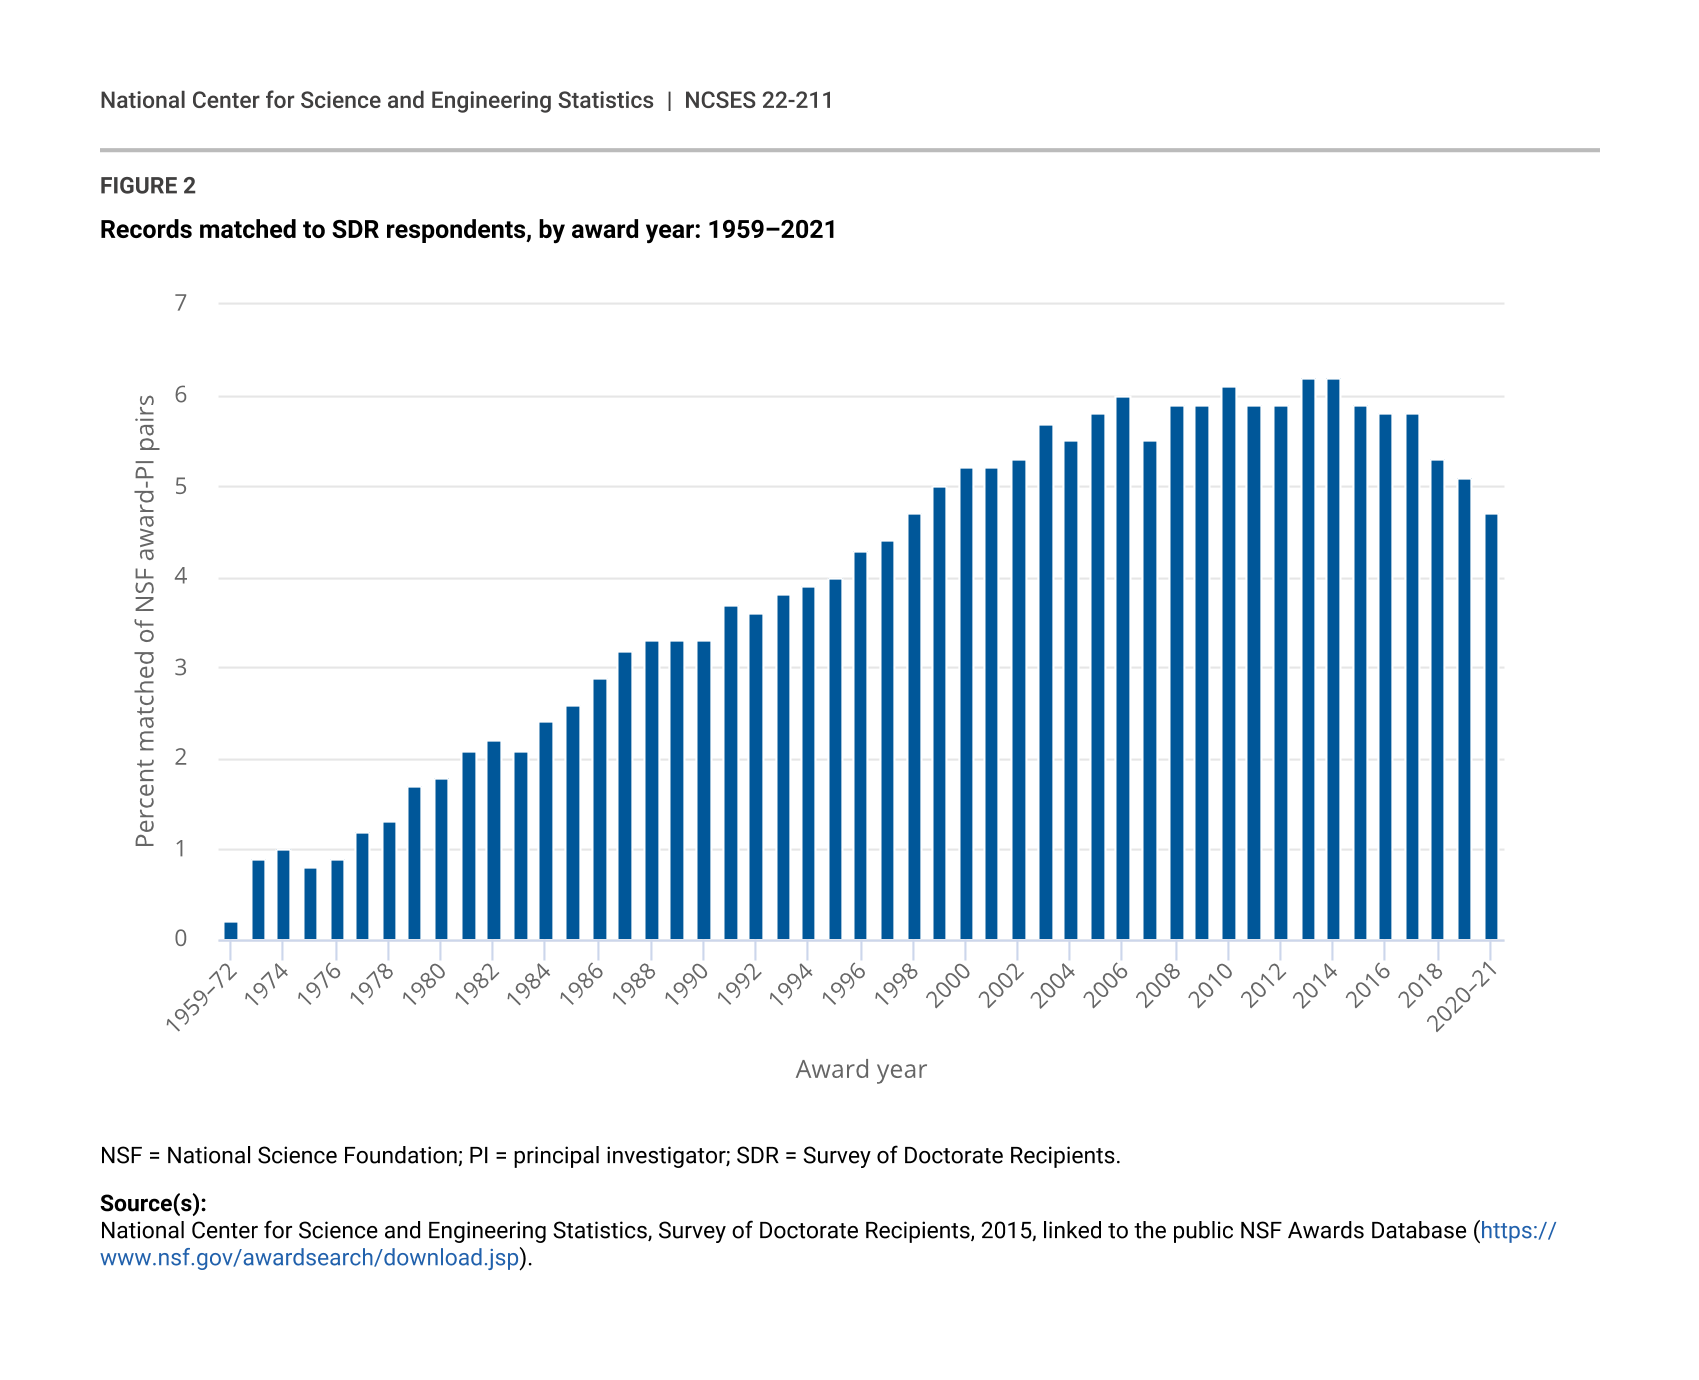
Percent of Records Matched by Award Year
The match rate by year ranged from a low of 0% in early years of the NSF awards data to a high of 6.2% of award-investigators pairs in 2013 and 2014 (figure 2). Overall, 4.6% of the award-investigators pairs were matched to an SDR respondent.
Records matched to SDR respondents, by award year: 1959–2021
| Award year | Percent matched of NSF award-PI pairs |
|---|---|
| 1959–72 | 0.2 |
| 1973 | 0.9 |
| 1974 | 1.0 |
| 1975 | 0.8 |
| 1976 | 0.9 |
| 1977 | 1.2 |
| 1978 | 1.3 |
| 1979 | 1.7 |
| 1980 | 1.8 |
| 1981 | 2.1 |
| 1982 | 2.2 |
| 1983 | 2.1 |
| 1984 | 2.4 |
| 1985 | 2.6 |
| 1986 | 2.9 |
| 1987 | 3.2 |
| 1988 | 3.3 |
| 1989 | 3.3 |
| 1990 | 3.3 |
| 1991 | 3.7 |
| 1992 | 3.6 |
| 1993 | 3.8 |
| 1994 | 3.9 |
| 1995 | 4.0 |
| 1996 | 4.3 |
| 1997 | 4.4 |
| 1998 | 4.7 |
| 1999 | 5.0 |
| 2000 | 5.2 |
| 2001 | 5.2 |
| 2002 | 5.3 |
| 2003 | 5.7 |
| 2004 | 5.5 |
| 2005 | 5.8 |
| 2006 | 6.0 |
| 2007 | 5.5 |
| 2008 | 5.9 |
| 2009 | 5.9 |
| 2010 | 6.1 |
| 2011 | 5.9 |
| 2012 | 5.9 |
| 2013 | 6.2 |
| 2014 | 6.2 |
| 2015 | 5.9 |
| 2016 | 5.8 |
| 2017 | 5.8 |
| 2018 | 5.3 |
| 2019 | 5.1 |
| 2020–21 | 4.7 |
NSF = National Science Foundation; PI = principal investigator; SDR = Survey of Doctorate Recipients.
Source(s):
National Center for Science and Engineering Statistics, Survey of Doctorate Recipients, 2015, linked to the public NSF Awards Database (https://www.nsf.gov/awardsearch/download.jsp).
Distribution of Awards Matched to SDR Respondents
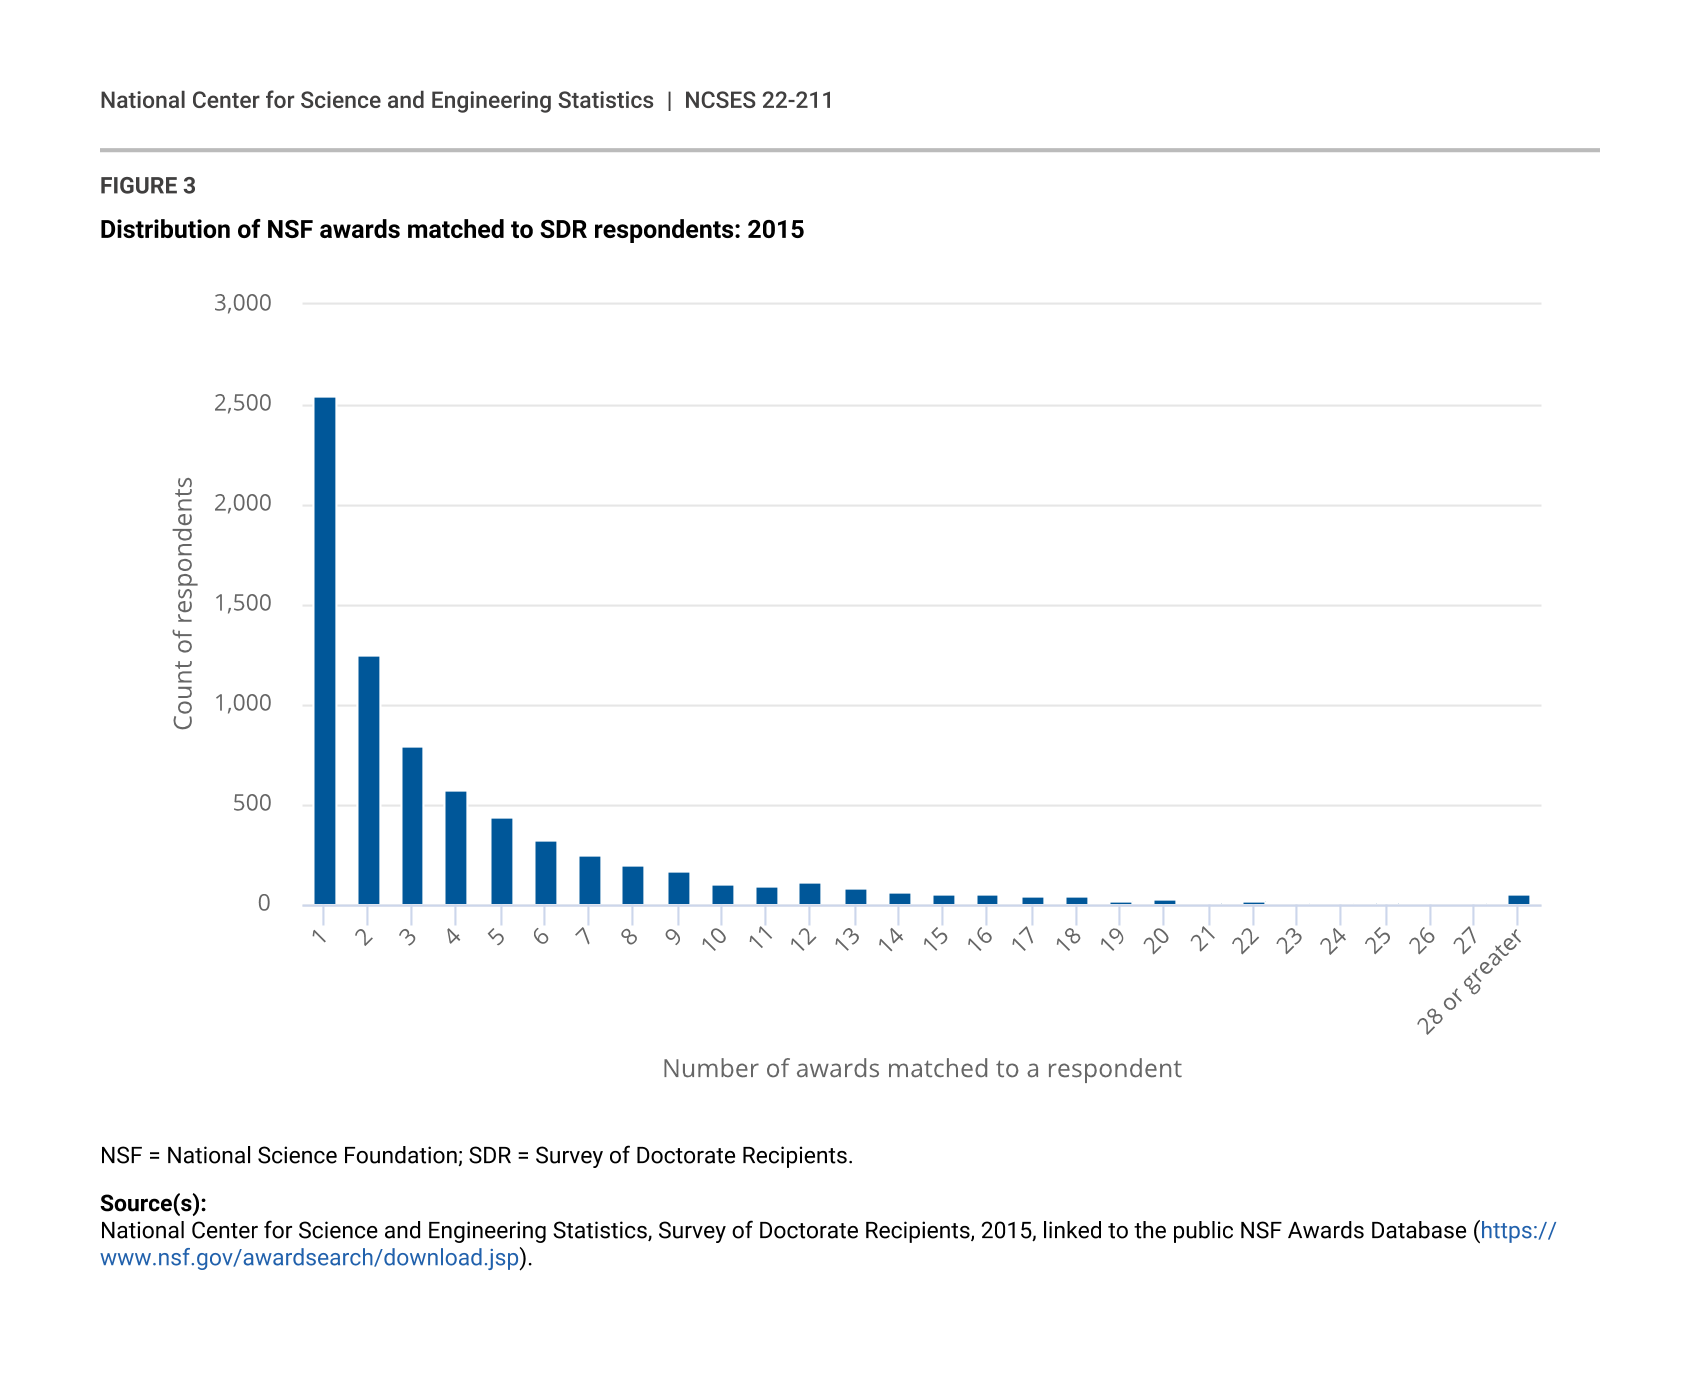
A total of 7,363 SDR respondents were matched to awards in the public NSF awards database. Figure 3 shows the distribution of the number of awards matched to individuals. Because of disclosure requirements, the exact number of awards matched in the tail of the distribution is not provided. These individuals were rolled up to 28 awards or more. An average of 4.4 awards were matched to each individual that was matched to any awards, though the median count is 2.0 awards.
Distribution of NSF awards matched to SDR respondents: 2015
| Number of awards matched to a respondent | Respondents |
|---|---|
| 1 | 2,537 |
| 2 | 1,255 |
| 3 | 788 |
| 4 | 568 |
| 5 | 439 |
| 6 | 325 |
| 7 | 250 |
| 8 | 202 |
| 9 | 164 |
| 10 | 107 |
| 11 | 98 |
| 12 | 111 |
| 13 | 79 |
| 14 | 65 |
| 15 | 51 |
| 16 | 47 |
| 17 | 46 |
| 18 | 40 |
| 19 | 25 |
| 20 | 27 |
| 21 | 15 |
| 22 | 23 |
| 23 | 11 |
| 24 | 13 |
| 25 | 13 |
| 26 | 5 |
| 27 | 11 |
| 28 or greater | 48 |
NSF = National Science Foundation; SDR = Survey of Doctorate Recipients.
Source(s):
National Center for Science and Engineering Statistics, Survey of Doctorate Recipients, 2015, linked to the public NSF Awards Database (https://www.nsf.gov/awardsearch/download.jsp).
Data and Methodological Limitations
This project was a proof-of-concept exploration of matching. Although matching was performed deterministically, match quality was not determined via a gold standard set to calculate precision and recall. However, some factors were considered as checks of match quality.
The difference between birth year and award year was examined and factored into the name commonality filter previously discussed that was applied to the initial results. The difference between the award start year and the matched SDR respondent’s doctorate year was also investigated. As shown in figure 4, the vast majority of the matches (99%) had a difference between the award year and doctorate calendar year of 0 or greater, meaning that the individual received an NSF award no earlier than the same year he or she received the doctorate. An ad hoc review of the negative values shown in the figure indicated that some individuals receive NSF awards prior to receiving their doctorate. A very small number of matches had award years more than 5 years prior to their degree years, which is likely the result of these individuals obtaining multiple doctorates.
Difference between award year and doctorate year
| Award year - degree year (years) | Count of matches | Cumulative percentage |
|---|---|---|
| -7 or less | 12 | 100.0 |
| -6 | 7 | 100.0 |
| -5 | 11 | 99.9 |
| -4 | 20 | 99.9 |
| -3 | 49 | 99.8 |
| -2 | 72 | 99.7 |
| -1 | 78 | 99.5 |
| 0 | 176 | 99.2 |
| 1 | 444 | 98.7 |
| 2 | 790 | 97.3 |
| 3 | 1,022 | 94.8 |
| 4 | 1,173 | 91.6 |
| 5 | 1,368 | 88.0 |
| 6 | 1,444 | 83.7 |
| 7 | 1,481 | 79.2 |
| 8 | 1,494 | 74.6 |
| 9 | 1,443 | 69.9 |
| 10 | 1,354 | 65.4 |
| 11 | 1,303 | 61.2 |
| 12 | 1,297 | 57.1 |
| 13 | 1,295 | 53.1 |
| 14 | 1,178 | 49.0 |
| 15 | 1,089 | 45.4 |
| 16 | 1,042 | 42.0 |
| 17 | 986 | 38.7 |
| 18 | 940 | 35.6 |
| 19 | 945 | 32.7 |
| 20 | 902 | 29.8 |
| 21 | 774 | 26.9 |
| 22 | 764 | 24.5 |
| 23 | 674 | 22.1 |
| 24 | 695 | 20.0 |
| 25 | 632 | 17.9 |
| 26 | 575 | 15.9 |
| 27 | 572 | 14.1 |
| 28 | 523 | 12.3 |
| 29 | 474 | 10.7 |
| 30 | 397 | 9.2 |
| 31 | 363 | 8.0 |
| 32 | 377 | 6.8 |
| 33 | 270 | 5.7 |
| 34 | 270 | 4.8 |
| 35 | 252 | 4.0 |
| 36 | 188 | 3.2 |
| 37 | 178 | 2.6 |
| 38 | 146 | 2.1 |
| 39 | 118 | 1.6 |
| 40 | 80 | 1.2 |
| 41 | 68 | 1.0 |
| 42 | 59 | 0.8 |
| 43 | 54 | 0.6 |
| 44 | 33 | 0.4 |
| 45 | 27 | 0.3 |
| 46 | 21 | 0.2 |
| 47 | 11 | 0.2 |
| 48 | 13 | 0.1 |
| 49 | 12 | 0.1 |
| 50 or greater | 16 | 0.0 |
SDR = Survey of Doctorate Recipients.
Note(s):
Data in this figure are calculated from 32,051 total matches.
Source(s):
National Center for Science and Engineering Statistics, Survey of Doctorate Recipients, 2015, linked to the public NSF Awards Database (https://www.nsf.gov/awardsearch/download.jsp).
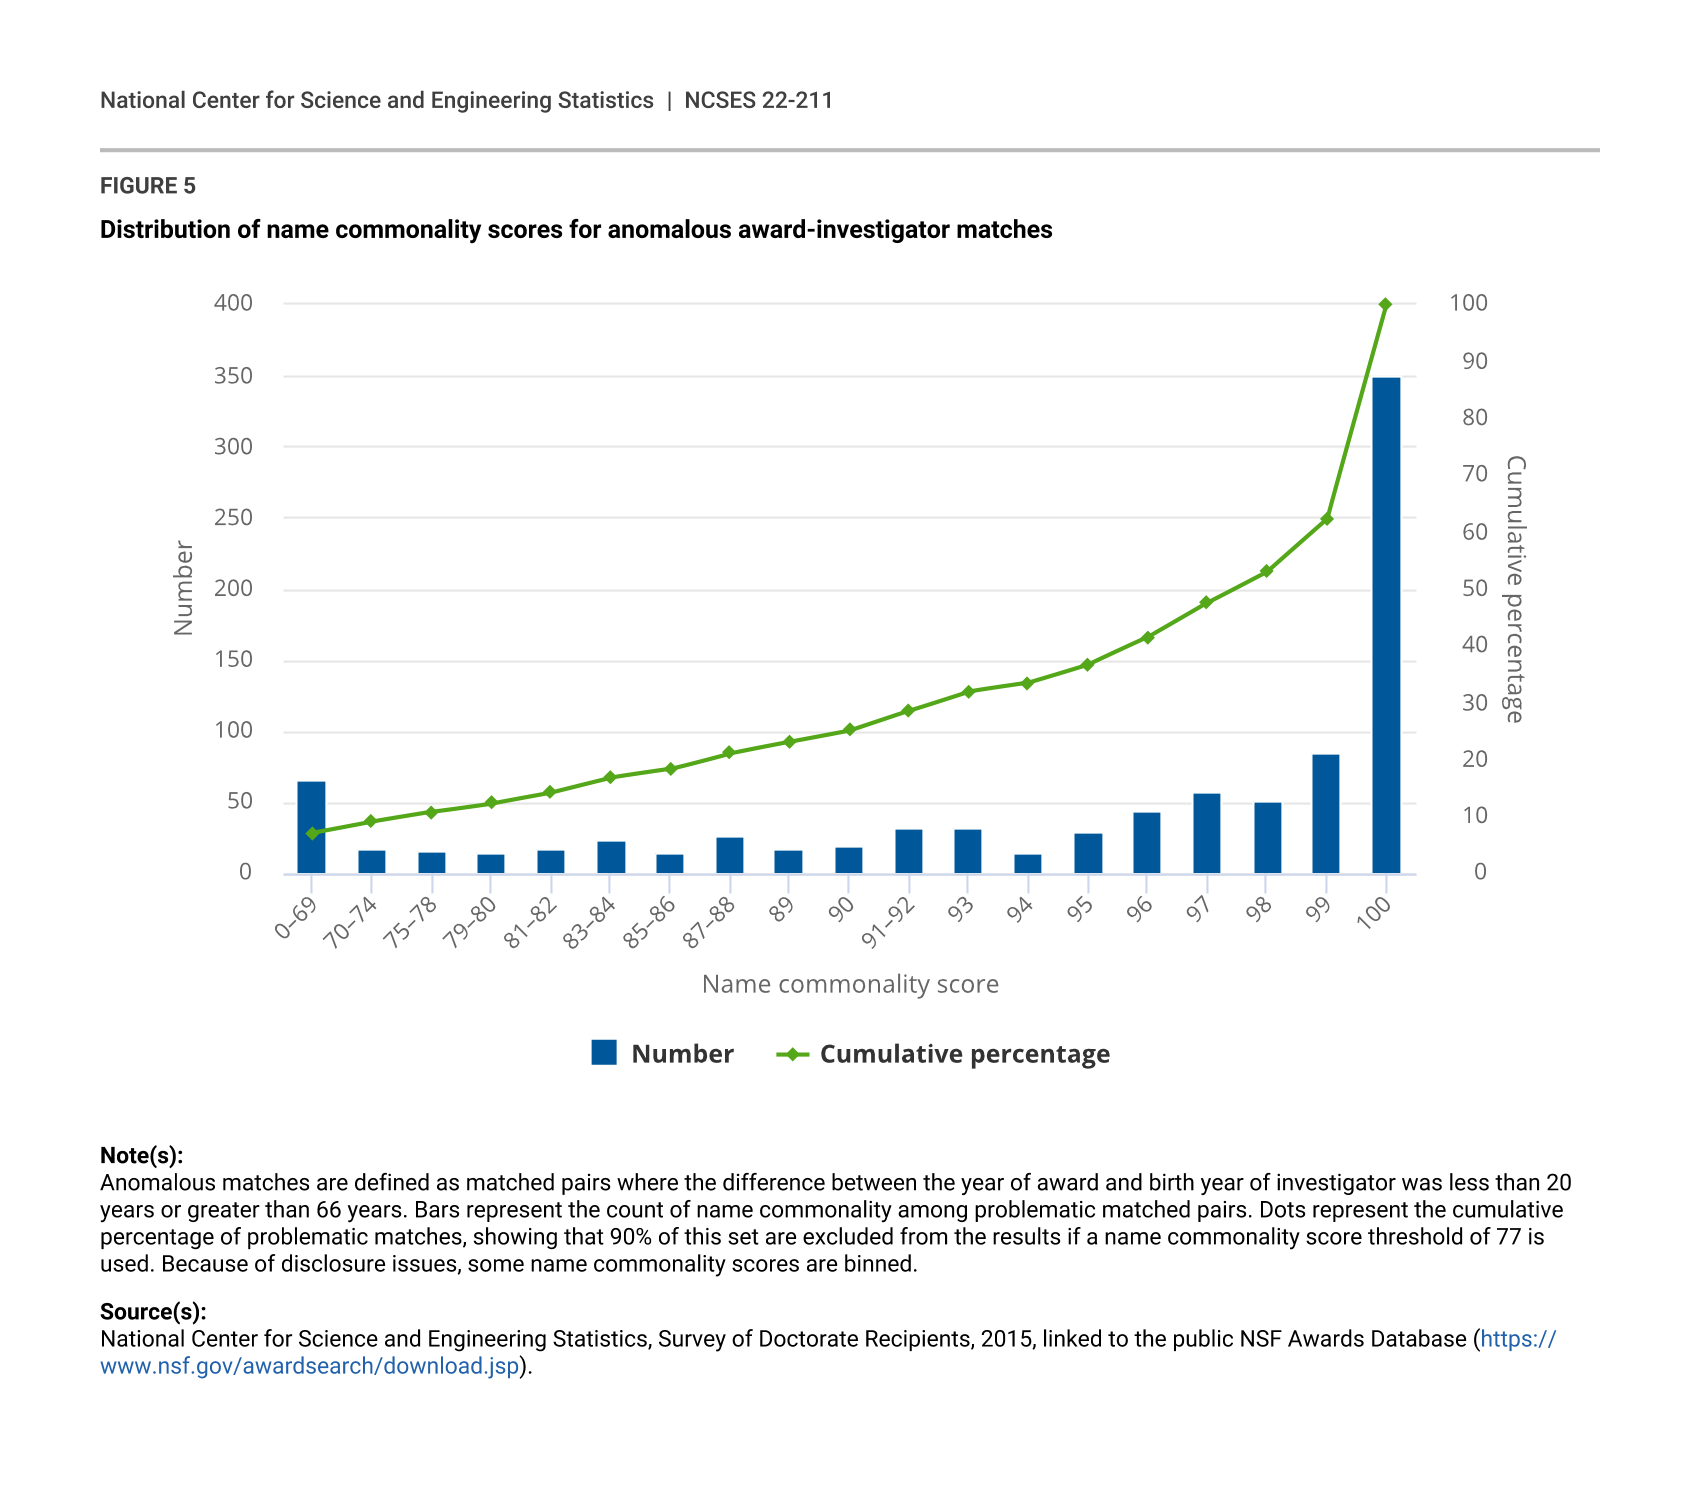
Analysis of initial results revealed a subpopulation that appeared to be receiving NSF awards in their 20s or earlier. These anomalies were concentrated where names were more common, as indicated by a name commonality score. The name commonality score is defined here as the natural log of the frequency of a last name contained in the NSF awards database divided by the count of all names. This score was then divided into 100 levels, with higher levels for more common names. After initial matching was performed, potentially problematic matches were reviewed if the difference between the award year and the birth year was less than 20 or greater than 66. The number of these pairs is plotted in figure 5 as a function of the name commonality score.
Distribution of name commonality scores for anomalous award-investigator matches
| Name commonality score | Number | Cumulative percentage |
|---|---|---|
| 0–69 | 66 | 7.1 |
| 70–74 | 18 | 9.1 |
| 75–78 | 16 | 10.8 |
| 79–80 | 14 | 12.3 |
| 81–82 | 18 | 14.2 |
| 83–84 | 24 | 16.8 |
| 85–86 | 14 | 18.3 |
| 87–88 | 26 | 21.1 |
| 89 | 18 | 23.1 |
| 90 | 19 | 25.1 |
| 91–92 | 32 | 28.6 |
| 93 | 32 | 32.0 |
| 94 | 14 | 33.5 |
| 95 | 30 | 36.7 |
| 96 | 44 | 41.5 |
| 97 | 57 | 47.6 |
| 98 | 51 | 53.1 |
| 99 | 85 | 62.3 |
| 100 | 350 | 100.0 |
Note(s):
Anomalous matches are defined as matched pairs where the difference between the year of award and birth year of investigator was less than 20 years or greater than 66 years. Bars represent the count of name commonality among problematic matched pairs. Dots represent the cumulative percentage of problematic matches, showing that 90% of this set are excluded from the results if a name commonality score threshold of 77 is used. Because of disclosure issues, some name commonality scores are binned.
Source(s):
National Center for Science and Engineering Statistics, Survey of Doctorate Recipients, 2015, linked to the public NSF Awards Database (https://www.nsf.gov/awardsearch/download.jsp).
As shown in the figure, many of the problematic matches have a name commonality score of above 70. A name commonality threshold of 77 was chosen to remove 90% of the problematic matches. This filter was applied to all matching steps except in steps where an e-mail address was used, as an e-mail match is of high quality. Results were ultimately filtered to those individuals with a difference between their NSF award year and birth year of greater than 20 (three false-positive matches were filtered out at this step).
The NSF public awards database contains information on PIs or co-PIs at the moment the data are collected. Similarly, data of the SDR respondents reflect employment information reported for the 2015 survey reference period. Without having complete longitudinal affiliation data, the matching algorithm will miss cases where a respondent obtains an NSF award at an institution different from his or her PhD institution or his or her employer institution at time of response to the SDR. This recall error may vary by career stage because level of mobility of research doctorate holders can change over time. For example, early career doctorate holders and those taking postdoctoral researcher (postdoc) positions are likely to experience job changes more often than tenured professors.
Use Cases
Here, we provide two use cases of the matched data set produced for this project. First, the NSF administrative data on awardees are used as a benchmark for survey data quality—specifically, reporting of NSF support by SDR respondents. Second, the linked data set is used to make inferences on patterns of NSF support among the larger SEH doctorate holder population (with the caveats stated in the previous section).
Comparison of Survey and Administrative Data on NSF Support
The matching procedure utilized data elements in the SDR and NSF awards database to match SDR respondents to NSF investigators. SDR respondents’ reporting of NSF support for their research in the survey allows for some comparisons between the survey data and the administrative data. This comparison can be used to generate reference precision and recall values for the matched data set.
The SDR asks respondents if they had been supported by NSF funding in the previous year. The reference year for this data set is 2015, and the standard NSF award is 3 years; therefore, awards that started in 2012 could reasonably be expected to be supporting the respondent.
Precision
Between 78% and 81% of individuals matched to NSF awards in each year from 2012 to 2014 reported NSF support of their work on the 2015 SDR. An ad hoc review of matched individuals who answered that they did not receive federal support for their work or did not select NSF as a specific federal source did not show a conclusive pattern to explain the discrepancy. The reviewed matches are correct matches, and the NSF projects ranged from research work to scholarship programs.
There are many plausible reasons why the precision is not higher; without cognitive testing of how individuals interpret this survey question, however, it is difficult to draw any specific conclusions. Individuals can be named as the PI on grants but may not work on the project on a level for the respondent to consider their work to “be supported.” This may be more common for award types focused on training and education of graduate and undergraduate students. For example, 80% of individuals matched to NSF awards classified under the research funding program reported NSF support on the SDR, but only 70% of those matched to training awards did so. (See appendix table A-7 for more details on funding program categories.) In these cases, PIs may be professors, and their students and research staff would be supported by the grant. It is not clear how professors would answer this question on the SDR in cases that they are the PI on a grant but do not charge time to the grant.
Correspondence between the survey and administrative data may be increased if survey respondents with imputed values on the SDR question of NSF support are excluded from the comparison. Approximately 10% of SDR respondents’ values for NSF support are imputed; among those individuals matched to investigators of NSF awards from 2012 to 2014, the imputation rate on this question is 9%. Limiting the comparison to only individuals without imputed values results in slightly higher precision: 83% of respondents matched to NSF awards in this 3-year period reported NSF support on the survey. Including all individuals regardless of imputation, 79% of those who were matched to NSF awards reported NSF support on the SDR. For the relatively small number of individuals with missing data who were also matched to an NSF award, 33% were imputed as having received NSF support.
Recall
For the reference year 2015, there were 4,915 individuals who responded that they had received NSF support for their work. Within this group, 59% were matched to an investigator on an NSF award, and 41% were not. These low values are not surprising because many researchers work on awards on which they are not the PI or the co-PI. In addition, there is some imputation in the data set for this flag.
Inspection of the academic job classification of those that reported NSF support but were not matched to an award revealed that teaching faculty were most likely to be matched to at least one award (75% of those who indicated NSF support were matched). Those who indicated they are a research assistant, teaching assistant, or postdoc had a much lower match rate—only 18% of those individuals were matched.
Patterns of NSF Support in the SEH Doctorate Holder Population
This project used data from the 2015 SDR, which consists of 78,320 respondents, representing 920,050 U.S.-residing and 127,800 non-U.S.-residing doctoral scientists and engineers. By examining attributes of the 7,363 SDR respondents matched to investigators of NSF awards, inferences can be made on patterns of NSF support among the SDR target population of SEH doctorate holders. The estimates below are produced using the final survey-specific weights. Note that references to receipt of NSF support in this section include only those reported as PIs and co-PIs in the NSF awards database. Estimates presented in figure 6 through figure 9 and in table 3 are expected to underestimate the true population characteristics, such as the share of doctorate holders receiving NSF awards and the average number of NSF awards received, largely due to the recall errors discussed in Data and Methodological Limitations. However, we believe the patterns of NSF support in relative scales across the major doctorate field of study remain informative. We present the analysis below as illustrative examples of potential utility of this type of research data and hope these examples motivate future research on improving the source data for matching and for the matching methodology.
NSF awards in the SEH doctorate population, by major field of first doctorate
| Major field | Percent receiving NSF awards | Average number of awards |
|---|---|---|
| Life sciences | 7.1 | 3.8 |
| Computer sciences | 16.9 | 5.7 |
| Engineering | 9.4 | 4.8 |
| Health | 1.3 | 1.6 |
| Mathematics | 14.6 | 5.2 |
| Physical sciences | 12.7 | 5.2 |
| Psychology | 2.8 | 2.5 |
| Social sciences | 6.9 | 3.0 |
| All fields | 8.3 | 4.4 |
NSF = National Science Foundation; SEH = science, engineering, and health.
Source(s):
National Center for Science and Engineering Statistics, Survey of Doctorate Recipients, 2015, linked to the public NSF Awards Database (https://www.nsf.gov/awardsearch/download.jsp).
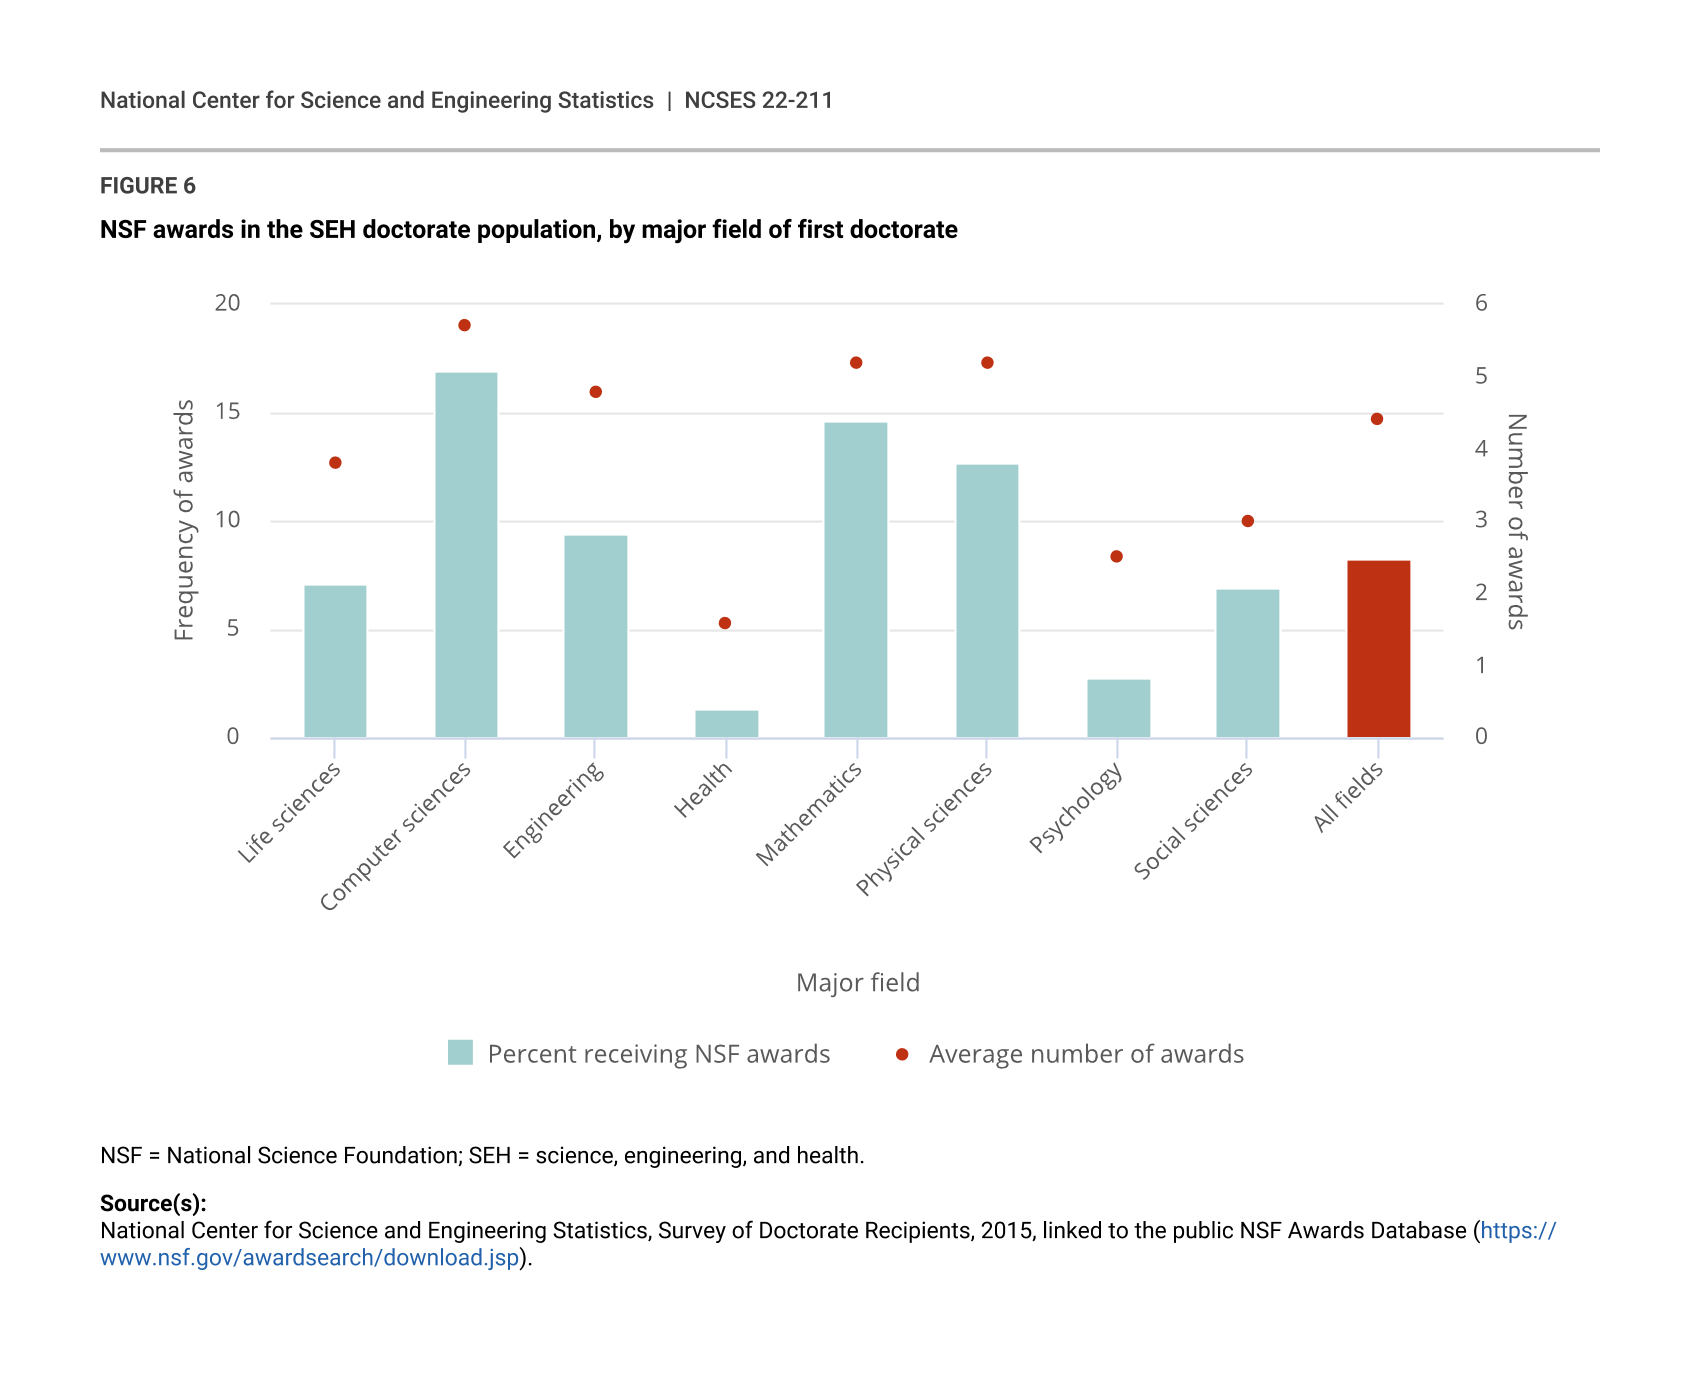
NSF Support by Doctorate Field of Study
An estimated 8.3% of SEH doctorate holders have received NSF awards as PIs and co-PIs, for whom the average award count is 4.4. As indicated in figure 6, levels of NSF support vary significantly by major field of doctorate, with individuals with computer and information science doctorates having the largest estimated share receiving an award (16.9%) and the highest average number of awards (5.7). In addition to computer sciences, mathematics and statistics and physical sciences doctorates also had higher than average levels of NSF support. Engineering doctorate holders experienced higher rates of NSF support than those in the social sciences (9.4% vs. 6.9%), as well as higher average award counts (4.8 vs. 3.0). Individuals with doctorates in psychology and health had much lower than average levels of NSF support, with those in health fields having the lowest rate of support (1.3%) and average number of awards (1.6). The particularly low level of NSF support among health doctorate holders is plausible, given the primary role of NIH rather than NSF in funding research in this field (see NCSES report Federal Funds for Research and Development: Fiscal Years 2019–20: table 23). Standard errors for estimated shares receiving NSF awards by doctorate field of study are provided in appendix table B-1.
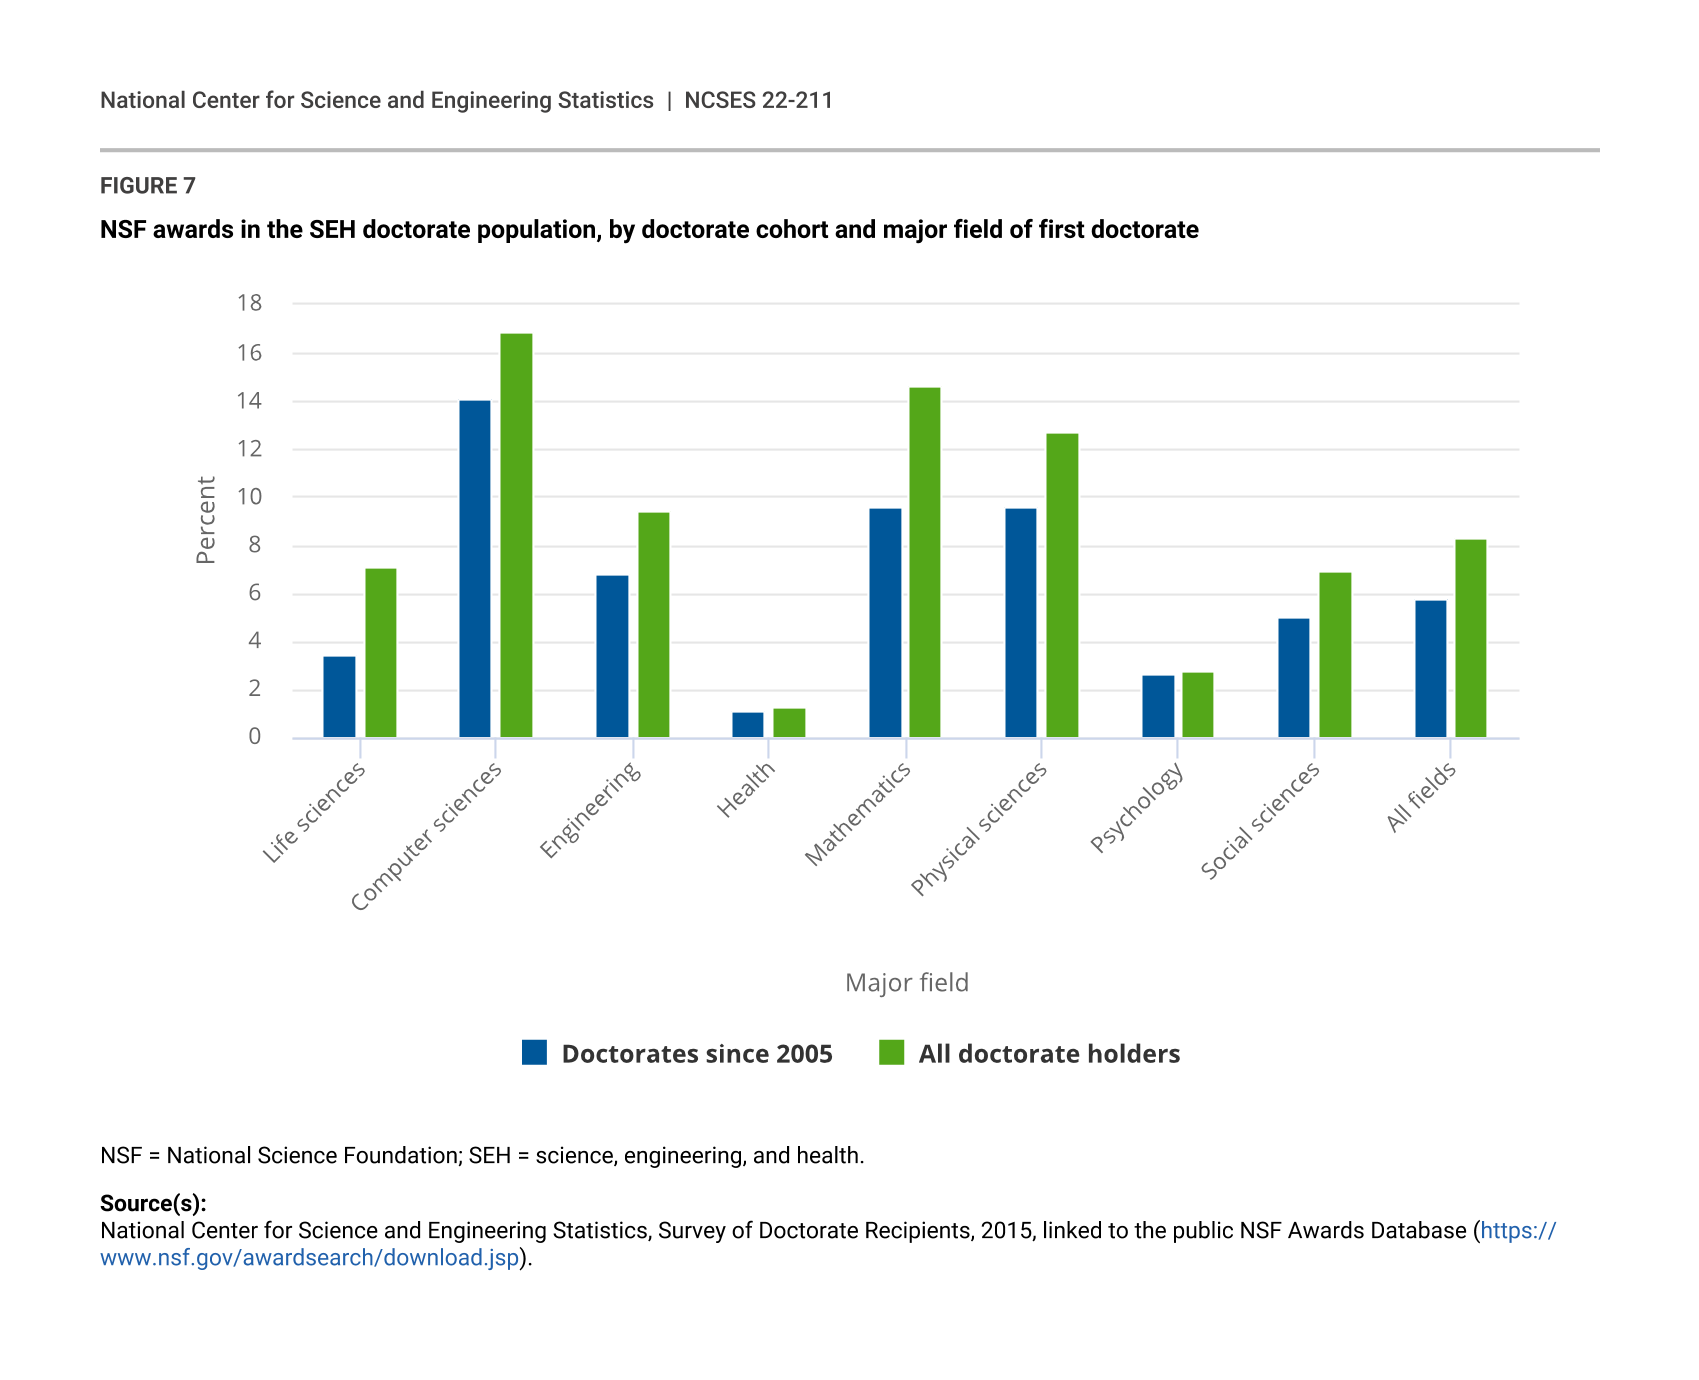
Limiting the analysis to SDR respondents receiving doctorates in more recent years may provide more timely measures of NSF support. When only considering individuals receiving doctorates in 2005 or later, a few key observations are made. As expected, both the share of doctorate holders receiving awards (from 8.3% to 5.8%) and average number of awards (from 4.4 to 2.5) are lower. These two measures decline for all major fields of doctorate. Although the gap between fields is reduced, the same overall pattern by field is observed. Namely, the estimated shares of doctorate holders in computer and information sciences, mathematics and statistics, and physical sciences are highest, and shares for psychology and health are lowest. Rates of NSF support for doctorate holders in other fields are closer to the average of 5.8% (appendix table B-1).
NSF awards in the SEH doctorate population, by doctorate cohort and major field of first doctorate
| Major field | Doctorates since 2005 | All doctorate holders |
|---|---|---|
| Life sciences | 3.5 | 7.1 |
| Computer sciences | 14.1 | 16.9 |
| Engineering | 6.8 | 9.4 |
| Health | 1.1 | 1.3 |
| Mathematics | 9.6 | 14.6 |
| Physical sciences | 9.6 | 12.7 |
| Psychology | 2.7 | 2.8 |
| Social sciences | 5.0 | 6.9 |
| All fields | 5.8 | 8.3 |
NSF = National Science Foundation; SEH = science, engineering, and health.
Source(s):
National Center for Science and Engineering Statistics, Survey of Doctorate Recipients, 2015, linked to the public NSF Awards Database (https://www.nsf.gov/awardsearch/download.jsp).
NSF Support by Employment Sector
Levels of NSF support have a strong relationship to doctorate holders’ employment sector (figure 8; appendix table B-2). As expected, individuals employed by a 4-year college, university, or university-affiliated research institution are vastly more likely to receive NSF support (18.3%) than those employed in any other sector. The sector with the next highest share, private nonprofit organizations, was less than a quarter (4.3%) of this level. Self-employed individuals, and those working in the for-profit industry and in state, local, or non-U.S. governments had the lowest rates of NSF support, with shares between 1.0% and 1.3%.
Notably, the share of individuals in a sector receiving NSF support was not predictive of the average award count of those that did receive an NSF award in that sector. For example, average award count per matched respondent was higher for those employed in the nonprofit sector (5.9) than for those employed by 4-year colleges (4.5), despite the latter being more likely to receive an NSF award. Likewise, the average number of NSF awards for self-employed individuals receiving NSF support (4.5) was far greater than the average for those employed in state or local government (1.8), even though the share receiving support was very similar for these sectors.
NSF awards in the SEH doctorate population, by employment sector
| Employment sector | Percent receiving NSF awards | Average number of awards |
|---|---|---|
| 2-year college | 3.3 | 1.9 |
| 4-year college, university, or research institution | 18.3 | 4.5 |
| For-profit industry | 1.0 | 2.8 |
| Nonprofit | 4.3 | 5.9 |
| Self-employed | 1.1 | 4.5 |
| Federal government | 2.5 | 3.5 |
| Non-U.S. government | 1.0 | 2.9 |
| State or local government | 1.3 | 1.8 |
NSF = National Science Foundation; SEH = science, engineering, and health.
Source(s):
National Center for Science and Engineering Statistics, Survey of Doctorate Recipients, 2015, linked to the public NSF Awards Database (https://www.nsf.gov/awardsearch/download.jsp).
NSF Support by Demographic Characteristics
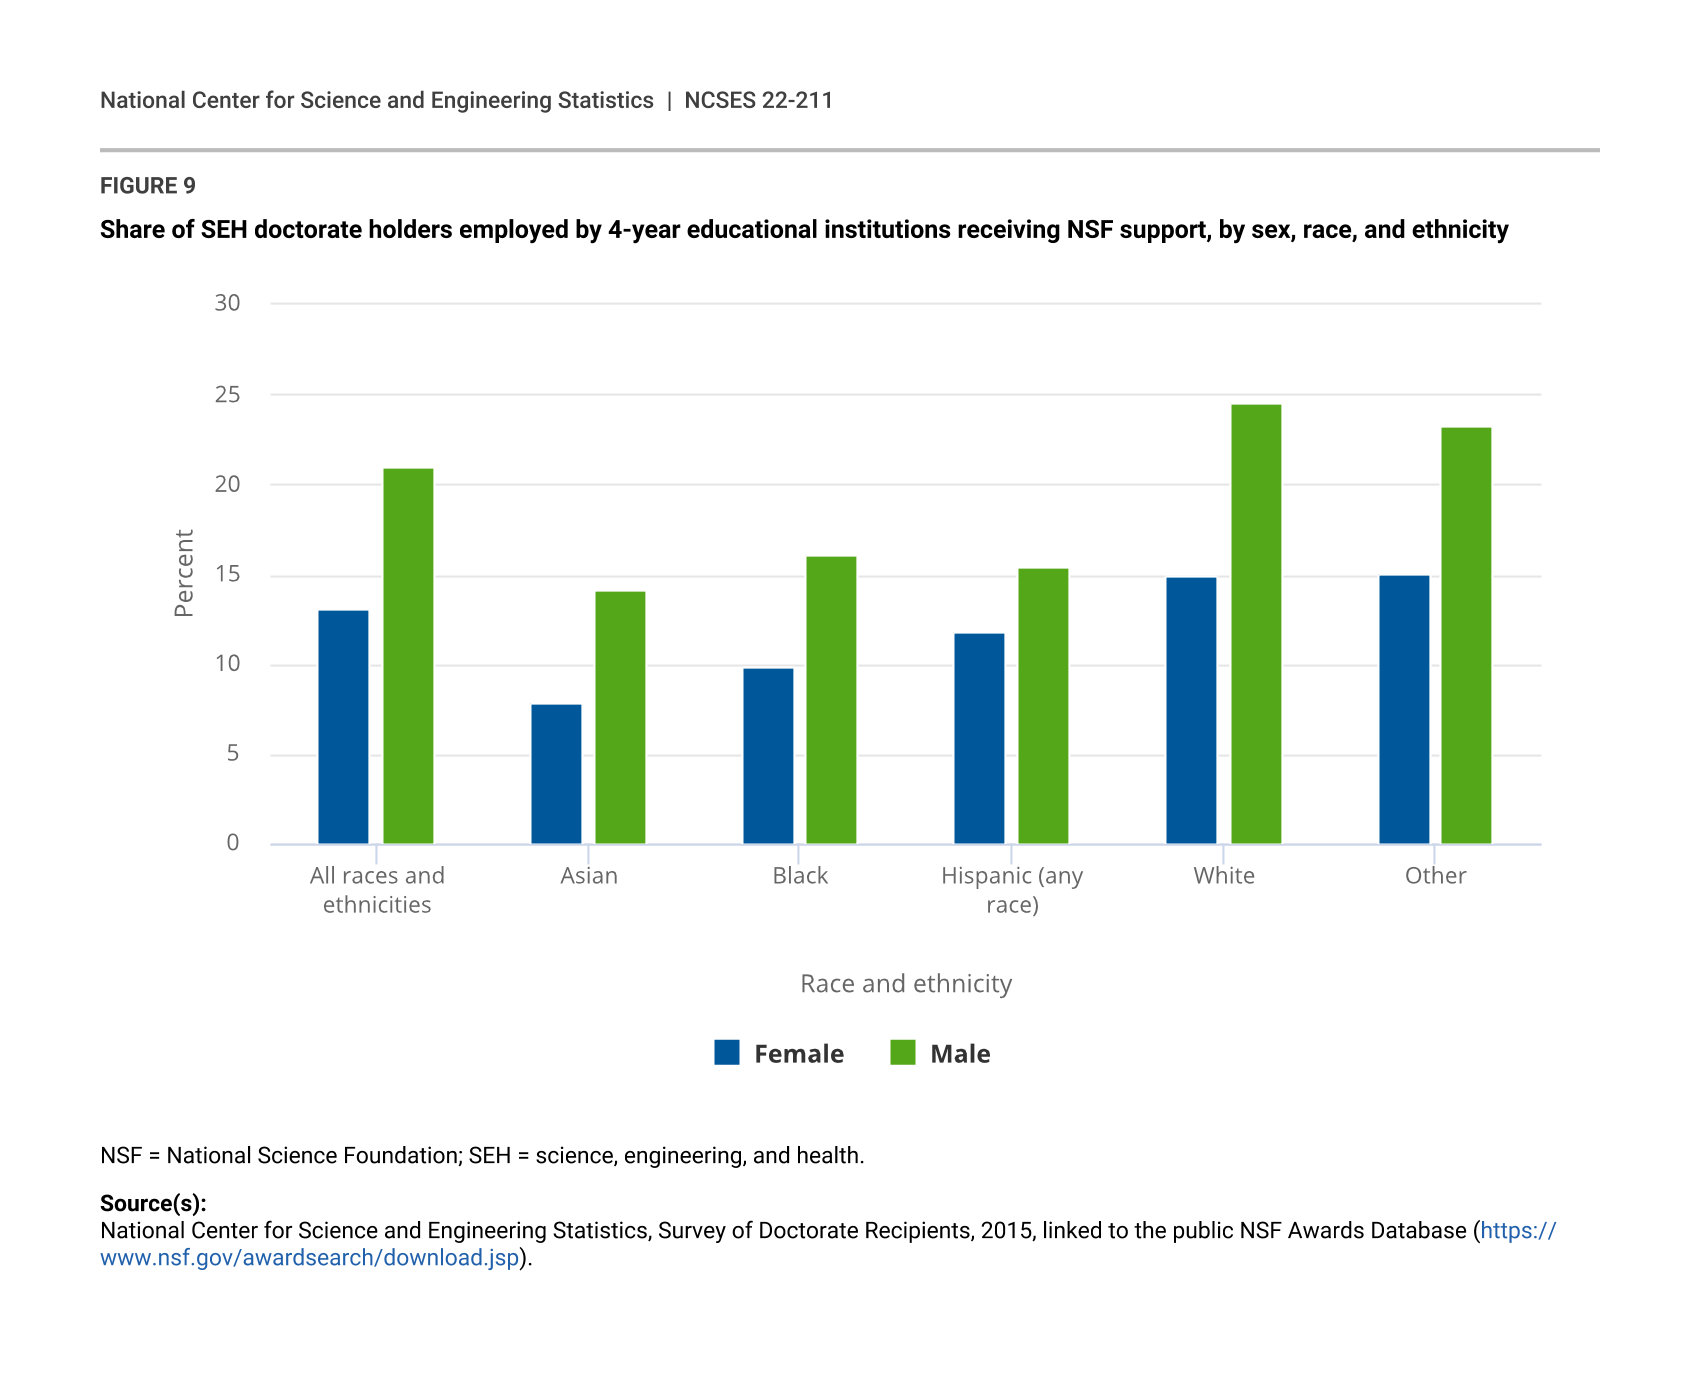
The estimated share of doctorate holders who have served as PIs and co-PIs on NSF awards differs by demographic characteristics (table 3 and appendix table B-3). Men were more likely (9.3%) than women (6.2%) to receive NSF support overall and in the 4-year colleges and universities employment sector (21.0% vs. 13.1%). Within the university sector, white men were the specific group with highest shares receiving an NSF award (24.5%). The estimated share for individuals of Other race (inclusive of American Indian or Alaska Native, Native Hawaiian or Pacific Islander, and multiple race), was 9.4% across all sectors and 19.8% for the university sector, roughly similar to the shares (8.3% and 18.3%, respectively) for the overall doctorate population. However, Asians had the lowest rates of NSF support, particularly Asian females, with 3.6% across all sectors and 7.9% in 4-year colleges and universities receiving NSF support.
The share of individuals receiving NSF support is estimated to be much higher (at least double) for those employed by 4-year colleges and universities for nearly every sex, race, or ethnicity group. As shown in Figure 9, in this sector men had higher rates of NSF support than women across all races.
NSF awards in the SEH doctorate population, by employment sector, sex, race, and ethnicity
NSF = National Science Foundation; SEH = science, engineering, and health.
Note(s):
Other includes American Indian or Alaska Native, Native Hawaiian or Pacific Islander, and multiple race. Hispanic may be any race; Asian, Black, and White exclude Hispanic origin. The 4-year educational institution sector includes 4-year colleges or universities, medical schools (including university-affiliated hospitals or medical centers), and university-affiliated research institutions.
Source(s):
National Center for Science and Engineering Statistics, Survey of Doctorate Recipients, 2015, linked to the public NSF Awards Database (https://www.nsf.gov/awardsearch/download.jsp).
Share of SEH doctorate holders employed by 4-year educational institutions receiving NSF support, by sex, race, and ethnicity
| Race and ethnicity | Female | Male |
|---|---|---|
| All races and ethnicities | 13.1 | 21.0 |
| Asian | 7.9 | 14.1 |
| Black | 9.9 | 16.1 |
| Hispanic (any race) | 11.8 | 15.4 |
| White | 15.0 | 24.5 |
| Other | 15.1 | 23.3 |
NSF = National Science Foundation; SEH = science, engineering, and health.
Source(s):
National Center for Science and Engineering Statistics, Survey of Doctorate Recipients, 2015, linked to the public NSF Awards Database (https://www.nsf.gov/awardsearch/download.jsp).
Conclusion and Future Research
This project was a proof-of-concept exploration that matching can be executed to append the public NSF awards information to the SDR. In total, 7,363 SDR respondents were matched to awards in the public NSF awards database, thus expanding the analytical potential and range of applications for the NCSES survey data.
To recall, three goals were articulated for this project: (1) explore the potential of utilizing the public NSF awards database and expand knowledge of this data set, (2) identify best practices for matching federal award data with other data sets, and (3) enhance the analytical potential of NCSES data for science policy research. Extensive cleaning was carried out on the NSF data, including investigator e-mail addresses, which proved to be a vital linkage point to the survey data. Next, a reproducible matching procedure was documented and performed, establishing that individual-level records can be linked between the two data sources. Finally, use cases were provided to demonstrate the utility of the matched data in assessing patterns of NSF support in the doctorate population.
By utilizing this novel approach, researchers could replicate the steps outlined in this working paper to explore other linkages between NCSES surveys and awards data. As this was an initial exploration into the possibilities, we manually cleaned much of the data instead of automating the process. An opportunity exists for researchers to automate this process to replicate results faster—specifically, with regard to e-mail stemming and character removal.
Further opportunities exist to expand the usability of the NSF program reference and element codes. Creating a standard ontology applied via a crosswalk on research award data could open new possibilities to explore how research funding trends have changed over time and are distributed across institutions. More research might identify opportunities to incorporate the new grantee type field could also be explored and further refined. Our research team developed nine categories; however, further refining these groups, such as separating public and private schools, could shine light on how research awards are being dispersed. Finally, additional analysis could focus on different segments of the surveyed populations, such as undergraduate researchers supported by federal awards.
New possibilities to build on the matching procedures outlined in this working paper exist, and a few use cases are listed in this section to provoke further research questions and opportunities. Specifically, this matching procedure might be applied to other databases. As noted in past research and through this paper, it is possible to find novel information from data sets that do not individually give the same level of depth. When combining multiple data sources, richer information can be derived to advance our understanding of federal funding, doctoral candidates, and the state of research grants in the country. A potential use case could be to explore how the matching procedure could be applied to NIH’s Research Portfolio Online Reporting Tools (RePORT) Expenditures and Results (RePORTER) database. The RePORTER database allows for users to explore all past and present grants funded through NIH. Much like the NSF awards database, RePORTER includes PI names. Some awards also include the e-mail information for the PI. Potentially connecting SDR data with this data set could enrich NIH’s knowledge of the individuals receiving funding through the agency.
References
Buffington C, Cerf B, Jones C, Weinberg B. 2016. STEM Training and Early Career Outcomes of Female and Male Graduate Students: Evidence from UMETRICS Data Linked to the 2010 Census. American Economic Review 106(5):333–38.
Chang W-Y, Cheng W, Lane J, Weinberg B. 2019. Federal Funding of Doctoral Recipients: What Can Be Learned from Linked Data. Research Policy 48(6):1487–92.
Fleming L, Greene H, Lil G, Marx M, Yao D. 2019. Government-Funded Research Increasingly Fuels Innovation. Science 324(6446):1139–41.
Lane J, Owen-Smith J, Rosen R, Weinberg B. 2015. New Linked Data on Research Investments: Scientific Workforce, Productivity, and Public Value. Research Policy 44(9):1659–71.
National Center for Science and Engineering Statistics (NCSES). 2021. Federal Funds for Research and Development: Fiscal Years 2019–20. NSF 21-329. Alexandria, VA: National Science Foundation. Available at https://ncses.nsf.gov/pubs/nsf21329/.
Notes
1See questions A42 and A43 of the 2015 SDR questionnaire at https://www.nsf.gov/statistics/srvydoctoratework/surveys/srvydoctoratework_2015.pdf.
2This question is subject to missing data, which are replaced with imputed values. The imputation rates are 10.15% for question A42 (reporting of federal support) and 10.28% for question A43 (specific federal source of support) on the 2015 SDR.
3Employment sector reported as of the week of 1 February 2015 for those that were employed.
4These race categories were combined into a composite group for the analysis due to low counts in the individual categories.
Acknowledgments and Suggested Citation
Acknowledgments
Kelsey Cooper and Paul Liu (SRI International) assisted with data checking and code review.
Suggested Citation
Freyman C, Chang W-Y, Cooper K, Deitz S, Liu P; National Center for Science and Engineering Statistics (NCSES). 2022. Matching SDR Respondents to Investigators of NSF Awards. Working Paper NCSES 22-211. Alexandria, VA: National Science Foundation. Available at https://ncses.nsf.gov/pubs/ncses22211/.
Contact
NCSES
National Center for Science and Engineering Statistics
Directorate for Social, Behavioral and Economic Sciences
National Science Foundation
2415 Eisenhower Avenue, Suite W14200
Alexandria, VA 22314
Tel: (703) 292-8780
FIRS: (800) 877-8339
TDD: (800) 281-8749
E-mail: ncsesweb@nsf.gov
Appendix A: NSF Awards Summary Data
This appendix provides summary data on the National Science Foundation (NSF) awards data set used in the matching procedure. The distribution of NSF awards across the award attributes available in the database provides information on the funding patterns of the foundation. Labels are shown as they appear in the database (see appendix table A-1 through appendix table A-3).
The XML data include a value for field of application, which is not displayed on the NSF awards website. Roughly half of the awards in the database (260,236) include a field of application; of these, about half are labeled as “other applications nec.” NSF administration has indicated that these labels have not been used in many years, which is supported by the recent lack of coverage in the data. Appendix table A-4 shows the top 10 values of field of application. Each award may contain multiple labels.
NSF awards are assigned program reference codes, of which there are 2,096. Because awards can be assigned more than one program reference code, there are 876,418 award-program reference code pairs. The top 10 most frequent values after “unassigned” are shown in appendix table A-5. These 10 categories represent about 35% of the total award-program reference code pairs, indicating a highly skewed distribution.
NSF awards are also assigned program element codes. There are 2,054 unique program element codes in the database. An award can have multiple codes, resulting in 532,851 award-program element pairs. Appendix table A-6 shows the top 10 codes by award count. These 10 codes represent about 9% of the pairs, also indicating a highly skewed distribution. For the program reference and program element codes to be useful for award classification, a standard ontology would need to be developed and applied.
Additional Classifications
Two new classification variables for NSF awards were developed in the course of this project: funding program, and grantee type. First, based on the existing “primary program” field in the award records, NSF awards were classified into four funding programs: research, training, facilities, and other. Appendix table A-7 displays counts and percentages by funding program and primary program. Approximately 4% of records, dating mainly from 1993 or earlier, do not have an entry for primary program.
Second, the “types of grantees” field was developed to identify grantee types across all awards. NSF provides grants to various kinds of institutions, but because it does not publish a grantee classification type, a rule-based classification process was followed in order to categorize each award recipient. A total of 19,694 unique institutions are represented in the data. Using the institution name to institution type crosswalk from the National Center for Science and Engineering Statistics Taxonomy of Institution Names, about 5,000 institutions were mapped to categories using a direct name or standardized name match to the NSF listings. The remaining institutions were manually mapped according to rules applied to the contents of the name. For example, records containing “school” were classified as K–12 institutions, and those with “LLC” were mapped to the private sector (see appendix table A-8).