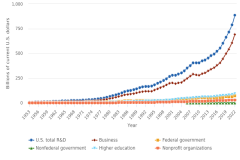
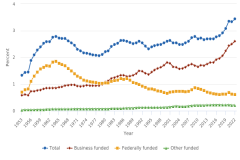
| Figure RD-1 |
U.S. R&D, by performing sector: 1953–2022 |
National Center for Science and Engineering Statistics |
National Patterns of R&D Resources |
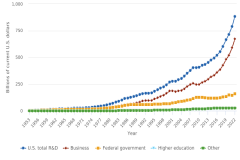
| Figure RD-2 |
U.S. R&D, by source of funds: 1953–2022 |
National Center for Science and Engineering Statistics |
National Patterns of R&D Resources |
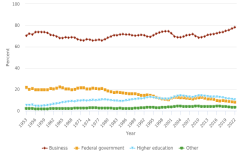
| Figure RD-3 |
U.S. R&D expenditures, shares by performing sector: 1953–2022 |
National Center for Science and Engineering Statistics |
National Patterns of R&D Resources |
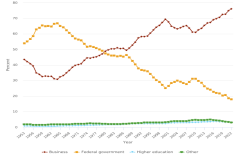
| Figure RD-4 |
U.S. R&D expenditures, shares by funding sector: 1953–2022 |
National Center for Science and Engineering Statistics |
National Patterns of R&D Resources |
| Figure RD-5 |
Ratio of U.S. R&D to GDP, by funding source: 1953–2022 |
National Center for Science and Engineering Statistics |
National Patterns of R&D Resources |
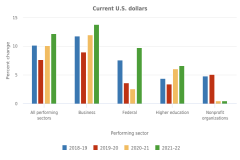
| Figure RD-6 |
Annual percent changes in U.S. R&D, by performing sector: 2018–22 |
National Center for Science and Engineering Statistics |
National Patterns of R&D Resources |
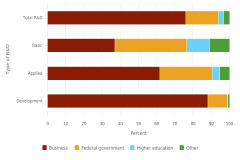
| Figure RD-7 |
U.S. R&D, by type and funding source: 2022 |
National Center for Science and Engineering Statistics |
National Patterns of R&D Resources |
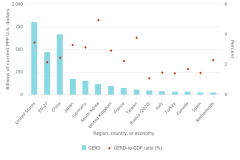
| Figure RD-8 |
GERD and GERD-to-GDP ratio, by selected region, country, or economy: 2021 or most recent year |
National Center for Science and Engineering Statistics |
National Patterns of R&D Resources |
| Figure RD-8 |
GERD and GERD-to-GDP ratio, by selected region, country, or economy: 2021 or most recent year |
Organisation for Economic Co-operation and Development |
Main Science and Technology Indicators |
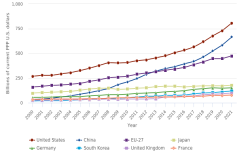
| Figure RD-9 |
Gross domestic expenditures on R&D, by selected region, country, or economy: 2000–21 |
Organisation for Economic Co-operation and Development |
Main Science and Technology Indicators |
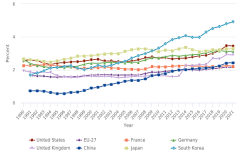
| Figure RD-10 |
GERD as a share of GDP, by selected region, country, or economy: 1990–2021 |
National Center for Science and Engineering Statistics |
National Patterns of R&D Resources |
| Figure RD-10 |
GERD as a share of GDP, by selected region, country, or economy: 1990–2021 |
Organisation for Economic Co-operation and Development |
Main Science and Technology Indicators |
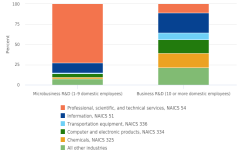
| Figure RD-11 |
U.S. business and microbusiness R&D distribution, by top industries: 2021 |
National Center for Science and Engineering Statistics |
Annual Business Survey |
| Figure RD-11 |
U.S. business and microbusiness R&D distribution, by top industries: 2021 |
National Center for Science and Engineering Statistics |
Business Enterprise Research and Development Survey |
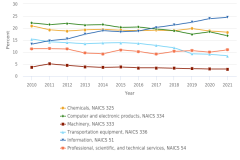
| Figure RD-12 |
Industry share of U.S. business R&D, by top R&D-performing industries: 2010–21 |
National Center for Science and Engineering Statistics |
Business Enterprise Research and Development Survey |
| Figure RD-12 |
Industry share of U.S. business R&D, by top R&D-performing industries: 2010–21 |
National Center for Science and Engineering Statistics |
Business R&D and Innovation Survey |
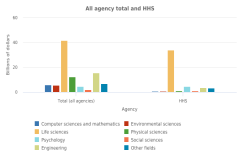
| Figure RD-13 |
Federal obligations for research, by agency and major S&E field: FY 2022 |
National Center for Science and Engineering Statistics |
Survey of Federal Funds for Research and Development |
| Table RD-1 |
U.S. R&D expenditures, by performing sector and source of funds: 2010–22 |
National Center for Science and Engineering Statistics |
National Patterns of R&D Resources |
| Table RD-2 |
U.S. R&D expenditures, by performing sector, source of funds, and type of R&D: 2022 |
National Center for Science and Engineering Statistics |
National Patterns of R&D Resources |
| Table RD-3 |
U.S. R&D expenditures, by type of R&D: Selected years, 2000–22 |
National Center for Science and Engineering Statistics |
National Patterns of R&D Resources |
| Table RD-4 |
GERD for selected region, country, or economy, by performing sector and source of funds: 2021 |
National Center for Science and Engineering Statistics |
National Patterns of R&D Resources |
| Table RD-4 |
GERD for selected region, country, or economy, by performing sector and source of funds: 2021 |
Organisation for Economic Co-operation and Development |
Main Science and Technology Indicators |
| Table RD-5 |
GERD, GDP, GERD-to-GDP ratio, and growth rates, by selected region, country, or economy: Selected years, 1990–2021 |
National Center for Science and Engineering Statistics |
National Patterns of R&D Resources |
| Table RD-5 |
GERD, GDP, GERD-to-GDP ratio, and growth rates, by selected region, country, or economy: Selected years, 1990–2021 |
Organisation for Economic Co-operation and Development |
Main Science and Technology Indicators |
| Table RD-6 |
Domestic net sales, R&D, and R&D-to-sales ratio for companies that performed or funded U.S. business R&D, by selected industry: 2021 |
National Center for Science and Engineering Statistics |
Business Enterprise Research and Development Survey |
| Table RD-7 |
U.S. business R&D performance, by source of funds: 2021 |
National Center for Science and Engineering Statistics |
Business Enterprise Research and Development Survey |
| Table RD-8 |
U.S. R&D performed, by semiconductor manufacturing and other selected industries: 2008–21 |
National Center for Science and Engineering Statistics |
Business Enterprise Research and Development Survey |
| Table RD-9 |
U.S. business R&D performed, by industry and select technology focus: 2021 |
National Center for Science and Engineering Statistics |
Business Enterprise Research and Development Survey |
| Table RD-10 |
Federal obligations for R&D and R&D plant, by agency: FYs 2008–23 |
National Center for Science and Engineering Statistics |
Survey of Federal Funds for Research and Development |
| Table RD-11 |
Federal obligations for R&D and R&D plant, by agency and performer: FY 2022 |
National Center for Science and Engineering Statistics |
Survey of Federal Funds for Research and Development |
| Table RD-12 |
Federal obligations for R&D, by agency and type of R&D: FY 2022 |
National Center for Science and Engineering Statistics |
Survey of Federal Funds for Research and Development |
| Table SRD-1 |
GERD, GDP, GERD-to-GDP ratio, and growth rates, by selected region, country, or economy: Selected years, 1990–2021 |
National Center for Science and Engineering Statistics |
National Patterns of R&D Resources |
| Table SRD-1 |
GERD, GDP, GERD-to-GDP ratio, and growth rates, by selected region, country, or economy: Selected years, 1990–2021 |
Organisation for Economic Co-operation and Development |
Main Science and Technology Indicators |
| Table SRD-2 |
GERD for selected region, country, or economy, by performing sector and source of funds: 2021 or most recent year |
National Center for Science and Engineering Statistics |
National Patterns of R&D Resources |
| Table SRD-2 |
GERD for selected region, country, or economy, by performing sector and source of funds: 2021 or most recent year |
Organisation for Economic Co-operation and Development |
Main Science and Technology Indicators |
| Table SRD-3 |
Domestic R&D paid for by the company and others and performed by the company, by industry and company size: 2021 |
National Center for Science and Engineering Statistics |
Business Enterprise Research and Development Survey |
| Table SRD-4 |
Domestic R&D performed by the company, by selected industry and employment size, for companies with 1–9 employees: 2021 |
National Center for Science and Engineering Statistics |
Annual Business Survey |
| Table SRD-5 |
U.S. business R&D performance, by state and source of funds: 2021 |
National Center for Science and Engineering Statistics |
Business Enterprise Research and Development Survey |
| Table SRD-6 |
U.S. business R&D performed, by industry and select technology focus: 2021 |
National Center for Science and Engineering Statistics |
Business Enterprise Research and Development Survey |
 An official website of the United States government