 An official website of the United States government
 Enrollment
Recent trends in undergraduate and graduate enrollment reflect the increasing diversity of the U.S. college and graduate-school populations. For example, Hispanics or Latinos have increased their share of undergraduate students, from 18.9% in 2016 to 20.2% in 2018. However, the share of enrolled undergraduate students for some groups has decreased. For example, the share of Blacks or African Americans decreased from 12.4% in 2016 to 12.1% in 2018. Among all racial and ethnic groups, more women than men enroll in college. In graduate school, the overall number of science and engineering (S&E) students declined between 2016 and 2018, but the share of Hispanic or Latino students increased during this period, from 6.4% to 7.0%. However, the shares of both American Indian or Alaska Native students and Black or African American students remained the same.
Undergraduate enrollment
Type of school
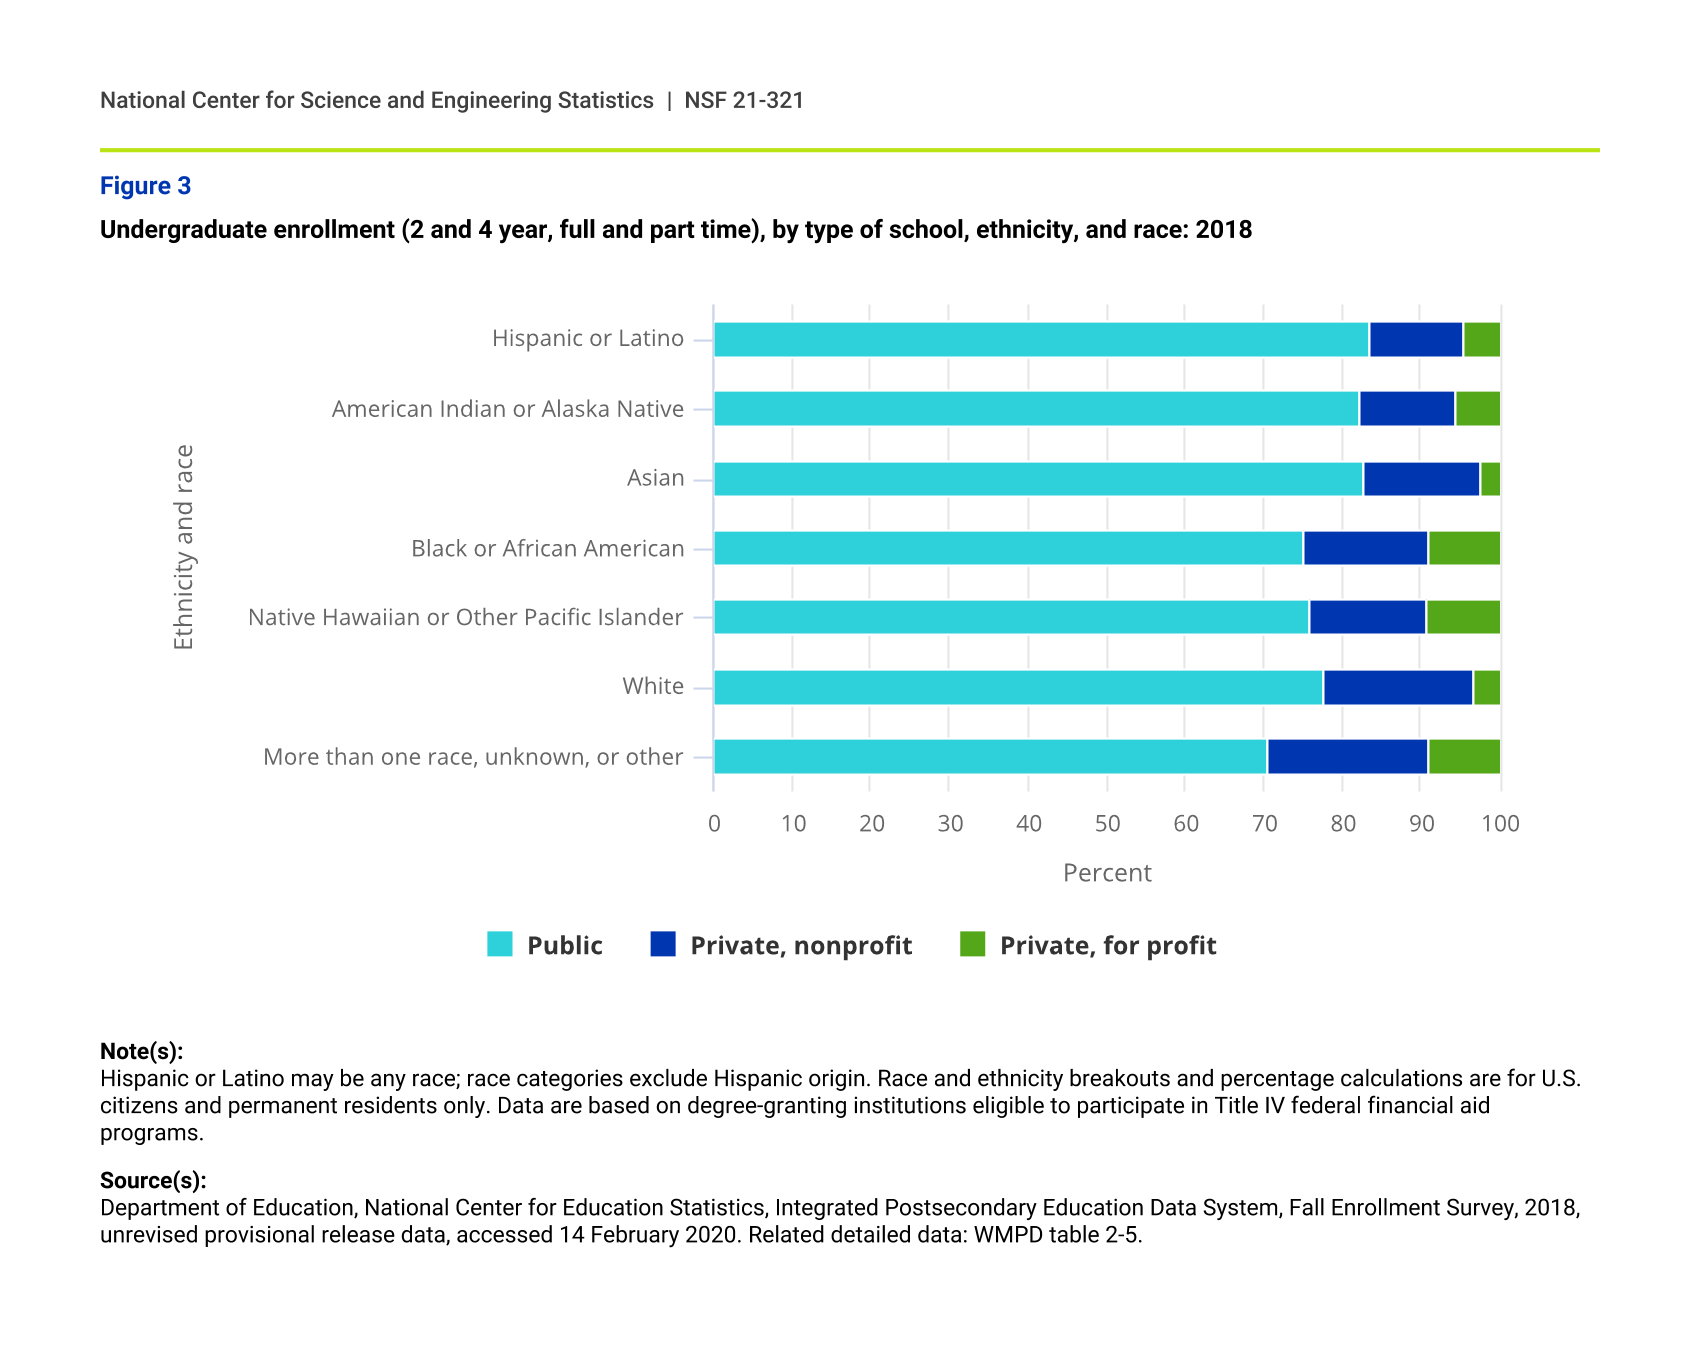
In 2018, more than three-quarters of undergraduate U.S. citizens and permanent residents were enrolled in public colleges. However, this proportion varies across racial and ethnic groups. Students who are Native Hawaiian or Other Pacific Islander, are Black or African American, or are more than one race, unknown race or ethnicity, or some other designation had the largest share enrolled in private for-profit institutions. Hispanic or Latino, Asian, and American Indian or Alaska Native students had the largest share of enrollees in public institutions. White enrollees and those reporting more than one race, unknown, or other had the largest share of students in private nonprofit institutions (figure 3).
Undergraduate enrollment (2 and 4 year, full and part time), by type of school, ethnicity, and race: 2018
| Ethnicity and race | Public | Private, nonprofit | Private, for profit |
|---|---|---|---|
| Hispanic or Latino | 83.43 | 11.97 | 4.59 |
| American Indian or Alaska Native | 82.26 | 12.08 | 5.66 |
| Asian | 82.84 | 14.72 | 2.44 |
| Black or African American | 75.19 | 15.82 | 8.99 |
| Native Hawaiian or Other Pacific Islander | 75.92 | 14.82 | 9.26 |
| White | 77.79 | 19.04 | 3.17 |
| More than one race, unknown, or other | 70.62 | 20.44 | 8.94 |
Note(s):
Hispanic or Latino may be any race; race categories exclude Hispanic origin. Race and ethnicity breakouts and percentage calculations are for U.S. citizens and permanent residents only. Data are based on degree-granting institutions eligible to participate in Title IV federal financial aid programs.
Source(s):
Department of Education, National Center for Education Statistics, Integrated Postsecondary Education Data System, Fall Enrollment Survey, 2018, unrevised provisional release data, accessed 14 February 2020. Related detailed data: WMPD table 2-5.
Full-time study
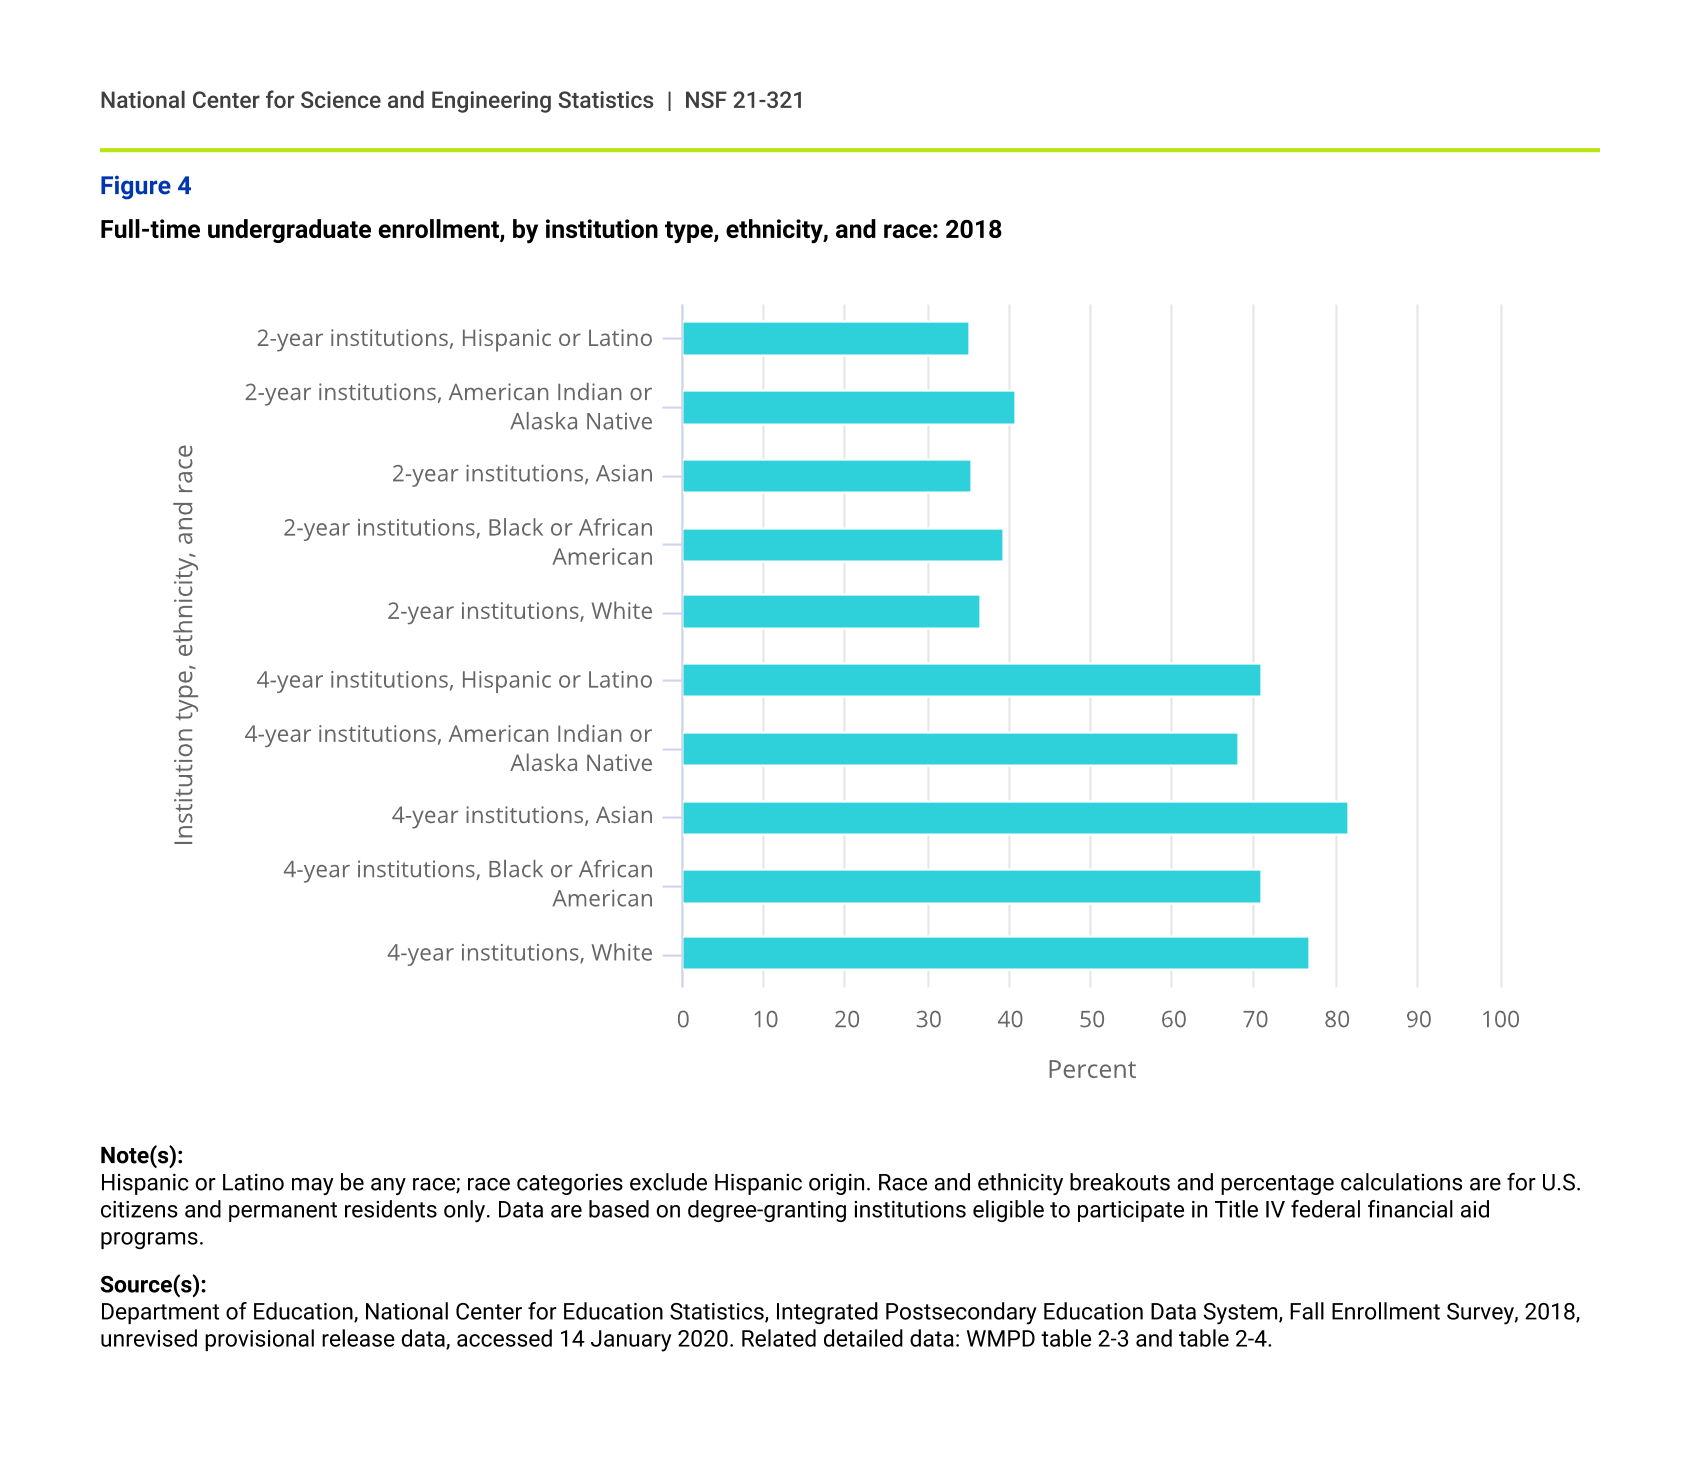
Full-time enrollment is more prevalent in 4-year institutions than in 2-year institutions for all racial and ethnic groups. However, enrollment patterns differ somewhat among these groups. At 2-year institutions, only American Indian or Alaska Native students had more than 40% enrolled as full-time students. At 4-year institutions, all groups but American Indian or Alaska Native had more than 70% enrolled full time, and Asian and White students had the highest full-time rate (81.6% and 76.8%, respectively) (figure 4).
Full-time undergraduate enrollment, by institution type, ethnicity, and race: 2018
| Institution type, ethnicity, and race | Percent |
|---|---|
| 2-year institutions, Hispanic or Latino | 35.27 |
| 2-year institutions, American Indian or Alaska Native | 40.90 |
| 2-year institutions, Asian | 35.58 |
| 2-year institutions, Black or African American | 39.38 |
| 2-year institutions, White | 36.53 |
| 4-year institutions, Hispanic or Latino | 70.87 |
| 4-year institutions, American Indian or Alaska Native | 68.22 |
| 4-year institutions, Asian | 81.61 |
| 4-year institutions, Black or African American | 70.98 |
| 4-year institutions, White | 76.76 |
Note(s):
Hispanic or Latino may be any race; race categories exclude Hispanic origin. Race and ethnicity breakouts and percentage calculations are for U.S. citizens and permanent residents only. Data are based on degree-granting institutions eligible to participate in Title IV federal financial aid programs.
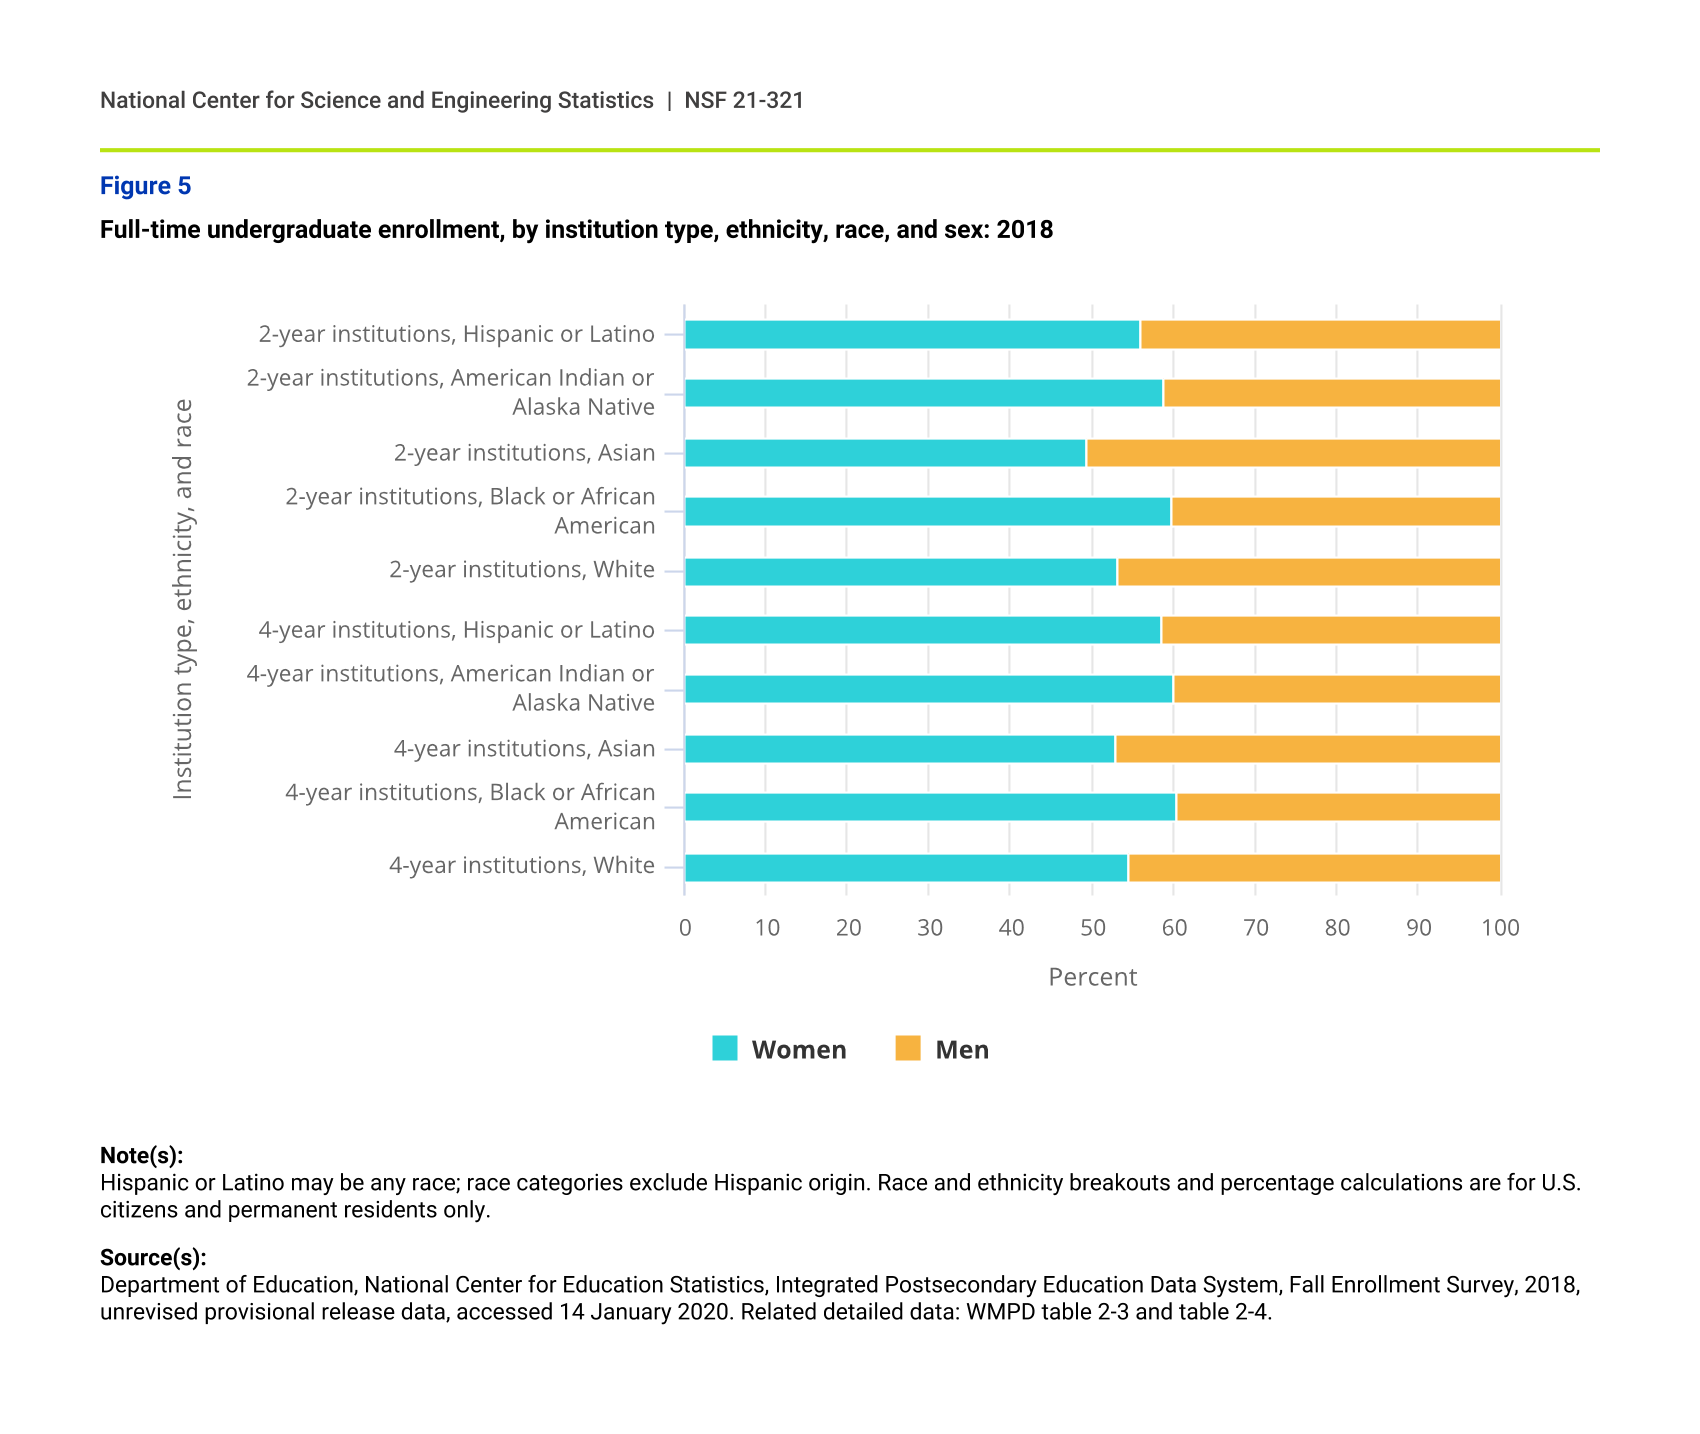
Among those enrolled full time in undergraduate institutions, more women than men reported being full-time students across most racial and ethnic groups, both in 2-year and in 4-year institutions. The one exception is for Asian women, who made up slightly less than half of Asians enrolled full time in 2-year institutions (figure 5).
Full-time undergraduate enrollment, by institution type, ethnicity, race, and sex: 2018
| Institution type, ethnicity, and race | Women | Men |
|---|---|---|
| 2-year institutions, Hispanic or Latino | 56.13 | 43.87 |
| 2-year institutions, American Indian or Alaska Native | 58.79 | 41.21 |
| 2-year institutions, Asian | 49.28 | 50.72 |
| 2-year institutions, Black or African American | 59.80 | 40.20 |
| 2-year institutions, White | 53.18 | 46.82 |
| 4-year institutions, Hispanic or Latino | 58.52 | 41.48 |
| 4-year institutions, American Indian or Alaska Native | 60.13 | 39.87 |
| 4-year institutions, Asian | 52.89 | 47.11 |
| 4-year institutions, Black or African American | 60.44 | 39.56 |
| 4-year institutions, White | 54.39 | 45.61 |
Note(s):
Hispanic or Latino may be any race; race categories exclude Hispanic origin. Race and ethnicity breakouts and percentage calculations are for U.S. citizens and permanent residents only.
Graduate enrollment
Among students enrolled in graduate school in S&E fields in 2018, White U.S. citizens and permanent residents were the largest group (38.3%), followed by those with temporary visas (37.2%). In S&E master’s programs, Black or African American women made up 7.7% of all women enrolled, a larger share than that found for Black or African American men (4.7% of all men in S&E master’s program). In addition, among Blacks or African Americans, women outnumber men at this level (11,290 versus 8,888 enrolled in S&E master’s programs). Likewise, among S&E doctoral students, 4.6% of female students are Black or African American, a larger share than that found for Black or African American men (2.4% of all male S&E doctoral students). Hispanics or Latinos comprised 7.0% of all S&E graduate students, with Hispanic or Latino women making up 9.4% of women in S&E master’s programs and 7.0% of women in S&E doctoral programs; Hispanic or Latino men enrolled in graduate school represented 6.8% of men in S&E master’s programs and 5.0% of men in S&E doctoral programs.
About 222,000 graduate students (37.2%) enrolled in S&E fields in 2018 were temporary visa holders. Temporary visa holders made up 30.9% of women and 41.9% of men enrolled in graduate school in S&E fields (figure 6).
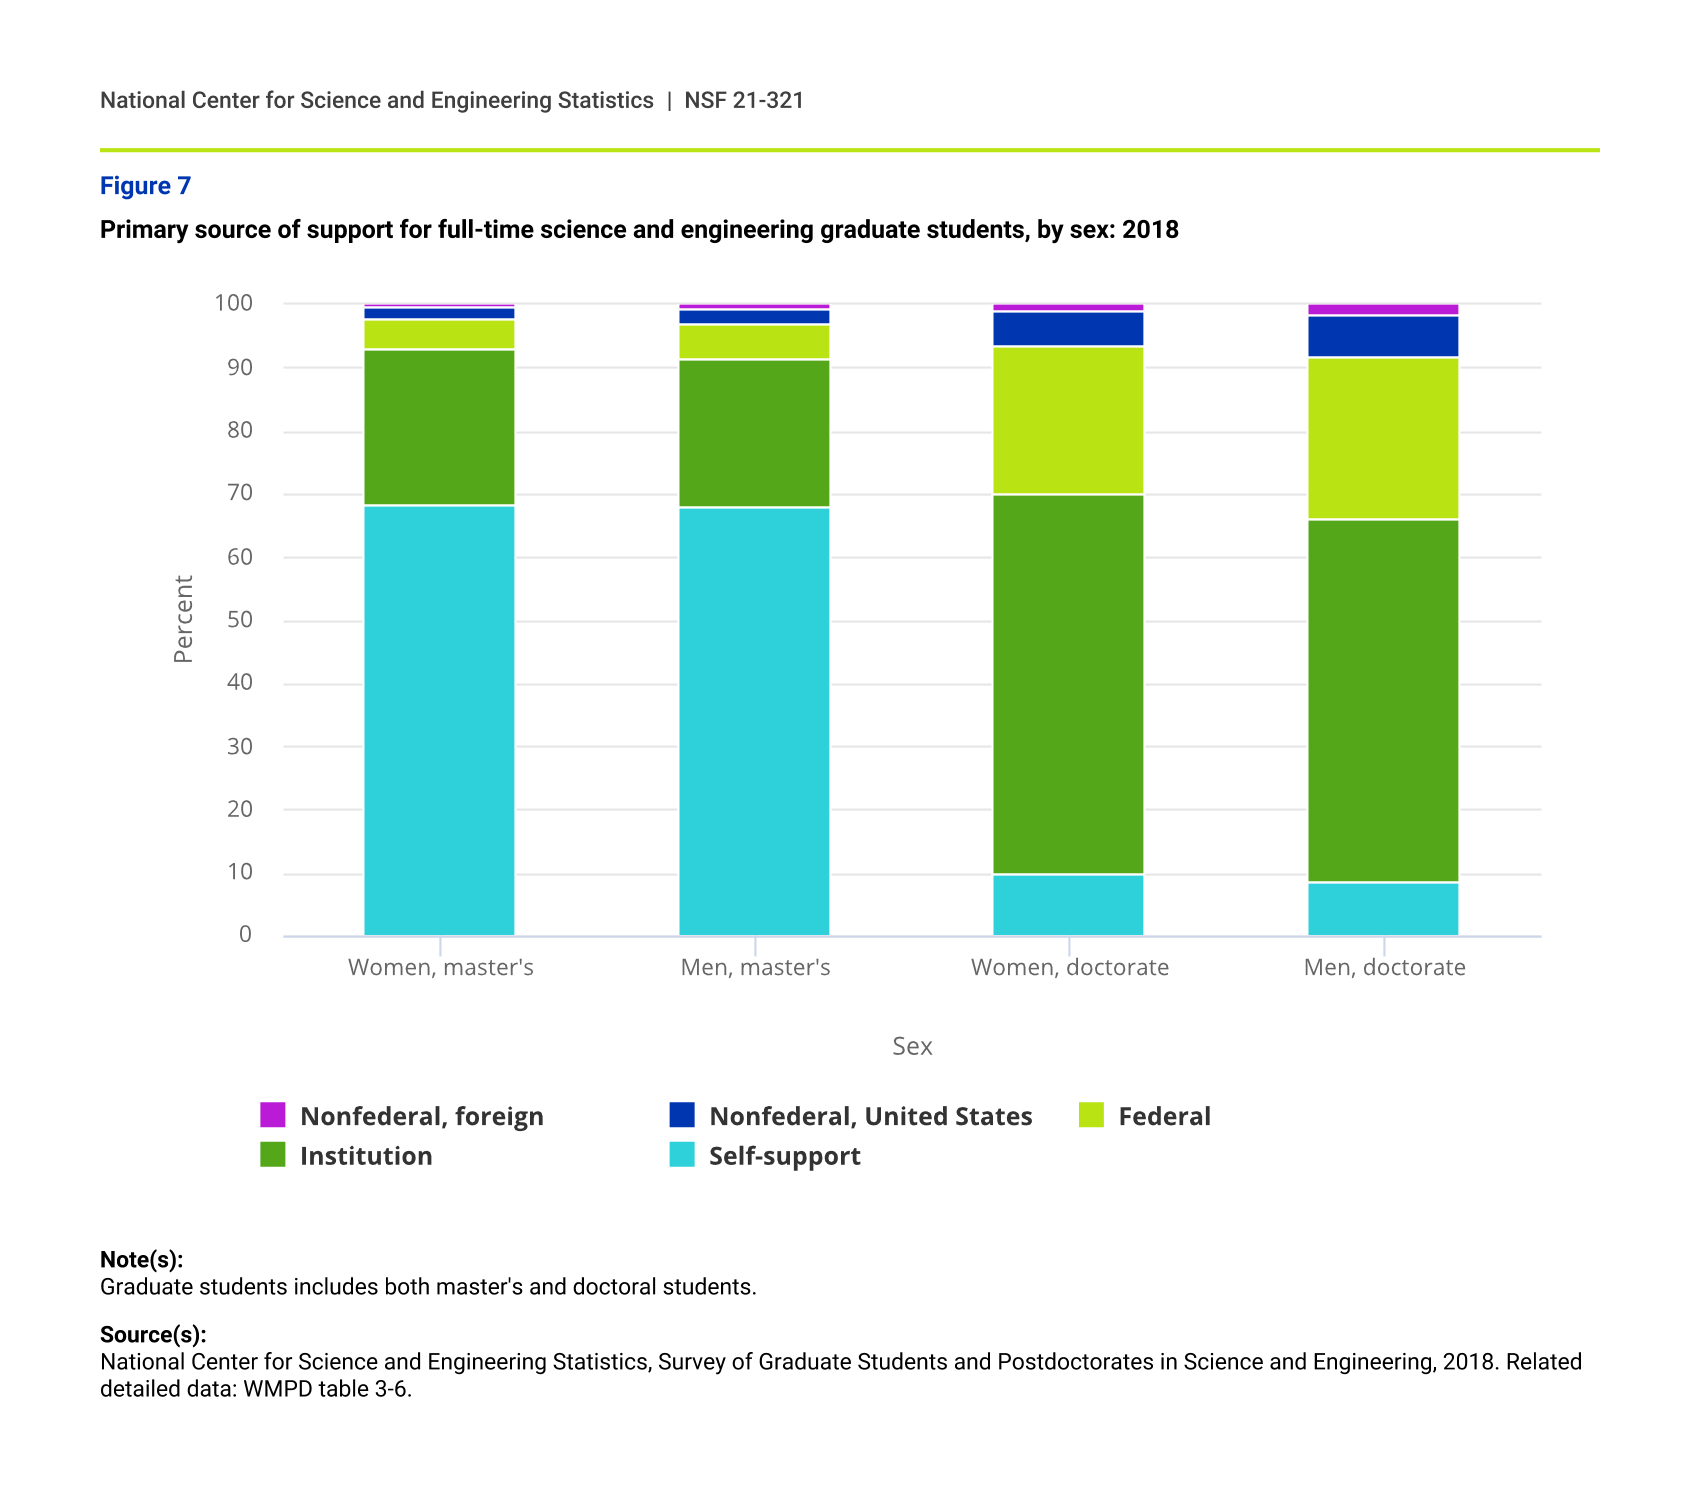
Women and men reported similar primary sources of support among the S&E full-time graduate students enrolled in 2018, although the patterns were quite different for master’s students compared with the doctoral students. For master’s students, the main source of support was self-support (including loans). For doctoral students, the main source of support was from their institution (figure 7).
Graduate students in science and engineering, by ethnicity, race, citizenship, and sex: 2018
| Sex | Hispanic or Latino | American Indian or Alaska Native | Asian | Black or African American | Native Hawaiian or Other Pacific Islander | White | More than one race, unknown, or other | Temporary visa holders |
|---|---|---|---|---|---|---|---|---|
| Women, master's | 13.79 | 0.54 | 9.93 | 11.29 | 0.20 | 57.33 | 10.49 | 42.37 |
| Men, master's | 12.85 | 0.43 | 13.76 | 8.89 | 0.19 | 68.74 | 10.43 | 73.16 |
| Women, doctorate | 7.58 | 0.36 | 7.23 | 4.96 | 0.12 | 45.80 | 5.96 | 36.23 |
| Men, doctorate | 7.61 | 0.29 | 8.36 | 3.74 | 0.09 | 56.31 | 6.76 | 69.75 |
Note(s):
Hispanic or Latino may be any race; race categories exclude Hispanic origin. Race and ethnicity breakouts are for U.S. citizens and permanent residents only.
Source(s):
National Center for Science and Engineering Statistics, Survey of Graduate Students and Postdoctorates in Science and Engineering, 2018. Related detailed data: WMPD table 3-1.
Primary source of support for full-time science and engineering graduate students, by sex: 2018
| Sex | Self-support | Institution | Federal | Nonfederal, United States | Nonfederal, foreign |
|---|---|---|---|---|---|
| Women, master's | 68.41 | 24.66 | 4.72 | 1.75 | 0.47 |
| Men, master's | 68.12 | 23.43 | 5.55 | 2.14 | 0.76 |
| Women, doctorate | 9.92 | 60.12 | 23.42 | 5.50 | 1.04 |
| Men, doctorate | 8.53 | 57.59 | 25.77 | 6.56 | 1.55 |
Note(s):
Graduate students includes both master's and doctoral students.
Source(s):
National Center for Science and Engineering Statistics, Survey of Graduate Students and Postdoctorates in Science and Engineering, 2018. Related detailed data: WMPD table 3-6.