 An official website of the United States government
 Field of degree: Intersectionality
Intersectionality is a framework for understanding how overlapping social identities can affect individuals, in particular, for helping to understand inequality. For example, a Black or African American woman may face both racial discrimination and sexism, making her experience and the inequality she faces different from both that of White women and that of Black or African American men. Because of this, it is important to analyze differences in science and engineering degree awards by race, ethnicity, and sex.
In 2018, women from underrepresented minority groups—Blacks or African Americans, Hispanics or Latinos, and American Indians or Alaska Natives—earned more than half of the science and engineering (S&E) degrees awarded to their respective racial and ethnic groups at all degree levels—bachelor’s, master’s, and doctorate. Underrepresented minority women have increasing and large shares of bachelor’s degrees in psychology, social sciences, and biological and agricultural sciences. Representation in these fields by underrepresented minority women is increasing, and in some cases, surpasses their representation in the labor force. In addition, they received more than half of the associate’s degrees in the S&E technology fields that prepare students for skilled technical careers.
Differences between women and men
Underrepresented minorities
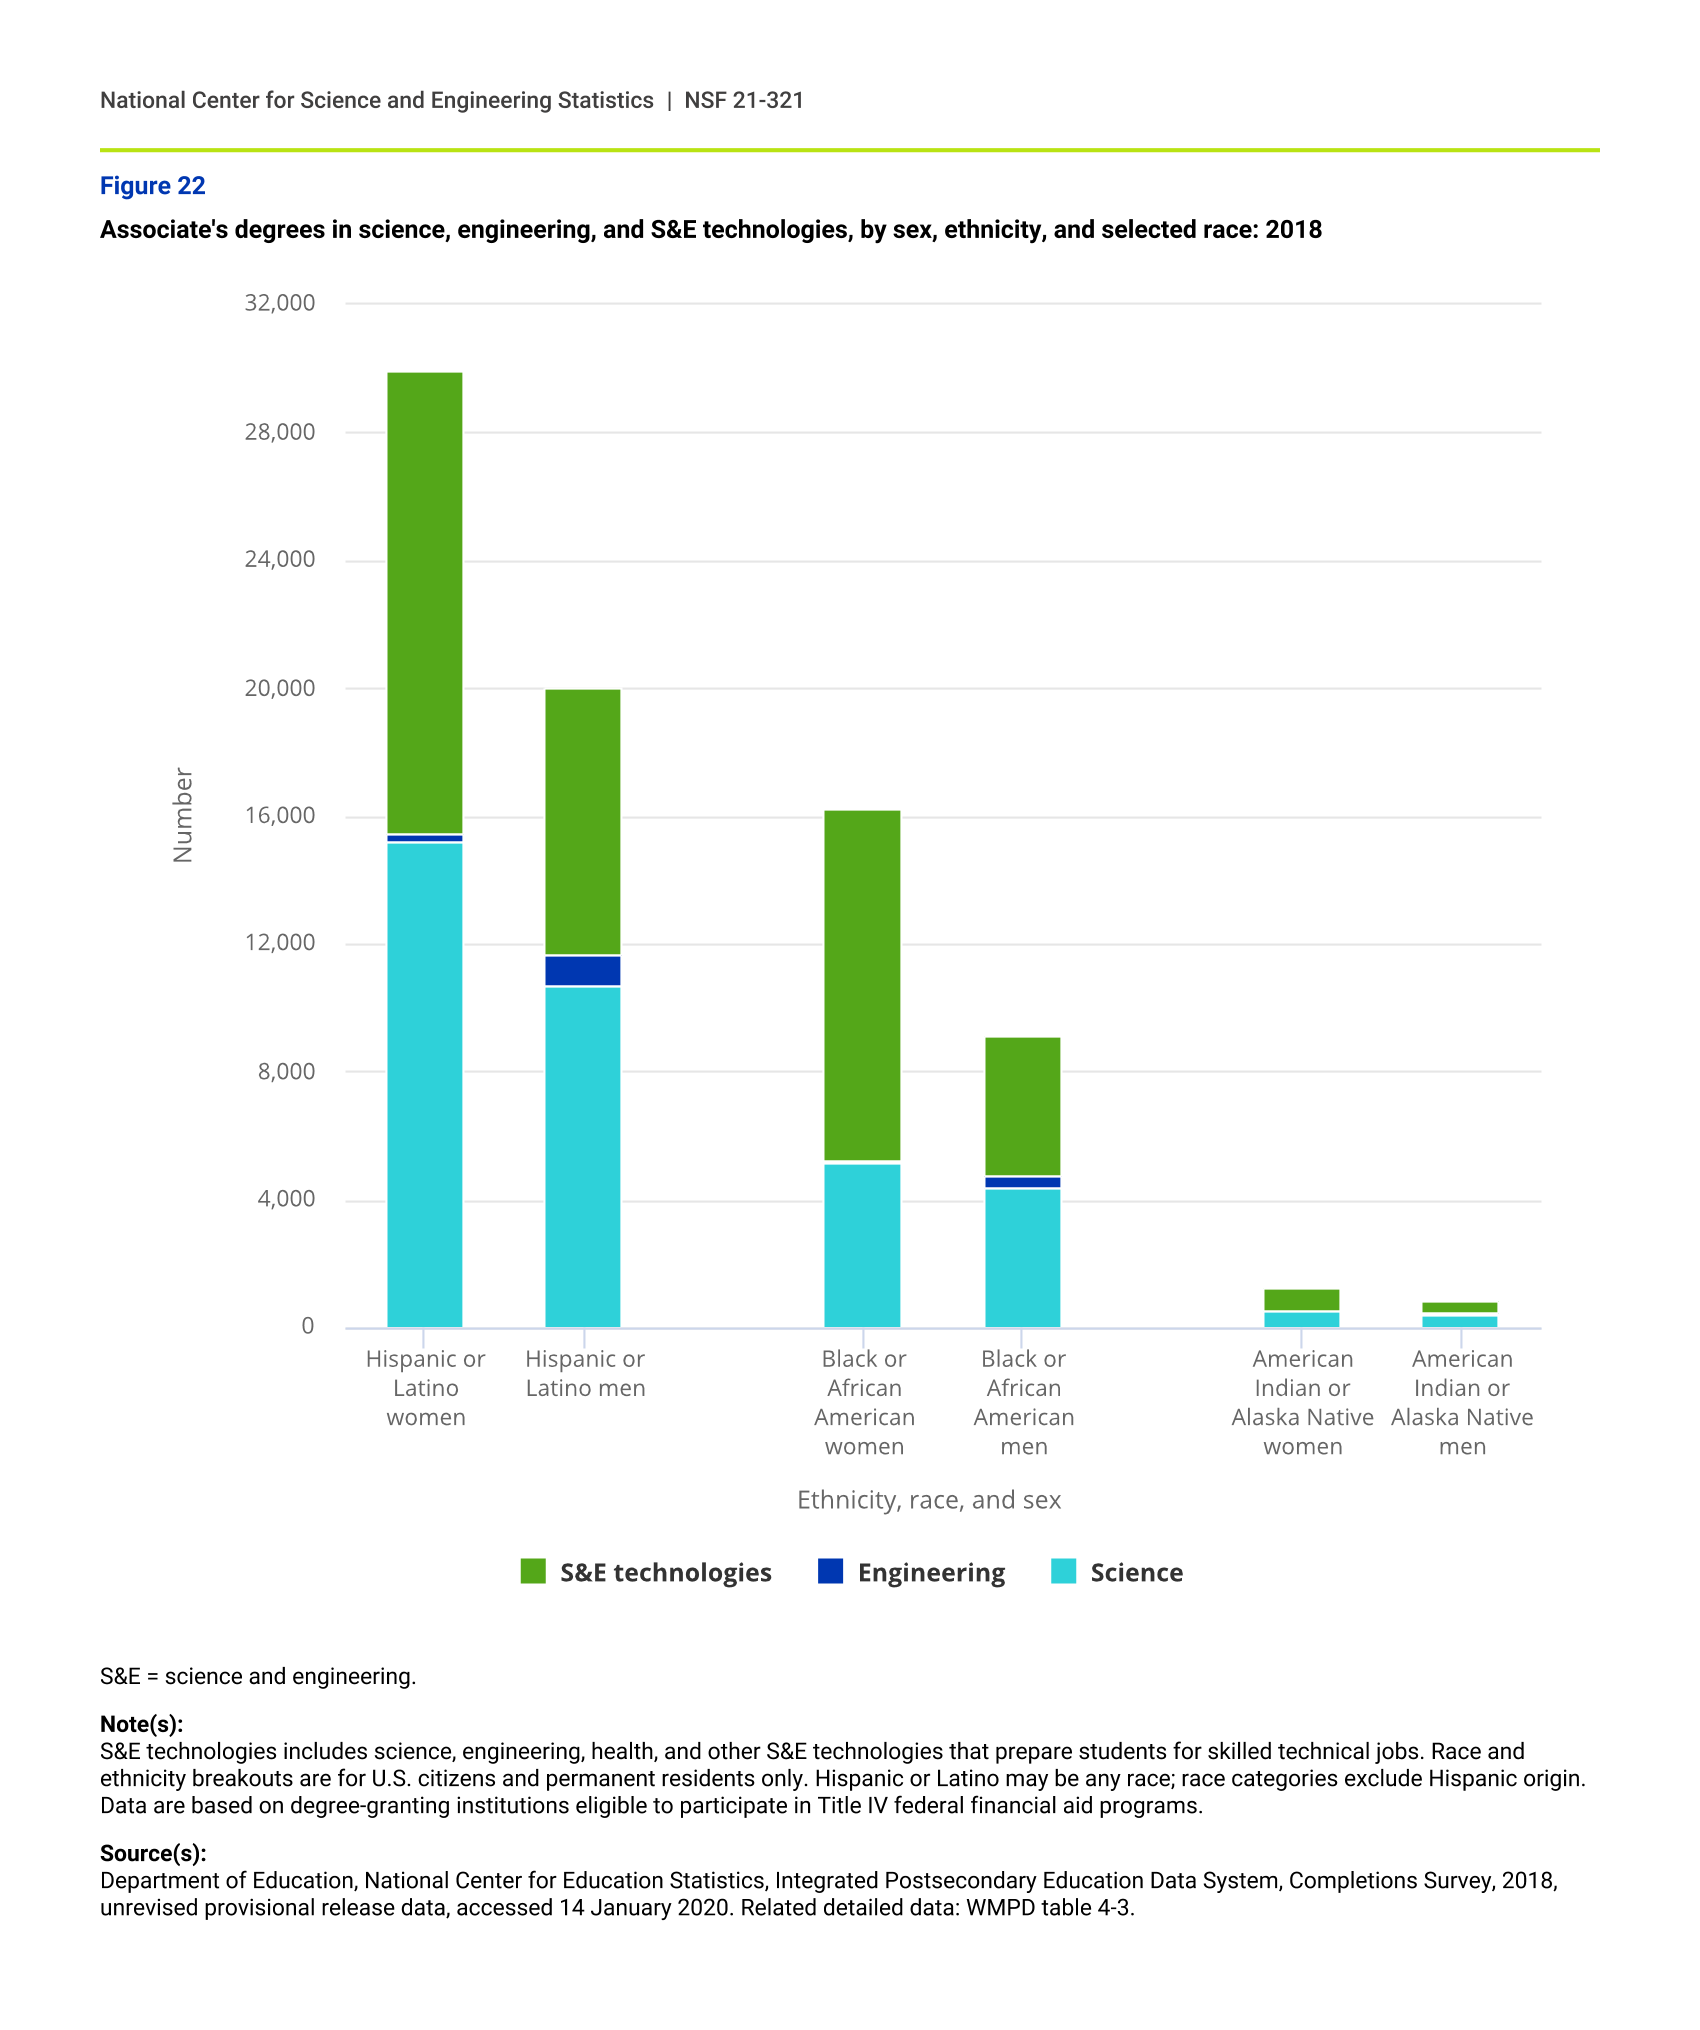
In 2018, underrepresented minority women received more associate’s degrees in science and in S&E technologies than did their male counterparts. Men from underrepresented groups, however, received more associate’s degrees in engineering than did females from those respective groups. Underrepresented women and men together received almost a third of associate’s degrees in S&E technologies—science, engineering, health, and other technologies that prepare students for skilled technical jobs, which are an important part of the science, technology, engineering, and mathematics (STEM) workforce (figure 22).
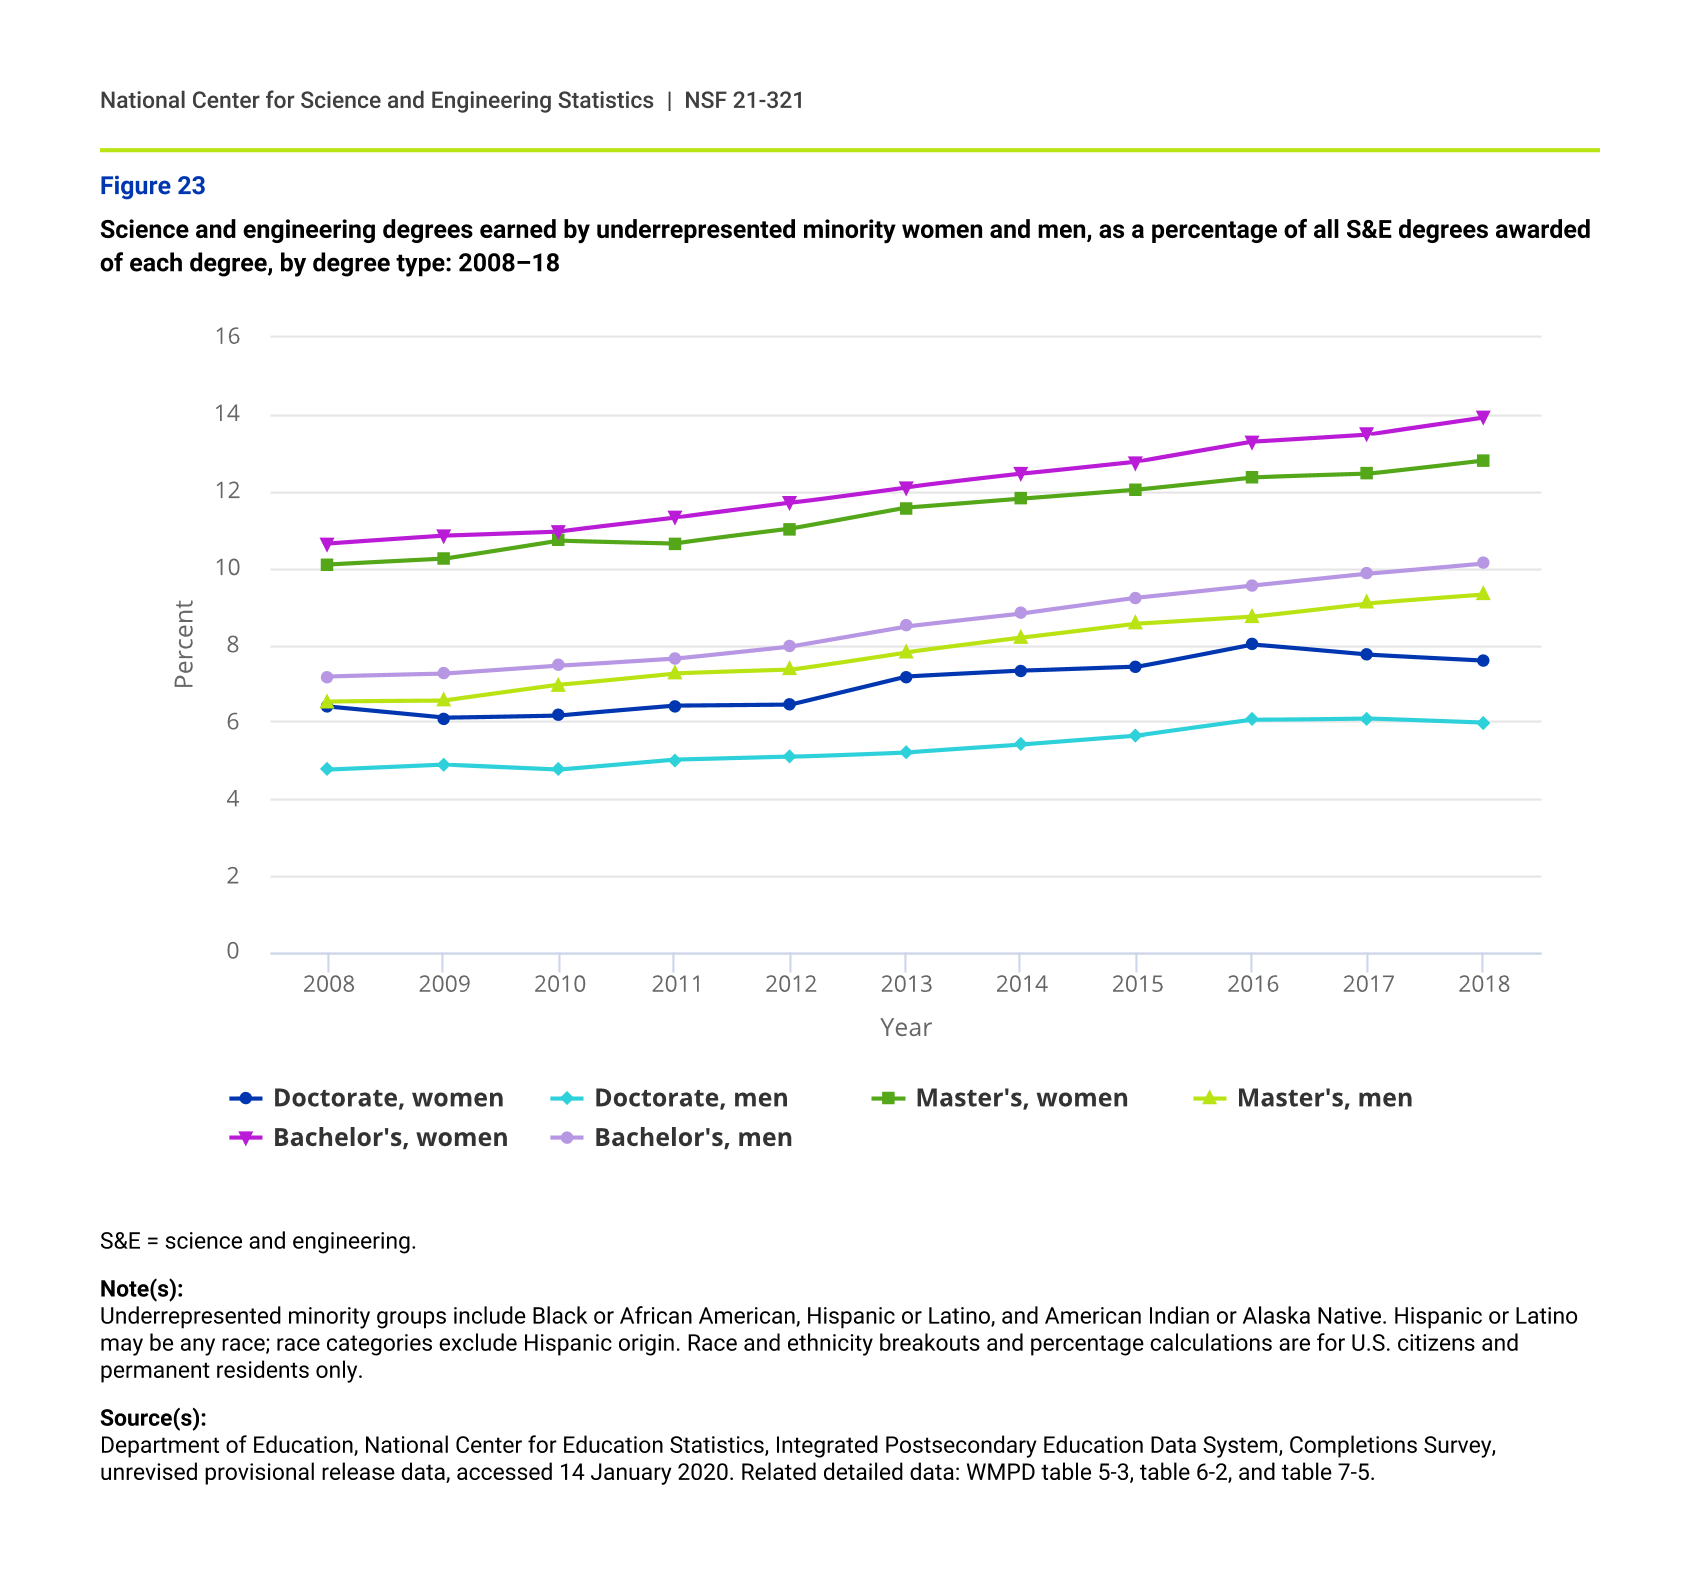
As noted above, at each degree level—bachelor’s, master’s, and doctorate—underrepresented minority women earned a higher share of S&E degrees than did underrepresented minority men. However, in these groups, more men than women earned degrees in engineering at the three degree levels. Over the past decade, the share of both underrepresented minority women and men receiving S&E bachelor’s degrees steadily increased, although there was a slight decline since 2016 in both the shares and number of women and men with doctorates (figure 23).
Associate's degrees in science, engineering, and S&E technologies, by sex, ethnicity, and selected race: 2018
| Ethnicity, race, and sex | Science | Engineering | S&E technologies |
|---|---|---|---|
| Hispanic or Latino women | 15,186 | 255 | 14,474 |
| Hispanic or Latino men | 10,666 | 1,011 | 8,318 |
| Black or African American women | 5,134 | 77 | 11,048 |
| Black or African American men | 4,343 | 383 | 4,405 |
| American Indian or Alaska Native women | 523 | 5 | 701 |
| American Indian or Alaska Native men | 421 | 33 | 381 |
S&E = science and engineering.
Note(s):
S&E technologies includes science, engineering, health, and other S&E technologies that prepare students for skilled technical jobs. Race and ethnicity breakouts are for U.S. citizens and permanent residents only. Hispanic or Latino may be any race; race categories exclude Hispanic origin. Data are based on degree-granting institutions eligible to participate in Title IV federal financial aid programs.
Source(s):
Department of Education, National Center for Education Statistics, Integrated Postsecondary Education Data System, Completions Survey, 2018, unrevised provisional release data, accessed 14 January 2020. Related detailed data: WMPD table 4-3.
Science and engineering degrees earned by underrepresented minority women and men, as a percentage of all S&E degrees awarded of each degree, by degree type: 2008–18
| Year | Doctorate, women | Doctorate, men | Master's, women | Master's, men | Bachelor's, women | Bachelor's, men |
|---|---|---|---|---|---|---|
| 2008 | 6.39 | 4.75 | 10.09 | 6.53 | 10.65 | 7.18 |
| 2009 | 6.10 | 4.88 | 10.24 | 6.55 | 10.85 | 7.25 |
| 2010 | 6.16 | 4.75 | 10.72 | 6.96 | 10.96 | 7.46 |
| 2011 | 6.41 | 5.01 | 10.65 | 7.26 | 11.31 | 7.65 |
| 2012 | 6.44 | 5.09 | 11.02 | 7.35 | 11.70 | 7.97 |
| 2013 | 7.17 | 5.21 | 11.57 | 7.81 | 12.11 | 8.49 |
| 2014 | 7.32 | 5.41 | 11.81 | 8.18 | 12.45 | 8.82 |
| 2015 | 7.43 | 5.64 | 12.05 | 8.55 | 12.77 | 9.23 |
| 2016 | 8.02 | 6.05 | 12.37 | 8.74 | 13.29 | 9.55 |
| 2017 | 7.75 | 6.09 | 12.46 | 9.09 | 13.48 | 9.86 |
| 2018 | 7.60 | 5.98 | 12.81 | 9.31 | 13.92 | 10.13 |
S&E = science and engineering.
Note(s):
Underrepresented minority groups include Black or African American, Hispanic or Latino, and American Indian or Alaska Native. Hispanic or Latino may be any race; race categories exclude Hispanic origin. Race and ethnicity breakouts and percentage calculations are for U.S. citizens and permanent residents only.
Bachelor’s degrees
Hispanic or Latino women
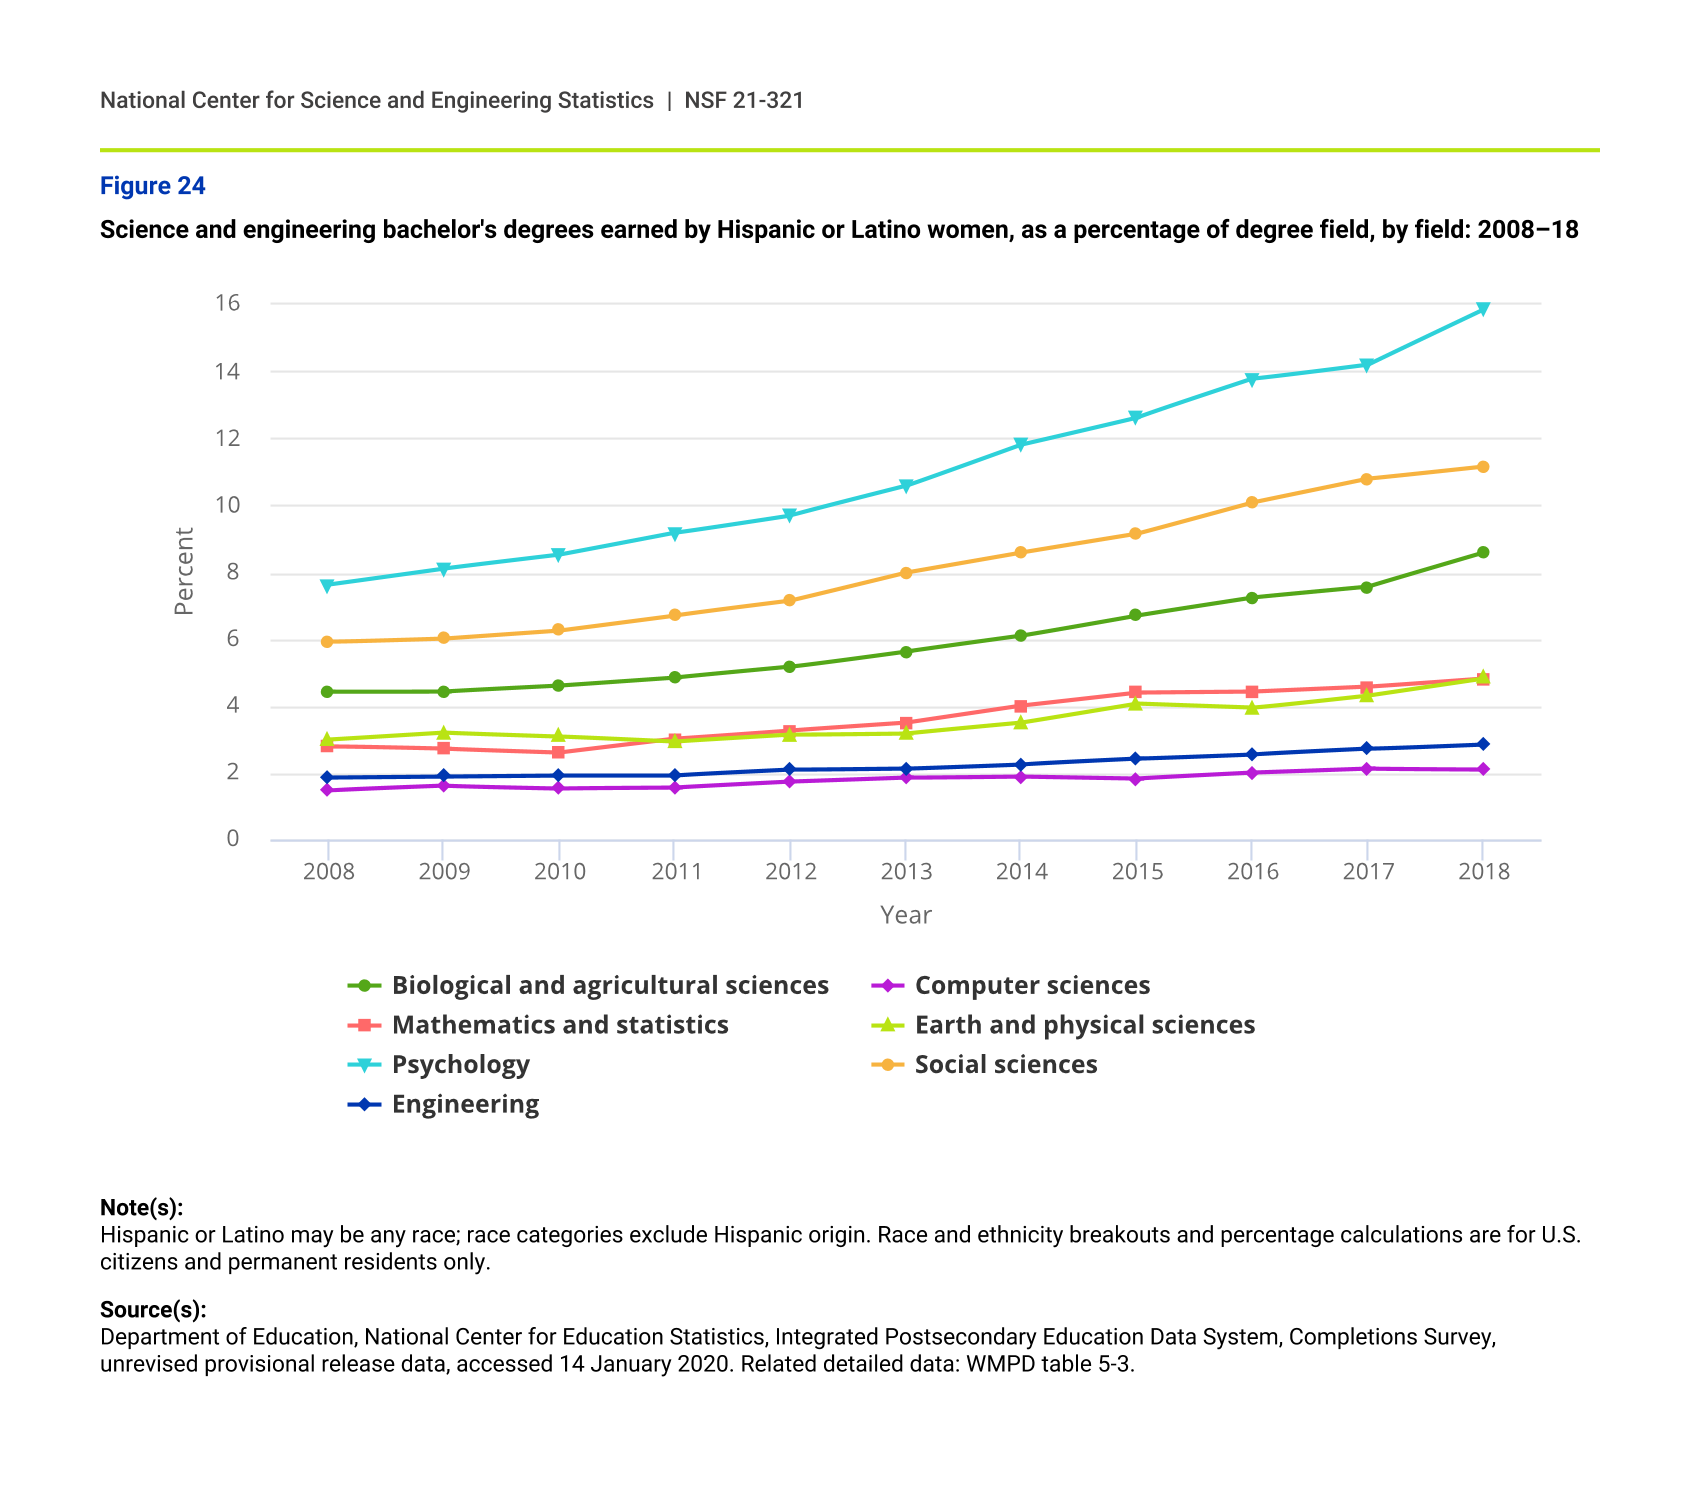
Hispanic or Latino women earned a higher share of bachelor’s degrees in psychology, social sciences, and biological and agricultural sciences than in other S&E fields. The share of the bachelor’s degrees they earn in these three broad fields increased rapidly since 2008. The share of Hispanic or Latino women receiving bachelor’s degrees in engineering and computer sciences increased only slightly over time. Nevertheless, these shares represent about 3,200 Hispanic or Latino women receiving bachelor’s degrees in engineering in 2018 and about 1,500 in computer sciences (figure 24).
Science and engineering bachelor's degrees earned by Hispanic or Latino women, as a percentage of degree field, by field: 2008–18
| Year | Biological and agricultural sciences | Computer sciences | Mathematics and statistics | Earth and physical sciences | Psychology | Social sciences | Engineering |
|---|---|---|---|---|---|---|---|
| 2008 | 4.42 | 1.48 | 2.79 | 2.99 | 7.62 | 5.91 | 1.87 |
| 2009 | 4.43 | 1.61 | 2.71 | 3.20 | 8.10 | 6.02 | 1.90 |
| 2010 | 4.60 | 1.54 | 2.60 | 3.09 | 8.51 | 6.26 | 1.93 |
| 2011 | 4.84 | 1.56 | 3.01 | 2.93 | 9.17 | 6.71 | 1.93 |
| 2012 | 5.16 | 1.73 | 3.26 | 3.13 | 9.70 | 7.14 | 2.09 |
| 2013 | 5.63 | 1.85 | 3.49 | 3.17 | 10.57 | 7.98 | 2.13 |
| 2014 | 6.10 | 1.89 | 4.00 | 3.49 | 11.82 | 8.58 | 2.26 |
| 2015 | 6.71 | 1.83 | 4.39 | 4.06 | 12.63 | 9.14 | 2.42 |
| 2016 | 7.24 | 2.00 | 4.42 | 3.94 | 13.77 | 10.08 | 2.55 |
| 2017 | 7.56 | 2.12 | 4.57 | 4.32 | 14.21 | 10.79 | 2.71 |
| 2018 | 8.57 | 2.10 | 4.82 | 4.83 | 15.85 | 11.16 | 2.85 |
Note(s):
Hispanic or Latino may be any race; race categories exclude Hispanic origin. Race and ethnicity breakouts and percentage calculations are for U.S. citizens and permanent residents only.
Source(s):
Department of Education, National Center for Education Statistics, Integrated Postsecondary Education Data System, Completions Survey, unrevised provisional release data, accessed 14 January 2020. Related detailed data: WMPD table 5-3.
Black or African American women
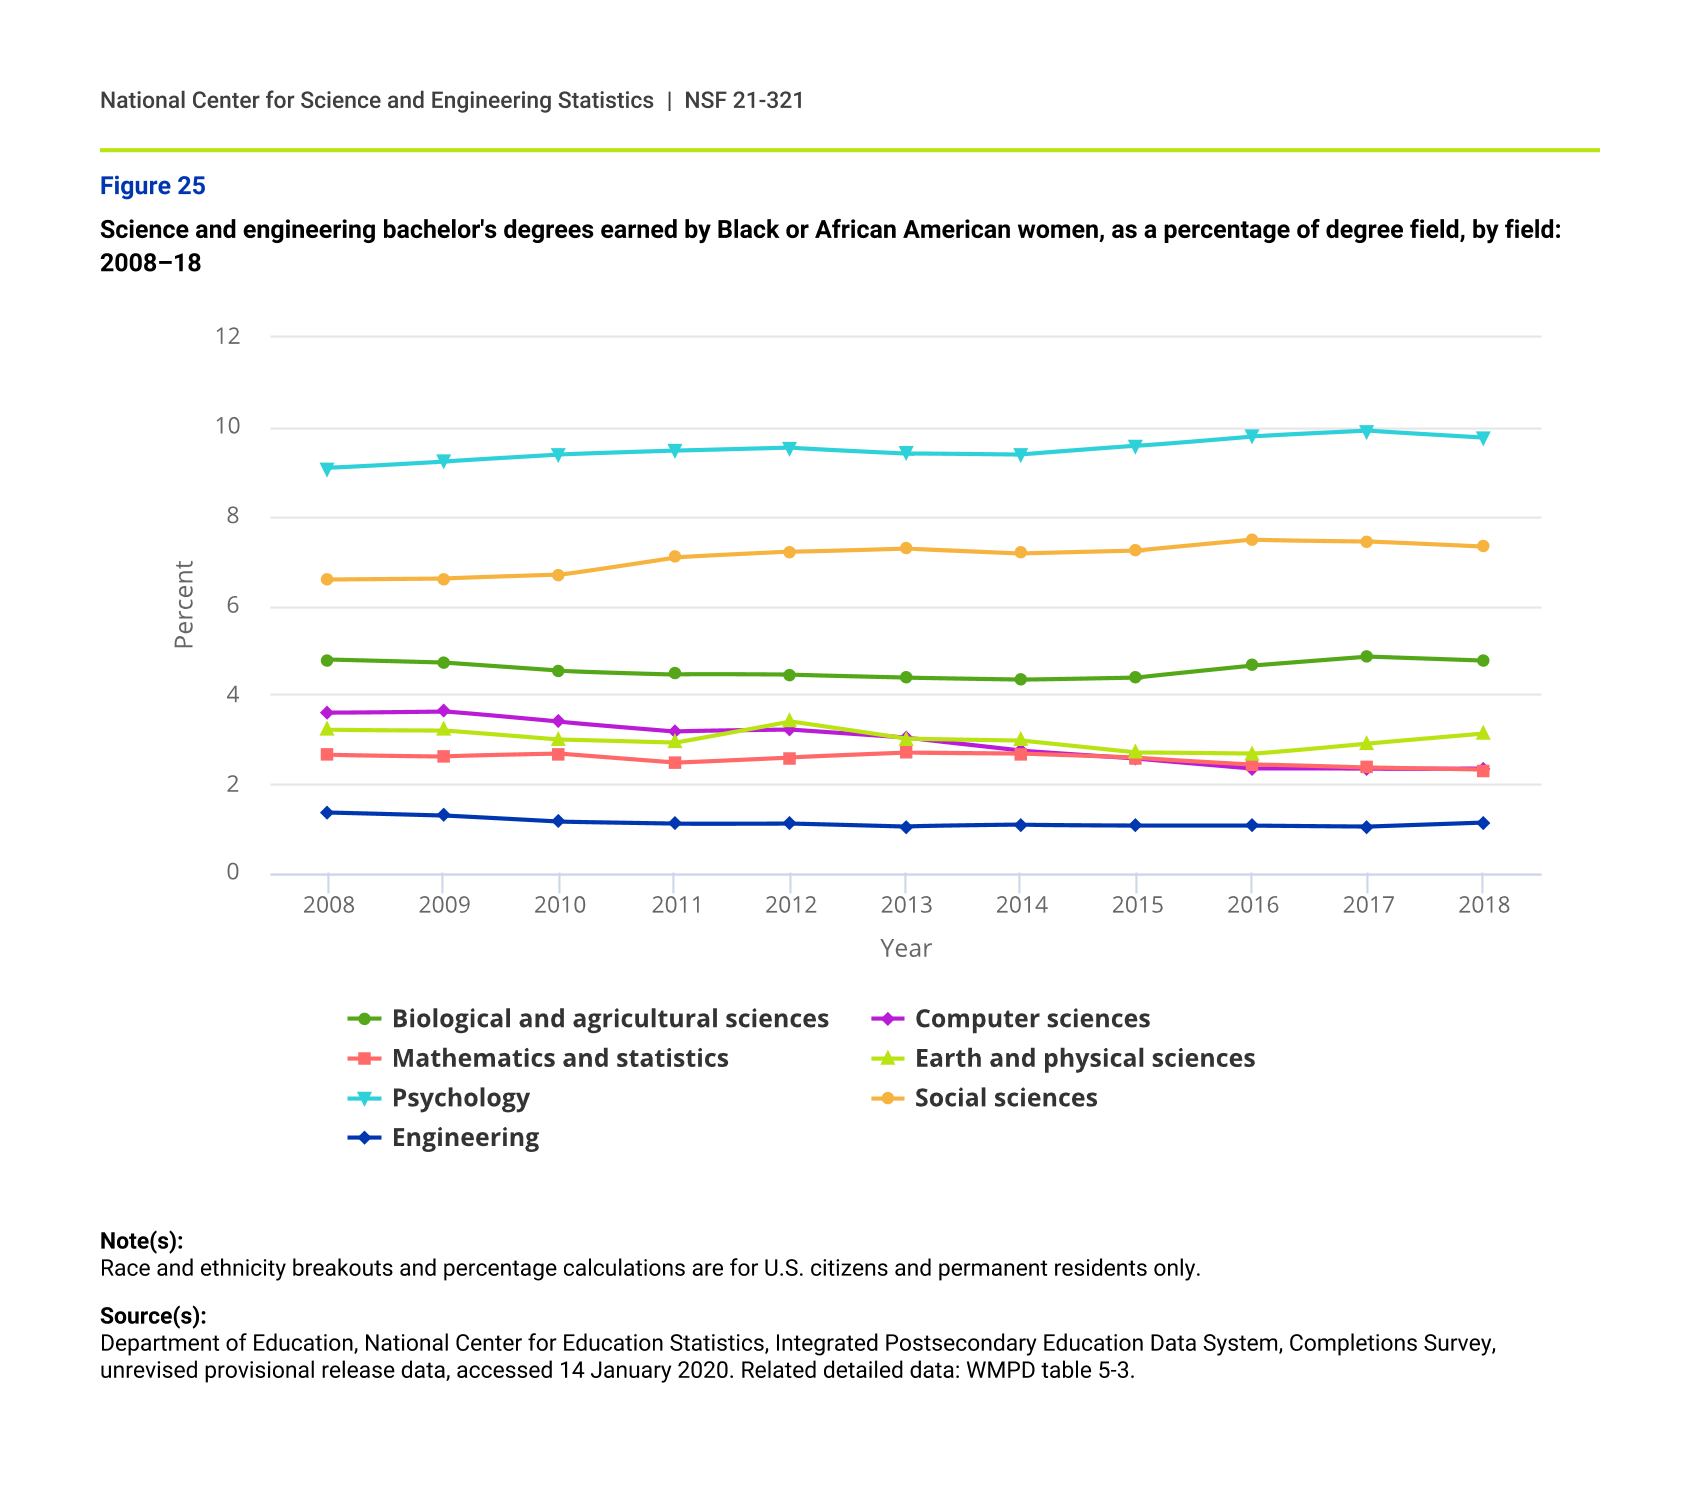
Black or African American women, similar to Hispanic or Latino women, earned a higher share of bachelor’s degrees in psychology, social sciences, and biological and agricultural sciences than they did in any other broad S&E field. Their shares in these fields and other S&E fields were stable despite an increase in their numbers in these fields. The number of Black or African American women who received S&E bachelor’s degrees increased from 26,229 in 2008 to 34,359 in 2018, a 31.0% increase, somewhat trailing the 37.7% increase in bachelor’s degrees in S&E awarded to U.S. citizens and permanent residents over the same period. In 2018, Black or African American women received over 1,200 bachelor’s degrees in engineering, one of the fields with low shares of Black or African American female participation, which was the peak number of recipients over the previous decade (figure 25).
Science and engineering bachelor's degrees earned by Black or African American women, as a percentage of degree field, by field: 2008–18
| Year | Biological and agricultural sciences | Computer sciences | Mathematics and statistics | Earth and physical sciences | Psychology | Social sciences | Engineering |
|---|---|---|---|---|---|---|---|
| 2008 | 4.78 | 3.60 | 2.65 | 3.21 | 9.08 | 6.58 | 1.36 |
| 2009 | 4.71 | 3.63 | 2.62 | 3.20 | 9.23 | 6.60 | 1.29 |
| 2010 | 4.53 | 3.39 | 2.67 | 2.99 | 9.38 | 6.68 | 1.15 |
| 2011 | 4.46 | 3.18 | 2.47 | 2.92 | 9.46 | 7.08 | 1.11 |
| 2012 | 4.44 | 3.21 | 2.59 | 3.40 | 9.53 | 7.20 | 1.12 |
| 2013 | 4.38 | 3.03 | 2.69 | 3.01 | 9.41 | 7.28 | 1.05 |
| 2014 | 4.34 | 2.74 | 2.67 | 2.97 | 9.38 | 7.17 | 1.08 |
| 2015 | 4.39 | 2.57 | 2.58 | 2.70 | 9.57 | 7.23 | 1.07 |
| 2016 | 4.65 | 2.35 | 2.44 | 2.67 | 9.79 | 7.47 | 1.07 |
| 2017 | 4.85 | 2.34 | 2.36 | 2.91 | 9.91 | 7.44 | 1.05 |
| 2018 | 4.76 | 2.35 | 2.31 | 3.13 | 9.76 | 7.32 | 1.14 |
Note(s):
Race and ethnicity breakouts and percentage calculations are for U.S. citizens and permanent residents only.
Source(s):
Department of Education, National Center for Education Statistics, Integrated Postsecondary Education Data System, Completions Survey, unrevised provisional release data, accessed 14 January 2020. Related detailed data: WMPD table 5-3.
Native Hawaiians or Other Pacific Islanders
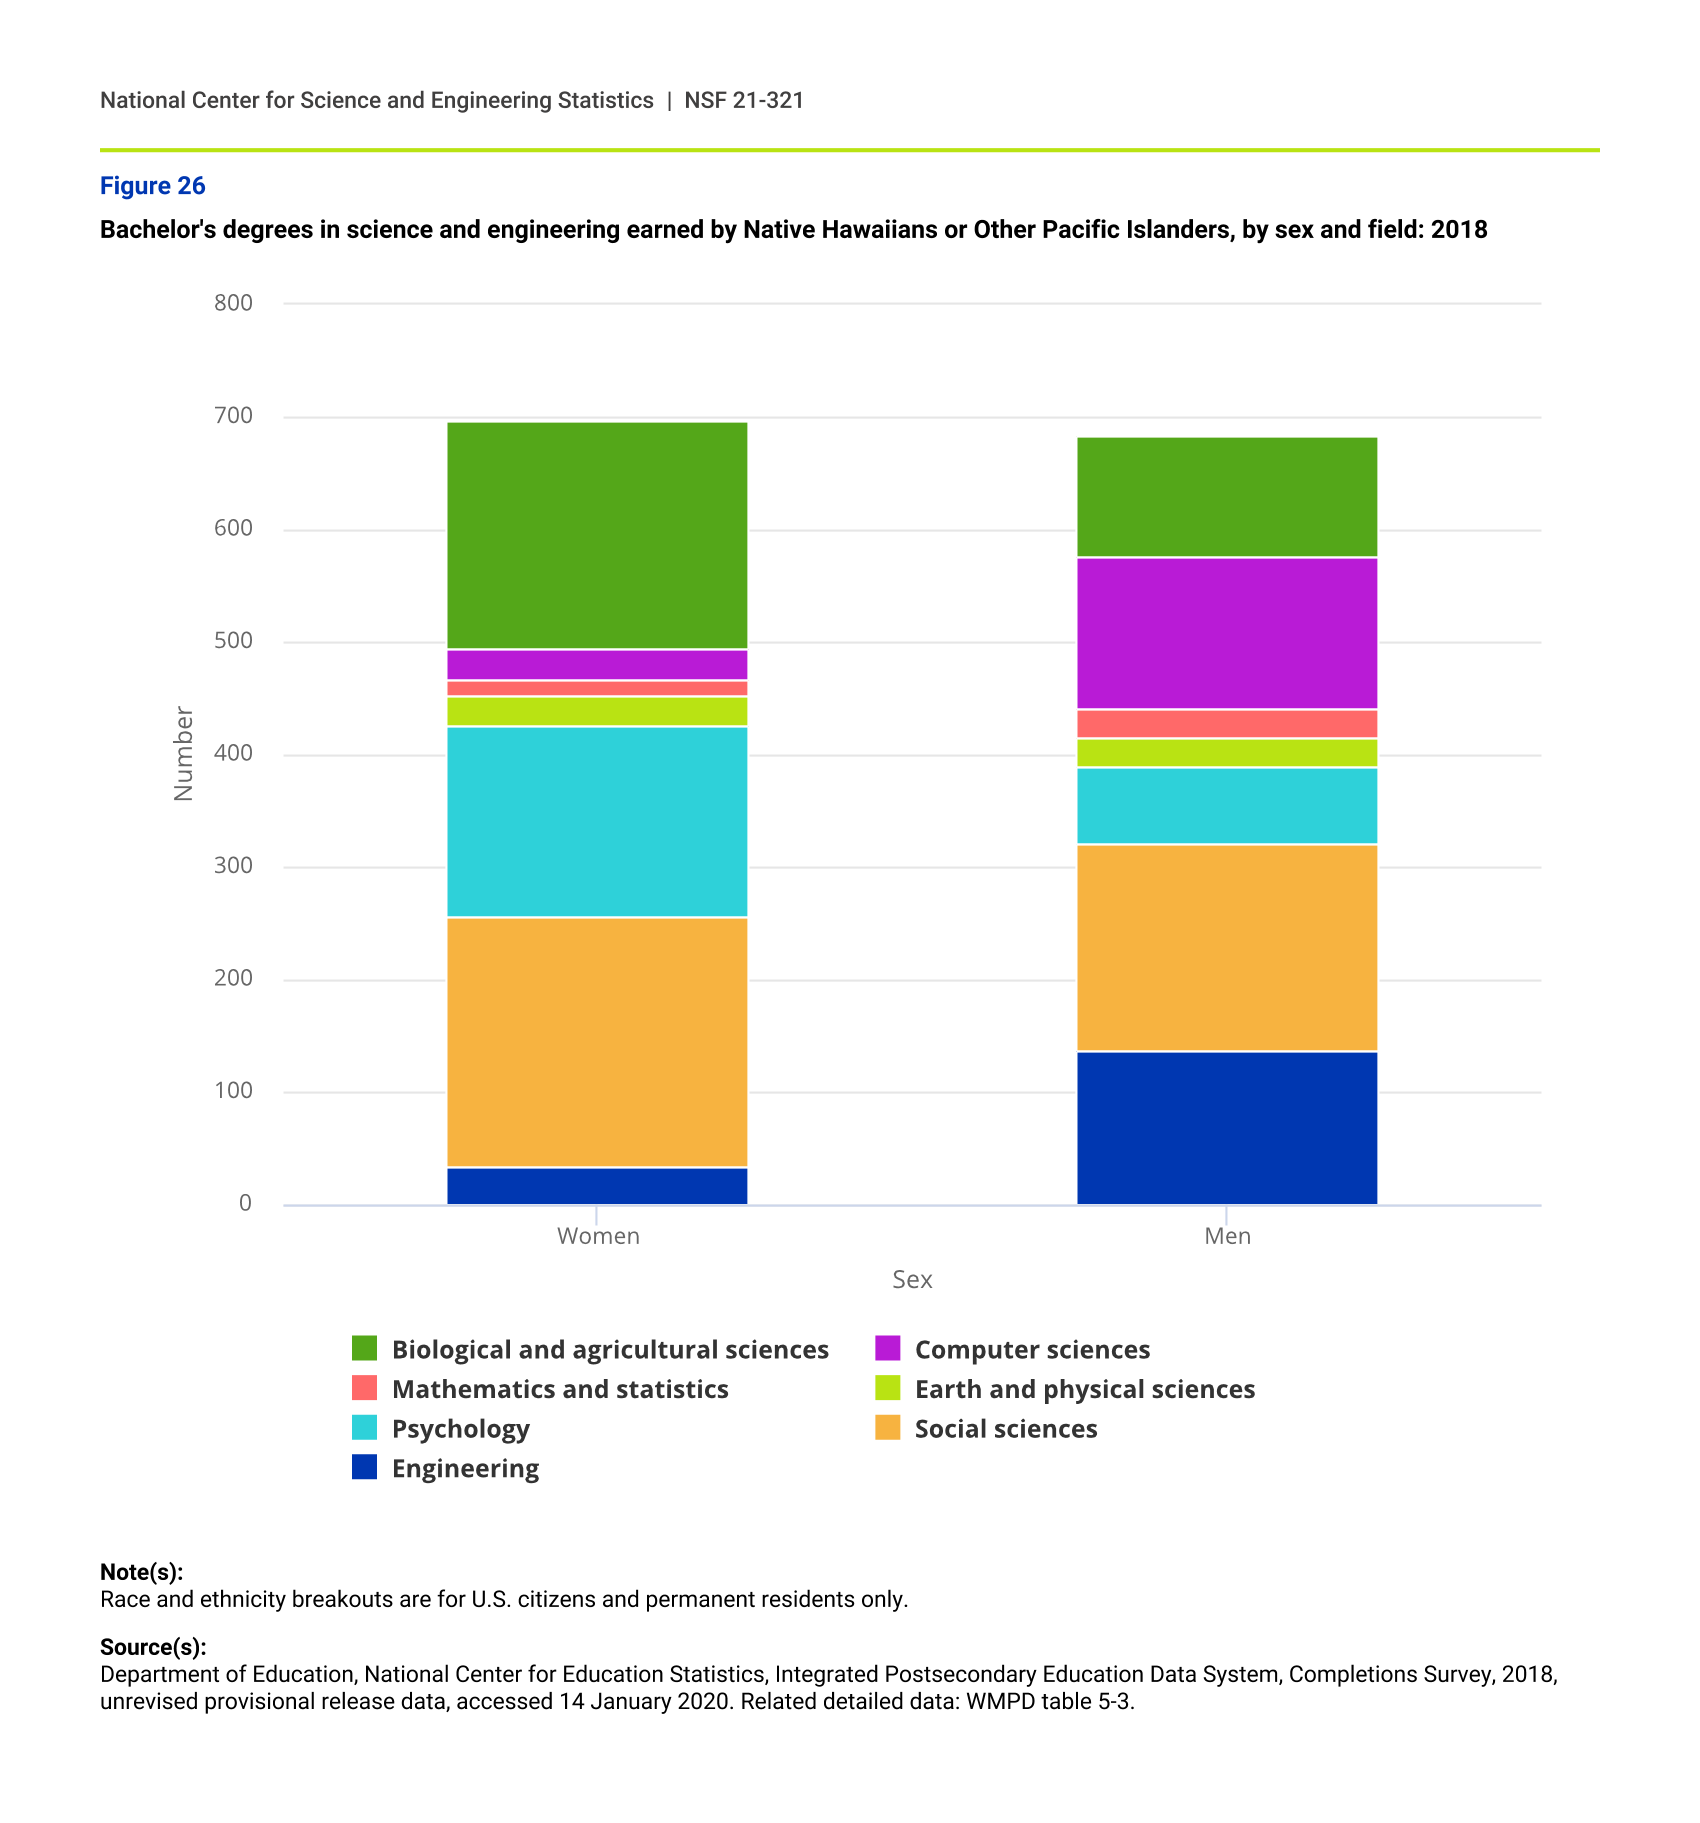
A small minority group that is not always presented in detail due to numerical constraints is Native Hawaiians or Other Pacific Islanders. A total of 1,379 bachelor’s degrees in S&E fields were awarded to individuals in this group in 2018 (from a total of more than 660,000 S&E bachelor’s degrees), down from a peak of 1,611 in 2015. Social sciences, biological and agricultural sciences, and psychology had the most female Native Hawaiians or Other Pacific Islanders bachelor’s degree recipients, whereas men most frequently studied social sciences, engineering, and computer sciences. In 2018, slightly more Native Hawaiian or Other Pacific Islander women received bachelor’s degrees in S&E than their male counterparts (figure 26).
Bachelor's degrees in science and engineering earned by Native Hawaiians or Other Pacific Islanders, by sex and field: 2018
| Sex | Engineering | Social sciences | Psychology | Earth and physical sciences | Mathematics and statistics | Computer sciences | Biological and agricultural sciences |
|---|---|---|---|---|---|---|---|
| Women | 34 | 222 | 170 | 26 | 15 | 27 | 202 |
| Men | 137 | 183 | 69 | 26 | 26 | 135 | 107 |
Note(s):
Race and ethnicity breakouts are for U.S. citizens and permanent residents only.
Source(s):
Department of Education, National Center for Education Statistics, Integrated Postsecondary Education Data System, Completions Survey, 2018, unrevised provisional release data, accessed 14 January 2020. Related detailed data: WMPD table 5-3.
Asian women
Asian women earned their largest number of S&E bachelor’s degrees in biological and agricultural sciences (almost 12,000 graduates in 2018, and 7.8% of the field). In most S&E fields, the shares of Asian women have slowly increased over the past few years, with the exception of computer sciences where the number of graduates more than tripled in the past 5 years. Despite relatively small numbers in mathematics and statistics, Asian women received over 1,300 bachelor’s degrees in this field in 2018, 5.8% of the field and almost double the number in 2011. Likewise, in earth and physical sciences, Asian women received over 1,300 bachelor’s degrees, 4.6% of the field in 2018 (figure 27).
Science and engineering bachelor's degrees earned by Asian women, by field: 2013 and 2018
| Field | 2018 | 2013 |
|---|---|---|
| Biological and agricultural sciences | 11,853 | 9,719 |
| Computer sciences | 3,033 | 903 |
| Mathematics and statistics | 1,303 | 825 |
| Earth and physical sciences | 1,342 | 1,166 |
| Psychology | 5,488 | 4,981 |
| Social sciences | 6,851 | 7,118 |
| Engineering | 3,717 | 2,235 |
Note(s):
In 2013, Asian women were 4.7% of bachelor's degrees in science and engineering, and in 2018 they were 5.1%. Race and ethnicity breakouts are for U.S. citizens and permanent residents only.
Source(s):
Department of Education, National Center for Education Statistics, Integrated Postsecondary Education Data System, Completions Survey, unrevised provisional release data, accessed 14 January 2020. Related detailed data: WMPD table 5-3.