 An official website of the United States government
 Academic careers
Universities play a key role in the nation’s science and engineering (S&E) enterprise by educating and training students in research practices and by performing a large share of the nation’s basic research. The structure of academic employment of science, engineering, and health (SEH) doctorate holders has changed substantially over the past several decades as universities and 4-year colleges have increased their share of part-time faculty. Academic full-time faculty positions are less available today than they were a generation ago. However, the academic workforce is now much more diverse.
Representation
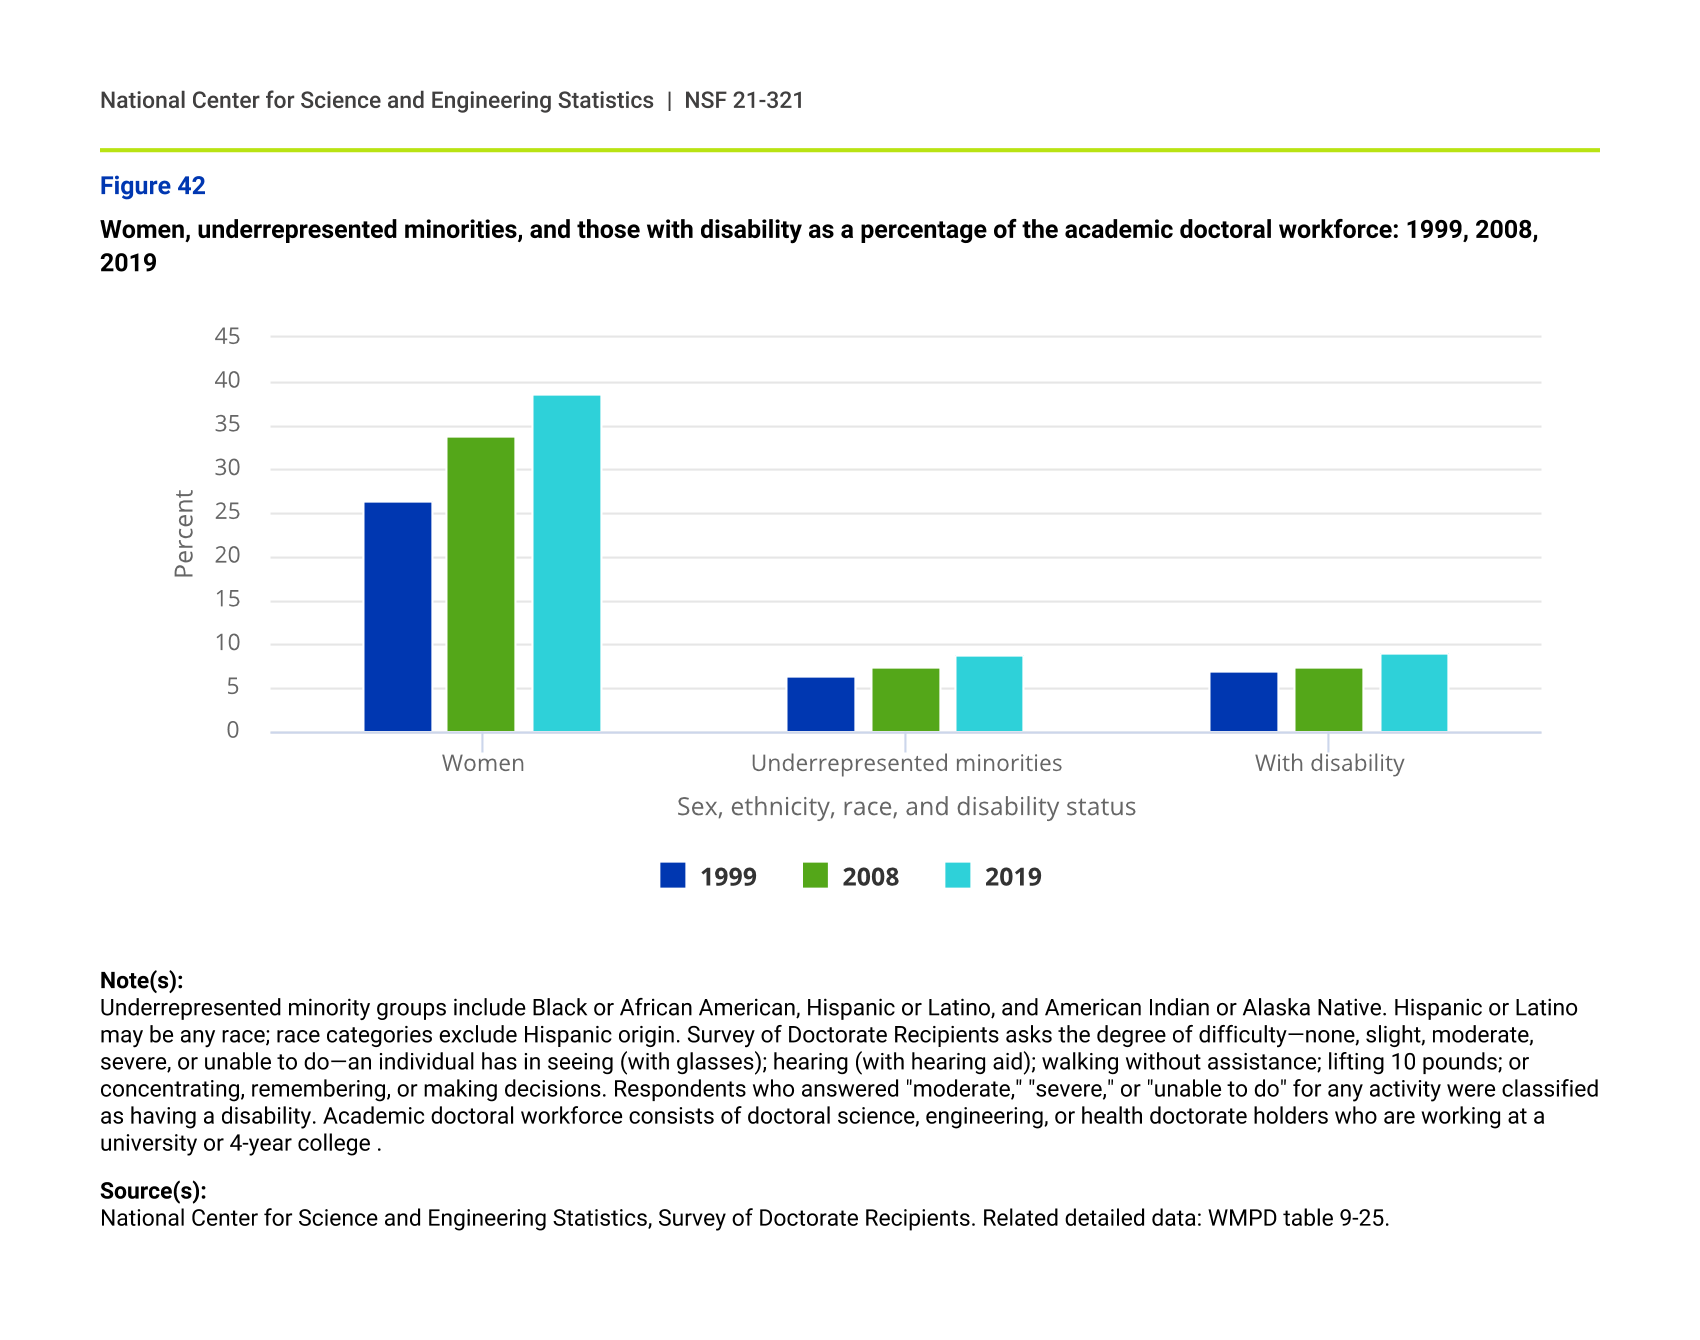
The share of academic doctoral positions held by women with SEH doctoral degrees increased from 26.4% in 1999 to 38.5% in 2019. Underrepresented minorities also hold a larger share of these positions than they did in 1999, although their share remains small (8.9%) and is considerably less than their share of the population, which is about a third of the U.S. population ages 18–64. The share of those in academic doctoral positions with one or more disabilities increased to 9.1%, slightly less than their share in the population (10.5%) (figure 42).
Women, underrepresented minorities, and those with disability as a percentage of the academic doctoral workforce: 1999, 2008, 2019
| Sex, ethnicity, race, and disability status | 1999 | 2008 | 2019 |
|---|---|---|---|
| Women | 26.4 | 33.7 | 38.5 |
| Underrepresented minorities | 6.4 | 7.5 | 8.9 |
| With disability | 7.0 | 7.3 | 9.1 |
Note(s):
Underrepresented minority groups include Black or African American, Hispanic or Latino, and American Indian or Alaska Native. Hispanic or Latino may be any race; race categories exclude Hispanic origin. Survey of Doctorate Recipients asks the degree of difficulty—none, slight, moderate, severe, or unable to do—an individual has in seeing (with glasses); hearing (with hearing aid); walking without assistance; lifting 10 pounds; or concentrating, remembering, or making decisions. Respondents who answered "moderate," "severe," or "unable to do" for any activity were classified as having a disability. Academic doctoral workforce consists of doctoral science, engineering, or health doctorate holders who are working at a university or 4-year college .
Source(s):
National Center for Science and Engineering Statistics, Survey of Doctorate Recipients. Related detailed data: WMPD table 9-25.
Tenure and academic positions
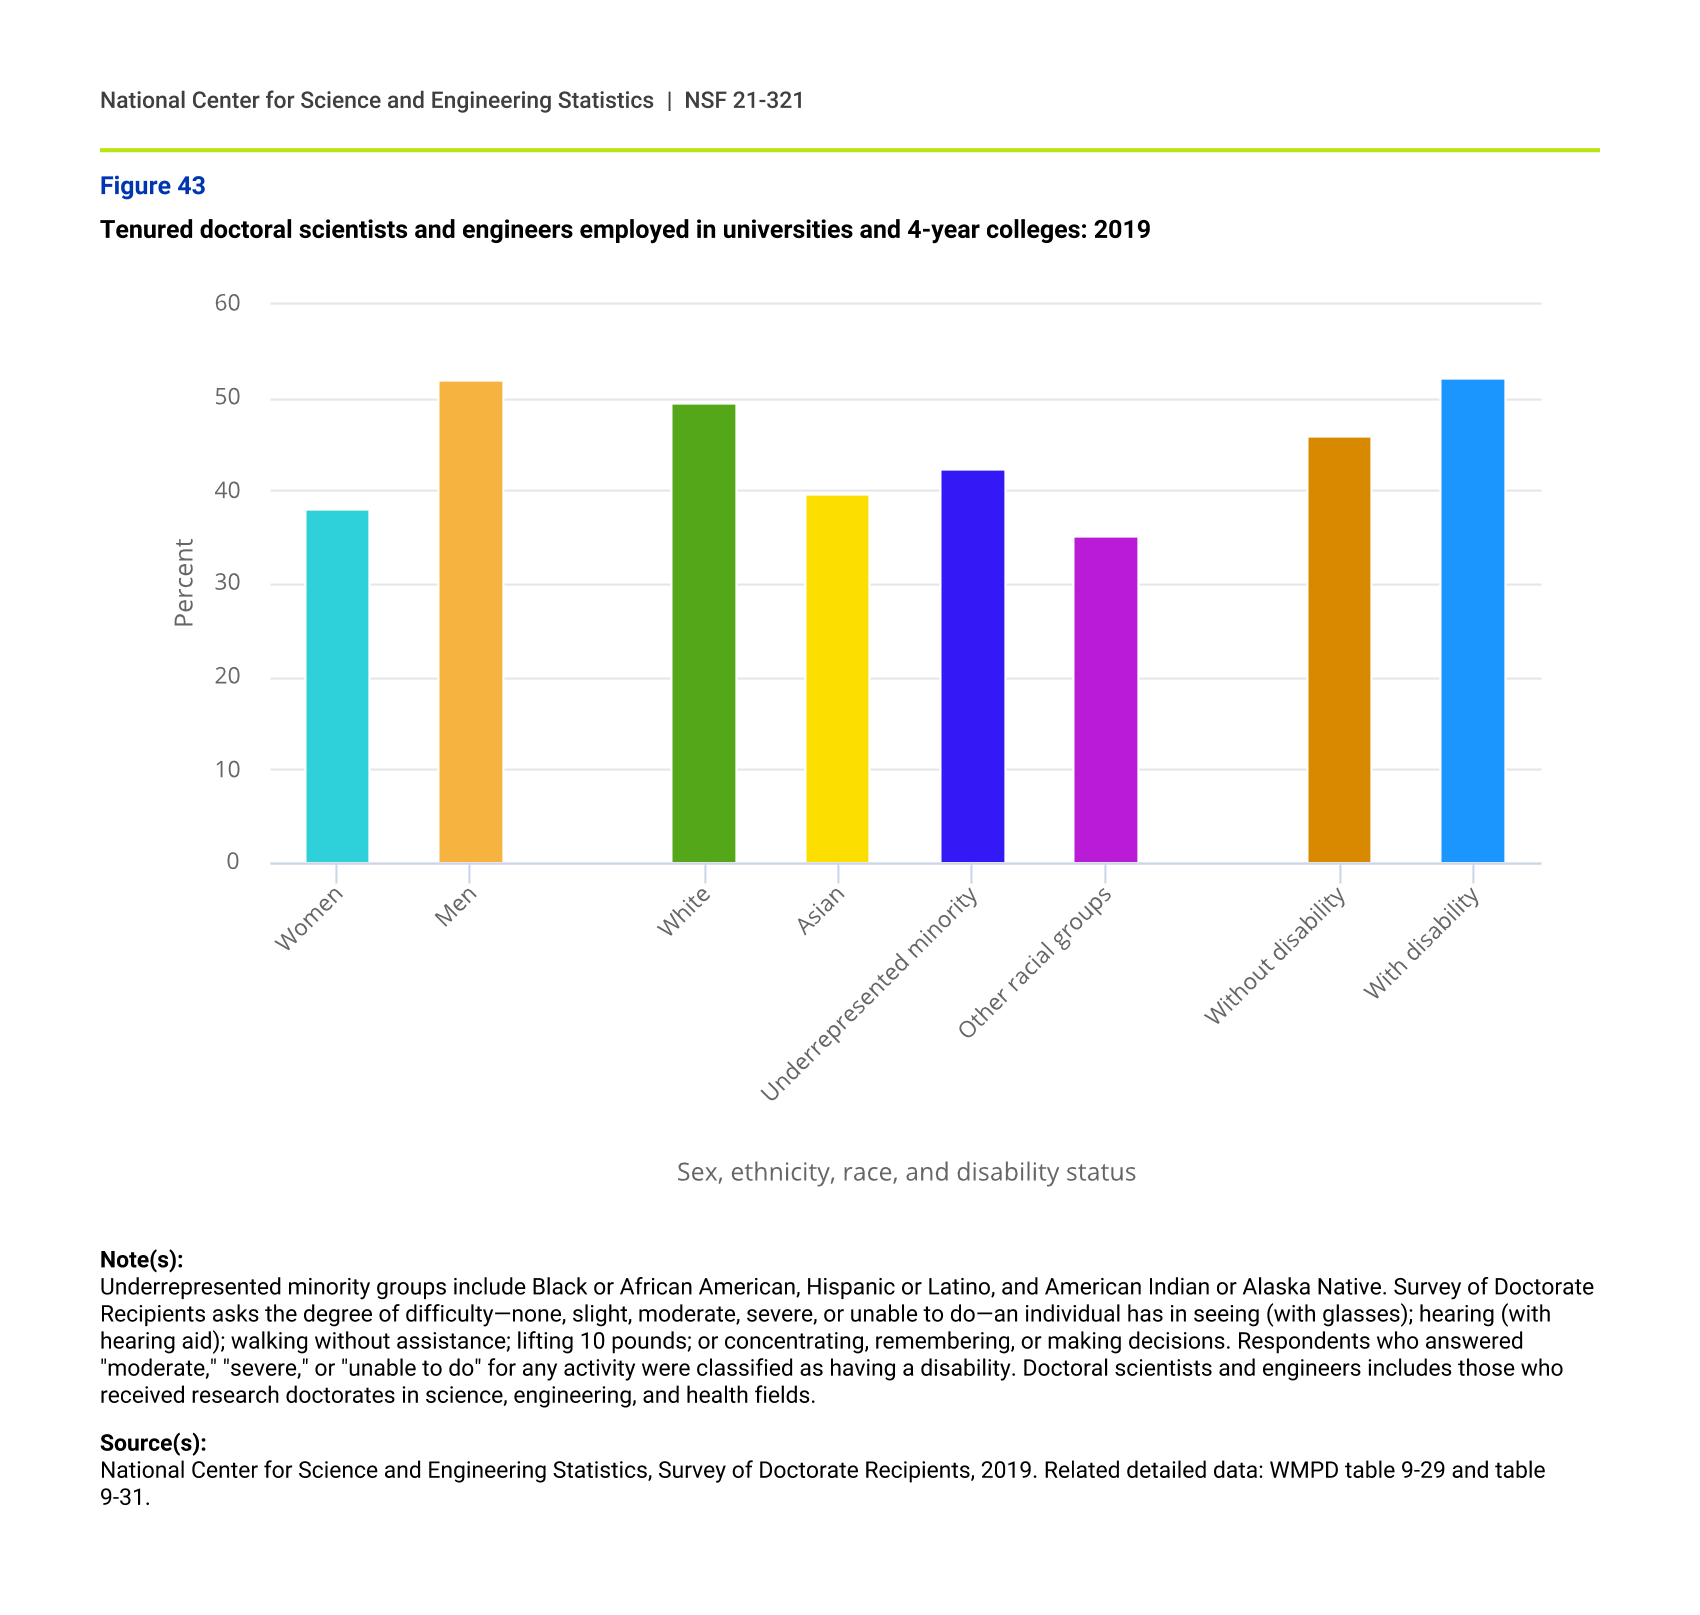
One goal of an academic career is to achieve tenure. Of all SEH doctorate holders employed in either universities or 4-year colleges in 2019, 46.6% were tenured, with an additional 14.8% in tenure-track positions.
Among SEH doctorate holders in academia, a larger share of men than women had tenure in 2019. Whites had the highest rates of tenure, followed by underrepresented minorities and Asians, who had similar tenure rates. Employed SEH doctorate holders who reported at least one disability were tenured at a higher rate than those without disability (figure 43). This is at least in part due to tenured faculty who are older reporting an aging-related disability, such as reduced sight or hearing, more frequently. Also, a larger proportion of older academics are tenured.
Tenured doctoral scientists and engineers employed in universities and 4-year colleges: 2019
| Sex, ethnicity, race, and disability status | Percent |
|---|---|
| Women | 38.0 |
| Men | 52.0 |
| White | 49.4 |
| Asian | 39.7 |
| Underrepresented minority | 42.3 |
| Other racial groups | 35.2 |
| Without disability | 46.0 |
| With disability | 52.2 |
Note(s):
Underrepresented minority groups include Black or African American, Hispanic or Latino, and American Indian or Alaska Native. Survey of Doctorate Recipients asks the degree of difficulty—none, slight, moderate, severe, or unable to do—an individual has in seeing (with glasses); hearing (with hearing aid); walking without assistance; lifting 10 pounds; or concentrating, remembering, or making decisions. Respondents who answered "moderate," "severe," or "unable to do" for any activity were classified as having a disability. Doctoral scientists and engineers includes those who received research doctorates in science, engineering, and health fields.
Source(s):
National Center for Science and Engineering Statistics, Survey of Doctorate Recipients, 2019. Related detailed data: WMPD table 9-29 and table 9-31.
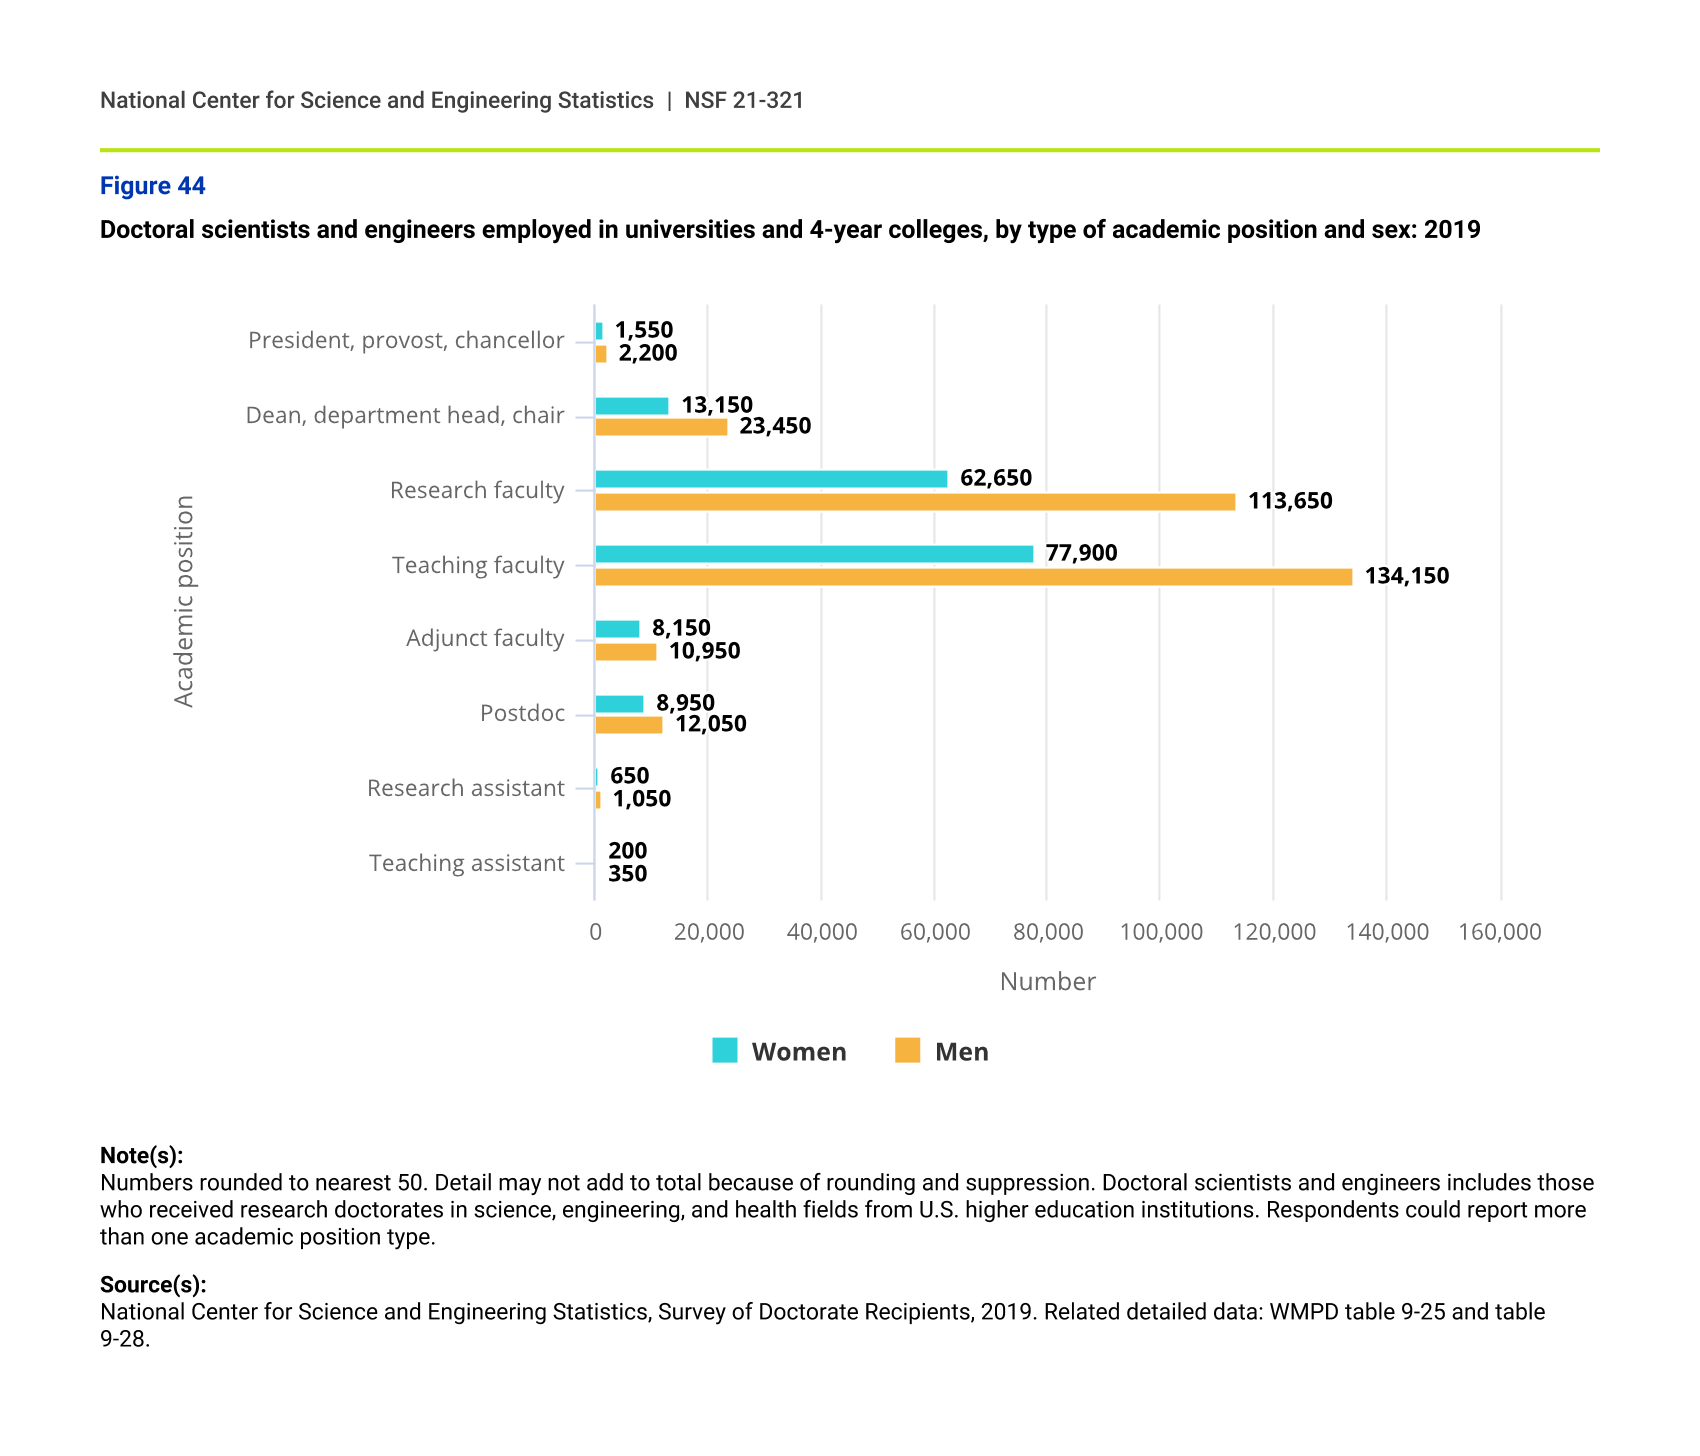
Looking at types of academic positions, SEH male doctorate holders outnumbered their female counterparts across all major positions in 2019. In particular, women made up about 36% of both research faculty and teaching faculty. Research and teaching assistant numbers were small for men and women (figure 44).
Doctoral scientists and engineers employed in universities and 4-year colleges, by type of academic position and sex: 2019
| Academic position | Women | Men |
|---|---|---|
| President, provost, chancellor | 1,550 | 2,200 |
| Dean, department head, chair | 13,150 | 23,450 |
| Research faculty | 62,650 | 113,650 |
| Teaching faculty | 77,900 | 134,150 |
| Adjunct faculty | 8,150 | 10,950 |
| Postdoc | 8,950 | 12,050 |
| Research assistant | 650 | 1,050 |
| Teaching assistant | 200 | 350 |
Note(s):
Numbers rounded to nearest 50. Detail may not add to total because of rounding and suppression. Doctoral scientists and engineers includes those who received research doctorates in science, engineering, and health fields from U.S. higher education institutions. Respondents could report more than one academic position type.
Source(s):
National Center for Science and Engineering Statistics, Survey of Doctorate Recipients, 2019. Related detailed data: WMPD table 9-25 and table 9-28.
Work related to degree
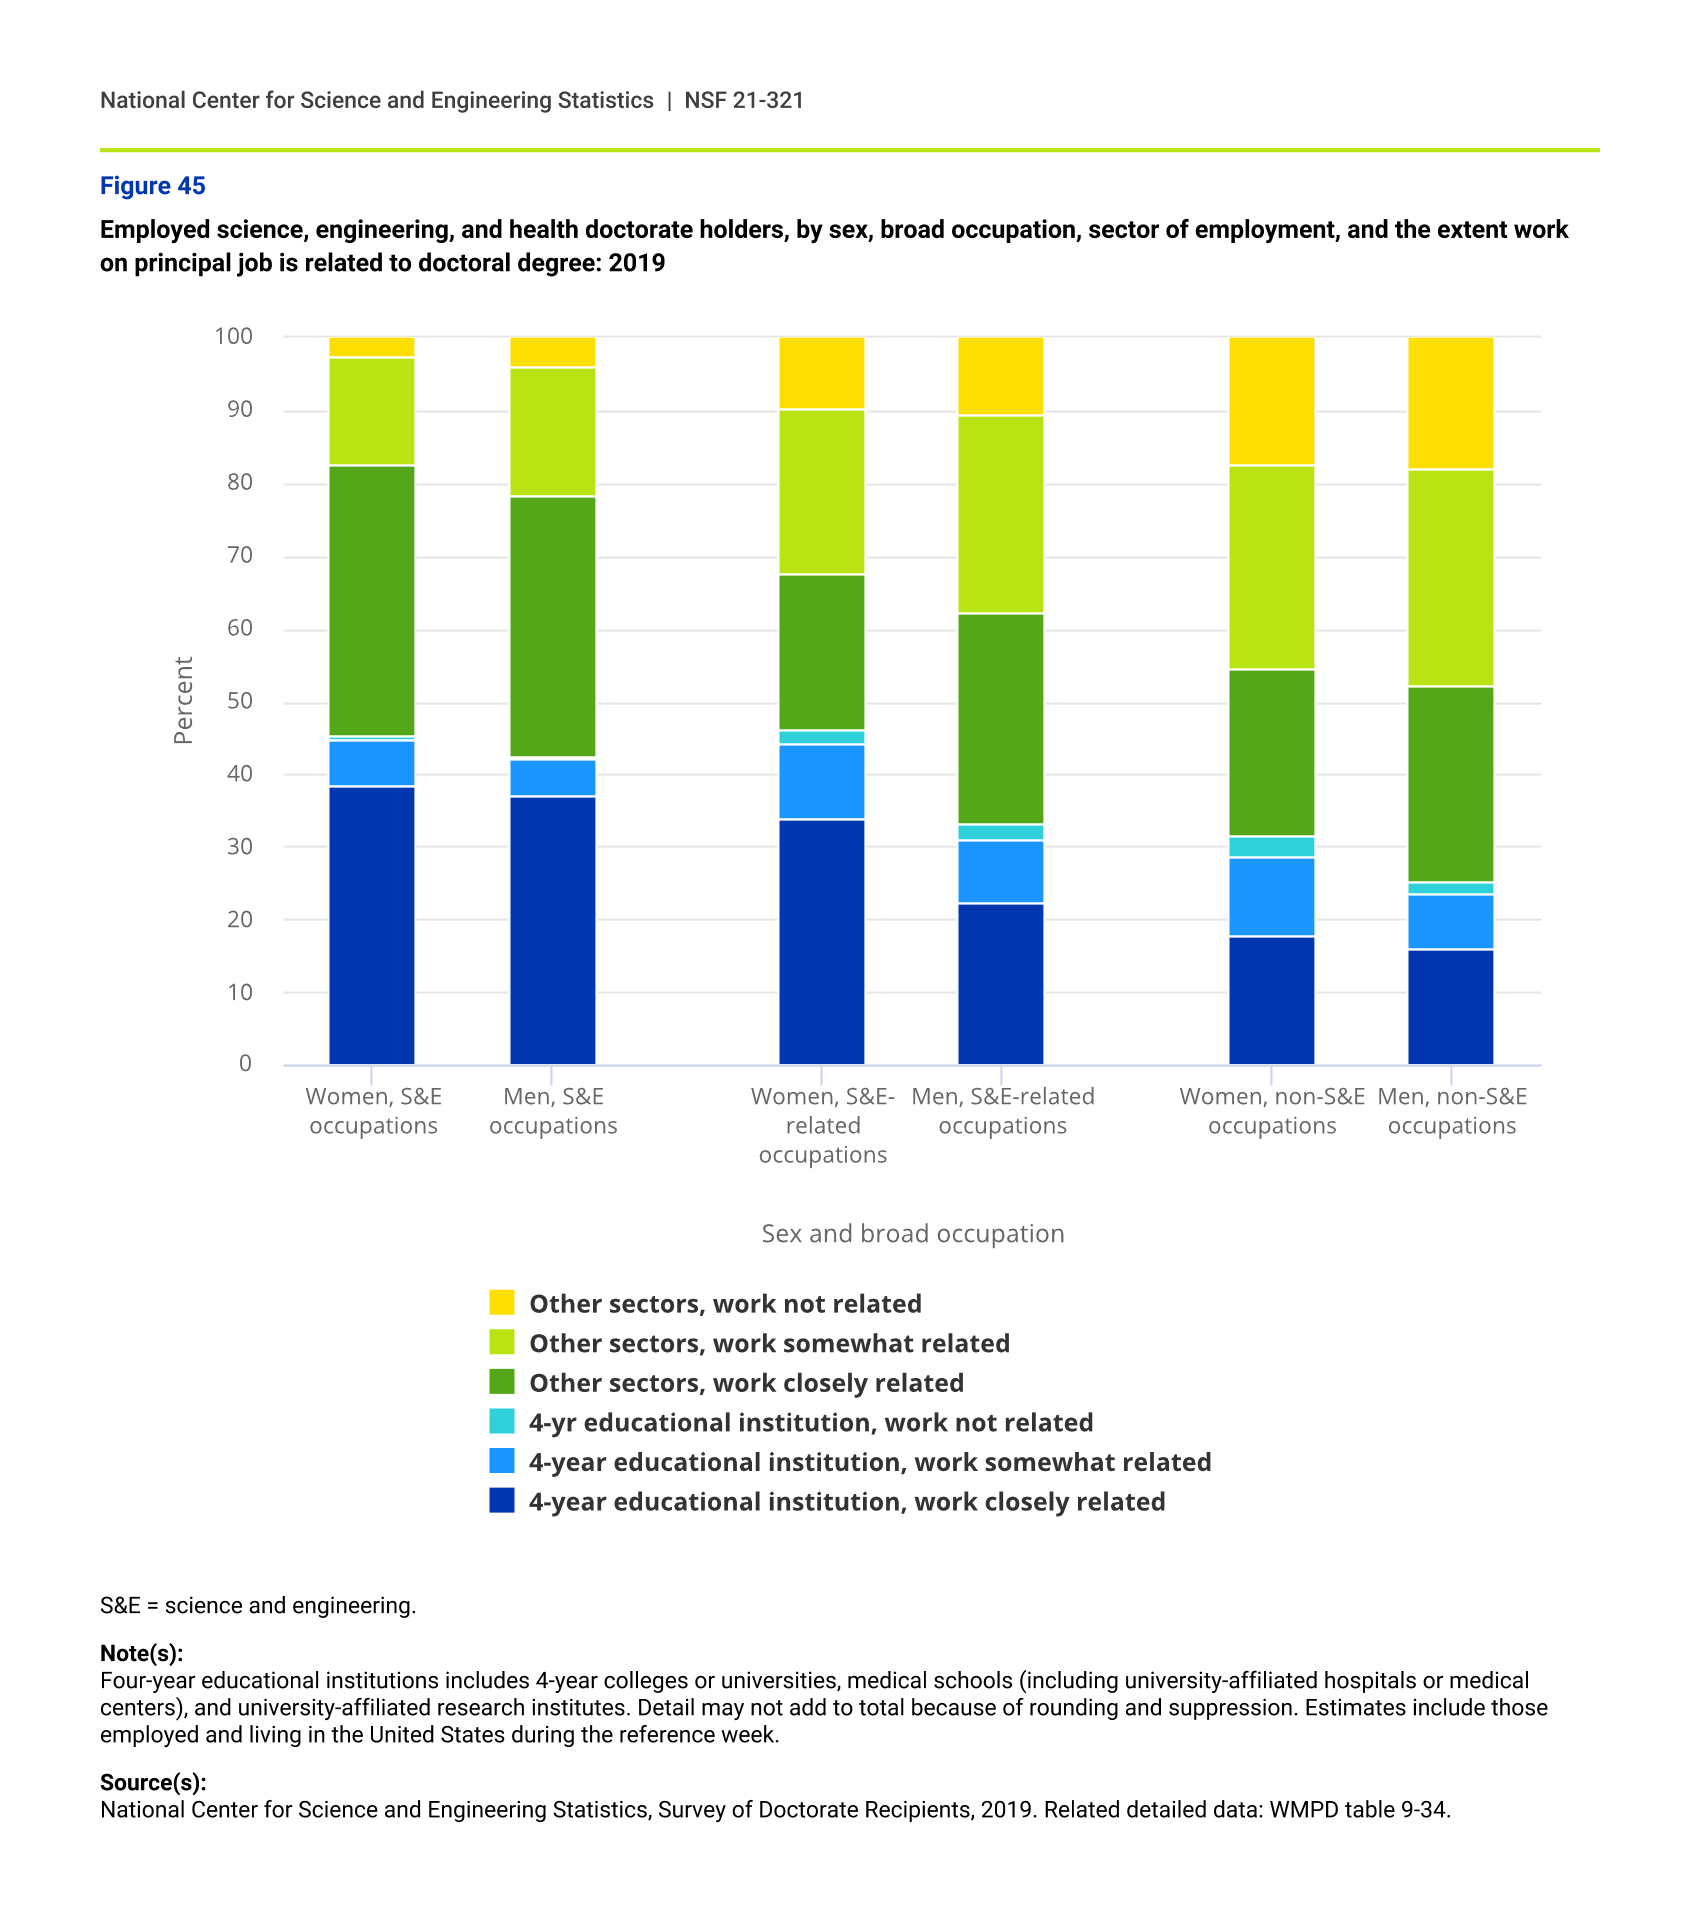
When SEH doctorate holders were asked how related their work was to their doctoral degree, a larger share of women than men who had S&E positions at 4-year educational institutions said that their work was closely related to their degree (38.5% versus 36.9%). In addition, over a third of both women and men were able to find S&E jobs in other sectors that were closely related to their degree, although the share of women was larger than that of men (37.3% versus 35.7%). How closely related SEH doctorate holders’ work was to their degree generally declined going from S&E positions to S&E-related positions to non-S&E positions (figure 45).
Employed science, engineering, and health doctorate holders, by sex, broad occupation, sector of employment, and the extent work on principal job is related to doctoral degree: 2019
| Sex and broad occupation | 4-year educational institution, work closely related | 4-year educational institution, work somewhat related | 4-yr educational institution, work not related | Other sectors, work closely related | Other sectors, work somewhat related | Other sectors, work not related |
|---|---|---|---|---|---|---|
| Women, S&E occupations | 38.5 | 6.1 | 0.6 | 37.3 | 14.9 | 2.5 |
| Men, S&E occupations | 36.9 | 5.1 | 0.5 | 35.7 | 17.9 | 3.9 |
| Women, S&E-related occupations | 33.8 | 10.4 | 1.8 | 21.5 | 22.9 | 9.6 |
| Men, S&E-related occupations | 22.3 | 8.6 | 2.2 | 29.0 | 27.4 | 10.5 |
| Women, non-S&E occupations | 17.7 | 10.9 | 3.0 | 22.7 | 28.1 | 17.6 |
| Men, non-S&E occupations | 15.9 | 7.5 | 1.9 | 26.7 | 29.8 | 18.1 |
S&E = science and engineering.
Note(s):
Four-year educational institutions includes 4-year colleges or universities, medical schools (including university-affiliated hospitals or medical centers), and university-affiliated research institutes. Detail may not add to total because of rounding and suppression. Estimates include those employed and living in the United States during the reference week.
Source(s):
National Center for Science and Engineering Statistics, Survey of Doctorate Recipients, 2019. Related detailed data: WMPD table 9-34.
Salary
Overall, SEH doctorate holders who were employed full-time had a median salary of $119,000 in 2019. Among those who held positions at 4-year educational institutions and were tenured or on tenure track, the median salary was $110,000 for men and $95,000 for women. Those in the private sector had the highest median salaries ($150,000 for men and $122,000 for women) (figure 46).
Median annual salary of employed science, engineering, and health doctorate holders, by type of employer and sex: 2019
| Type of employer | Women | Men |
|---|---|---|
| Total | 100,000 | 127,000 |
| 4-year educational institution | 86,000 | 100,000 |
| Tenure or tenure track | 95,000 | 110,000 |
| Not tenure track or tenure not applicable | 72,000 | 80,000 |
| Other educational institution | 76,000 | 76,000 |
| Government | 110,000 | 126,000 |
| Private sector (profit and nonprofit) | 122,000 | 150,000 |
Note(s):
Four-year educational institutions includes 4-year colleges or universities, medical schools, and university-affiliated research institutes. Other educational institutions includes 2-year colleges, community colleges, or technical institutes, and other precollege institutions. Salaries are rounded to nearest $1,000. Salary data are for those employed full-time at their principal jobs only.
Source(s):
National Center for Science and Engineering Statistics, Survey of Doctorate Recipients, 2019. Related detailed data: WMPD table 9-35.
Early career
Of particular interest are early career doctorate holders, who are transitioning into their careers after graduate school. Of the 73,850 SEH doctorate holders—those who earned a PhD, MD, or equivalent—who graduated in 2016 or 2017, about 2% were unemployed (not employed and looking for work) in 2019 and about 2% more were not in the labor force (not employed and not seeking work).
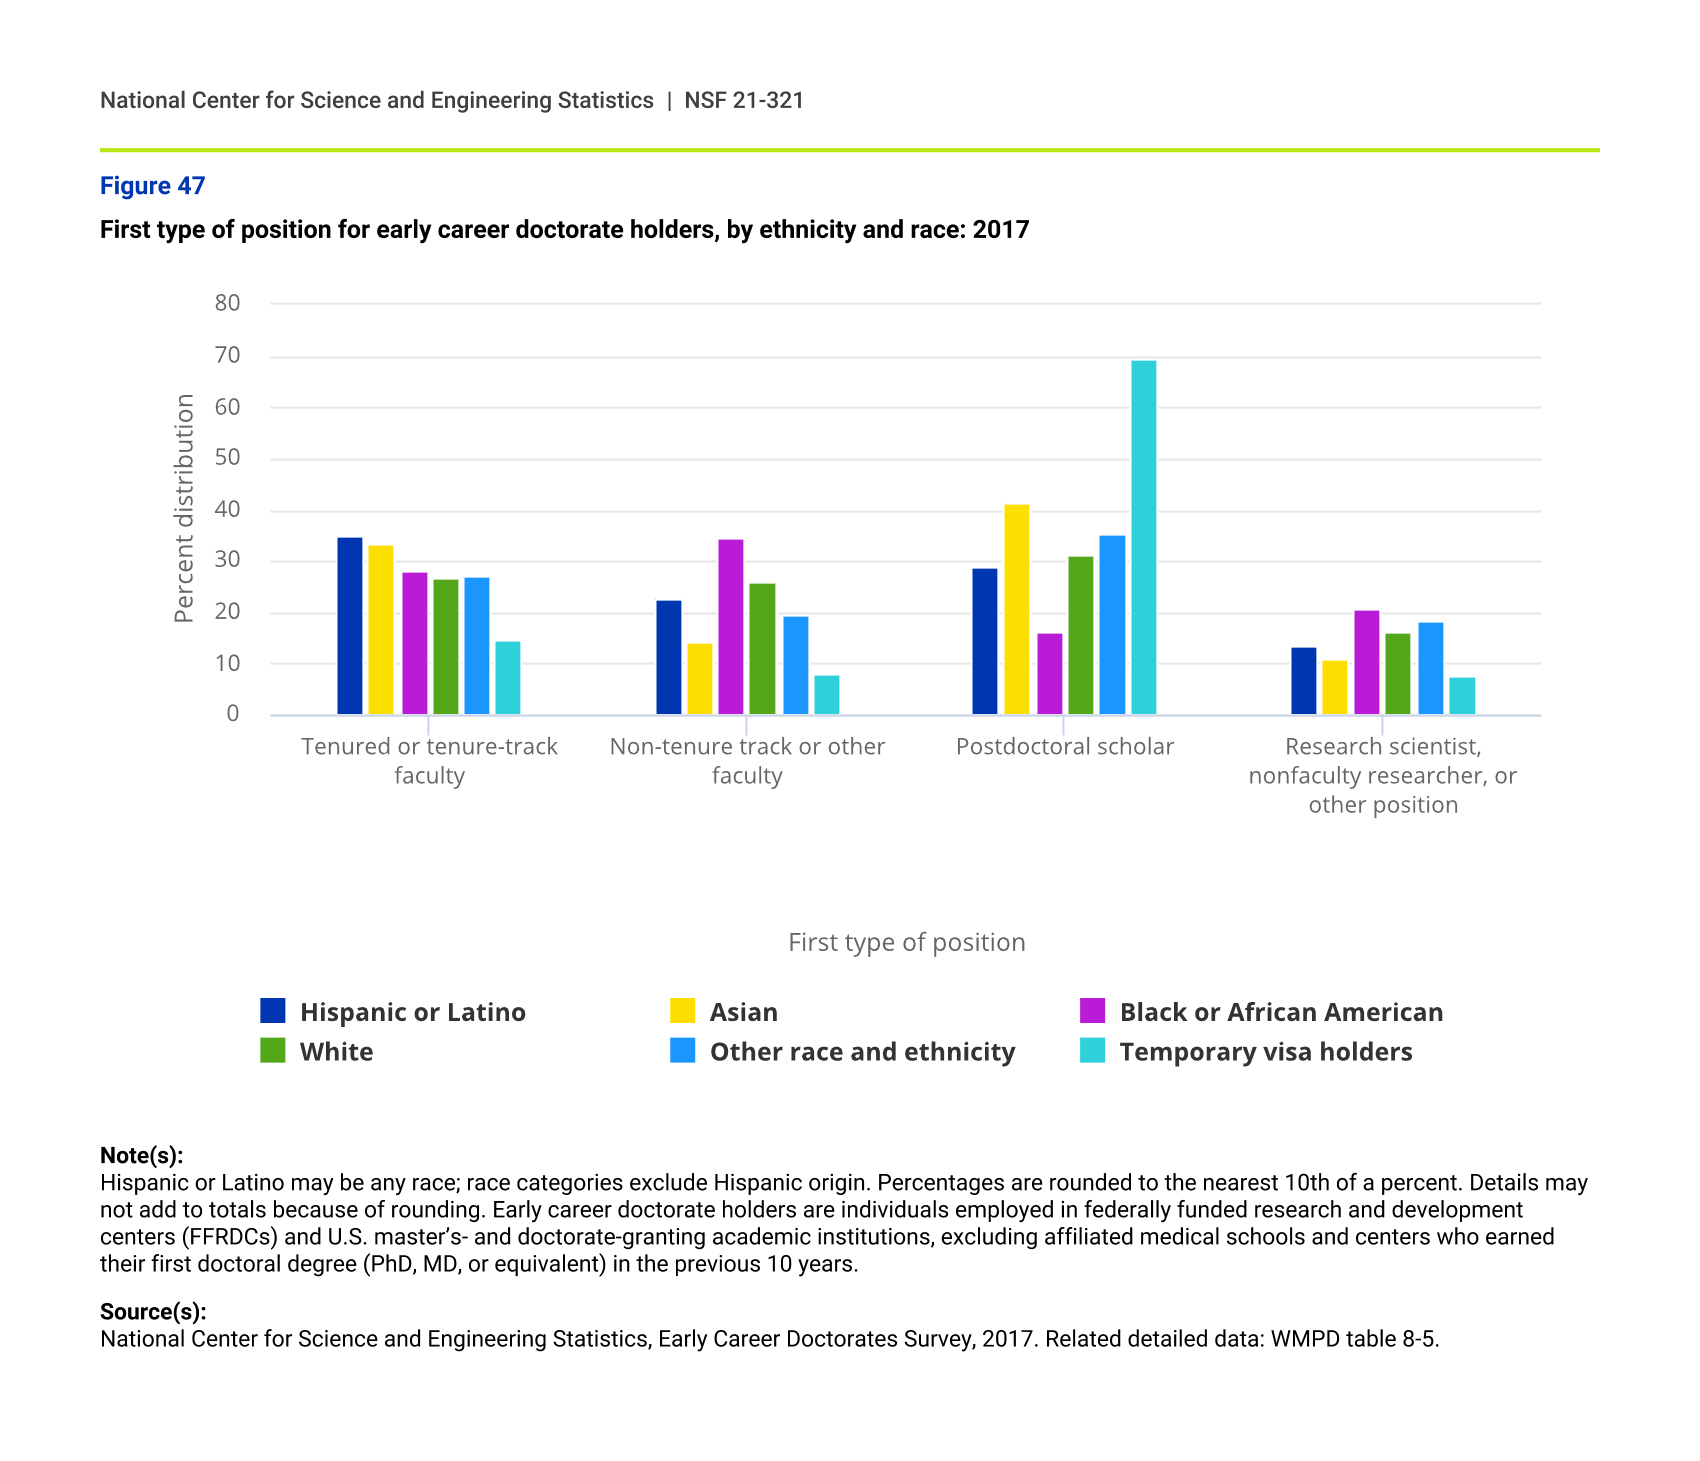
Looking at early career doctorate holders within 10 years of receiving their degree is useful in understanding career paths. The first position a new SEH doctorate recipient holds can serve to launch or stall a career, so it is of interest to look at differences across various demographic groups. Twenty-six percent of all early career doctorate holders employed in federally funded research and development centers (FFRDCs) or U.S. master’s- and doctorate-granting academic institutions, excluding affiliated medical schools and centers, held a tenure or tenure-track position as their first type of position, with similar shares across racial and ethnic groups. Blacks or African Americans had the lowest share of those whose first position was a postdoctoral (postdoc) position (16.4%). In contrast, about 29%–41% of other four racial and ethnic groups held a postdoc position as their first position after receiving their doctorate. Temporary visa degree recipients had the highest incidence of holding a postdoc position as their first position (69.3%) (figure 47).
First type of position for early career doctorate holders, by ethnicity and race: 2017
| First type of position | Hispanic or Latino | Asian | Black or African American | White | Other race and ethnicity | Temporary visa holders |
|---|---|---|---|---|---|---|
| Tenured or tenure-track faculty | 35.0 | 33.3 | 28.2 | 26.6 | 27.2 | 14.8 |
| Non-tenure track or other faculty | 22.8 | 14.2 | 34.6 | 26.0 | 19.3 | 8.1 |
| Postdoctoral scholar | 28.7 | 41.4 | 16.4 | 31.1 | 35.3 | 69.3 |
| Research scientist, nonfaculty researcher, or other position | 13.5 | 11.1 | 20.8 | 16.3 | 18.2 | 7.8 |
Note(s):
Hispanic or Latino may be any race; race categories exclude Hispanic origin. Percentages are rounded to the nearest 10th of a percent. Details may not add to totals because of rounding. Early career doctorate holders are individuals employed in federally funded research and development centers (FFRDCs) and U.S. master’s- and doctorate-granting academic institutions, excluding affiliated medical schools and centers who earned their first doctoral degree (PhD, MD, or equivalent) in the previous 10 years.
Source(s):
National Center for Science and Engineering Statistics, Early Career Doctorates Survey, 2017. Related detailed data: WMPD table 8-5.