 An official website of the United States government
 Occupation
Scientists and engineers—those with at least a bachelor’s degree and a science or engineering (S&E) or S&E-related degree or occupation—generally have higher salaries when working in S&E occupations than in other occupations. However, female scientists and engineers have lower median salaries than do their male counterparts in most occupations.
Science and engineering occupations
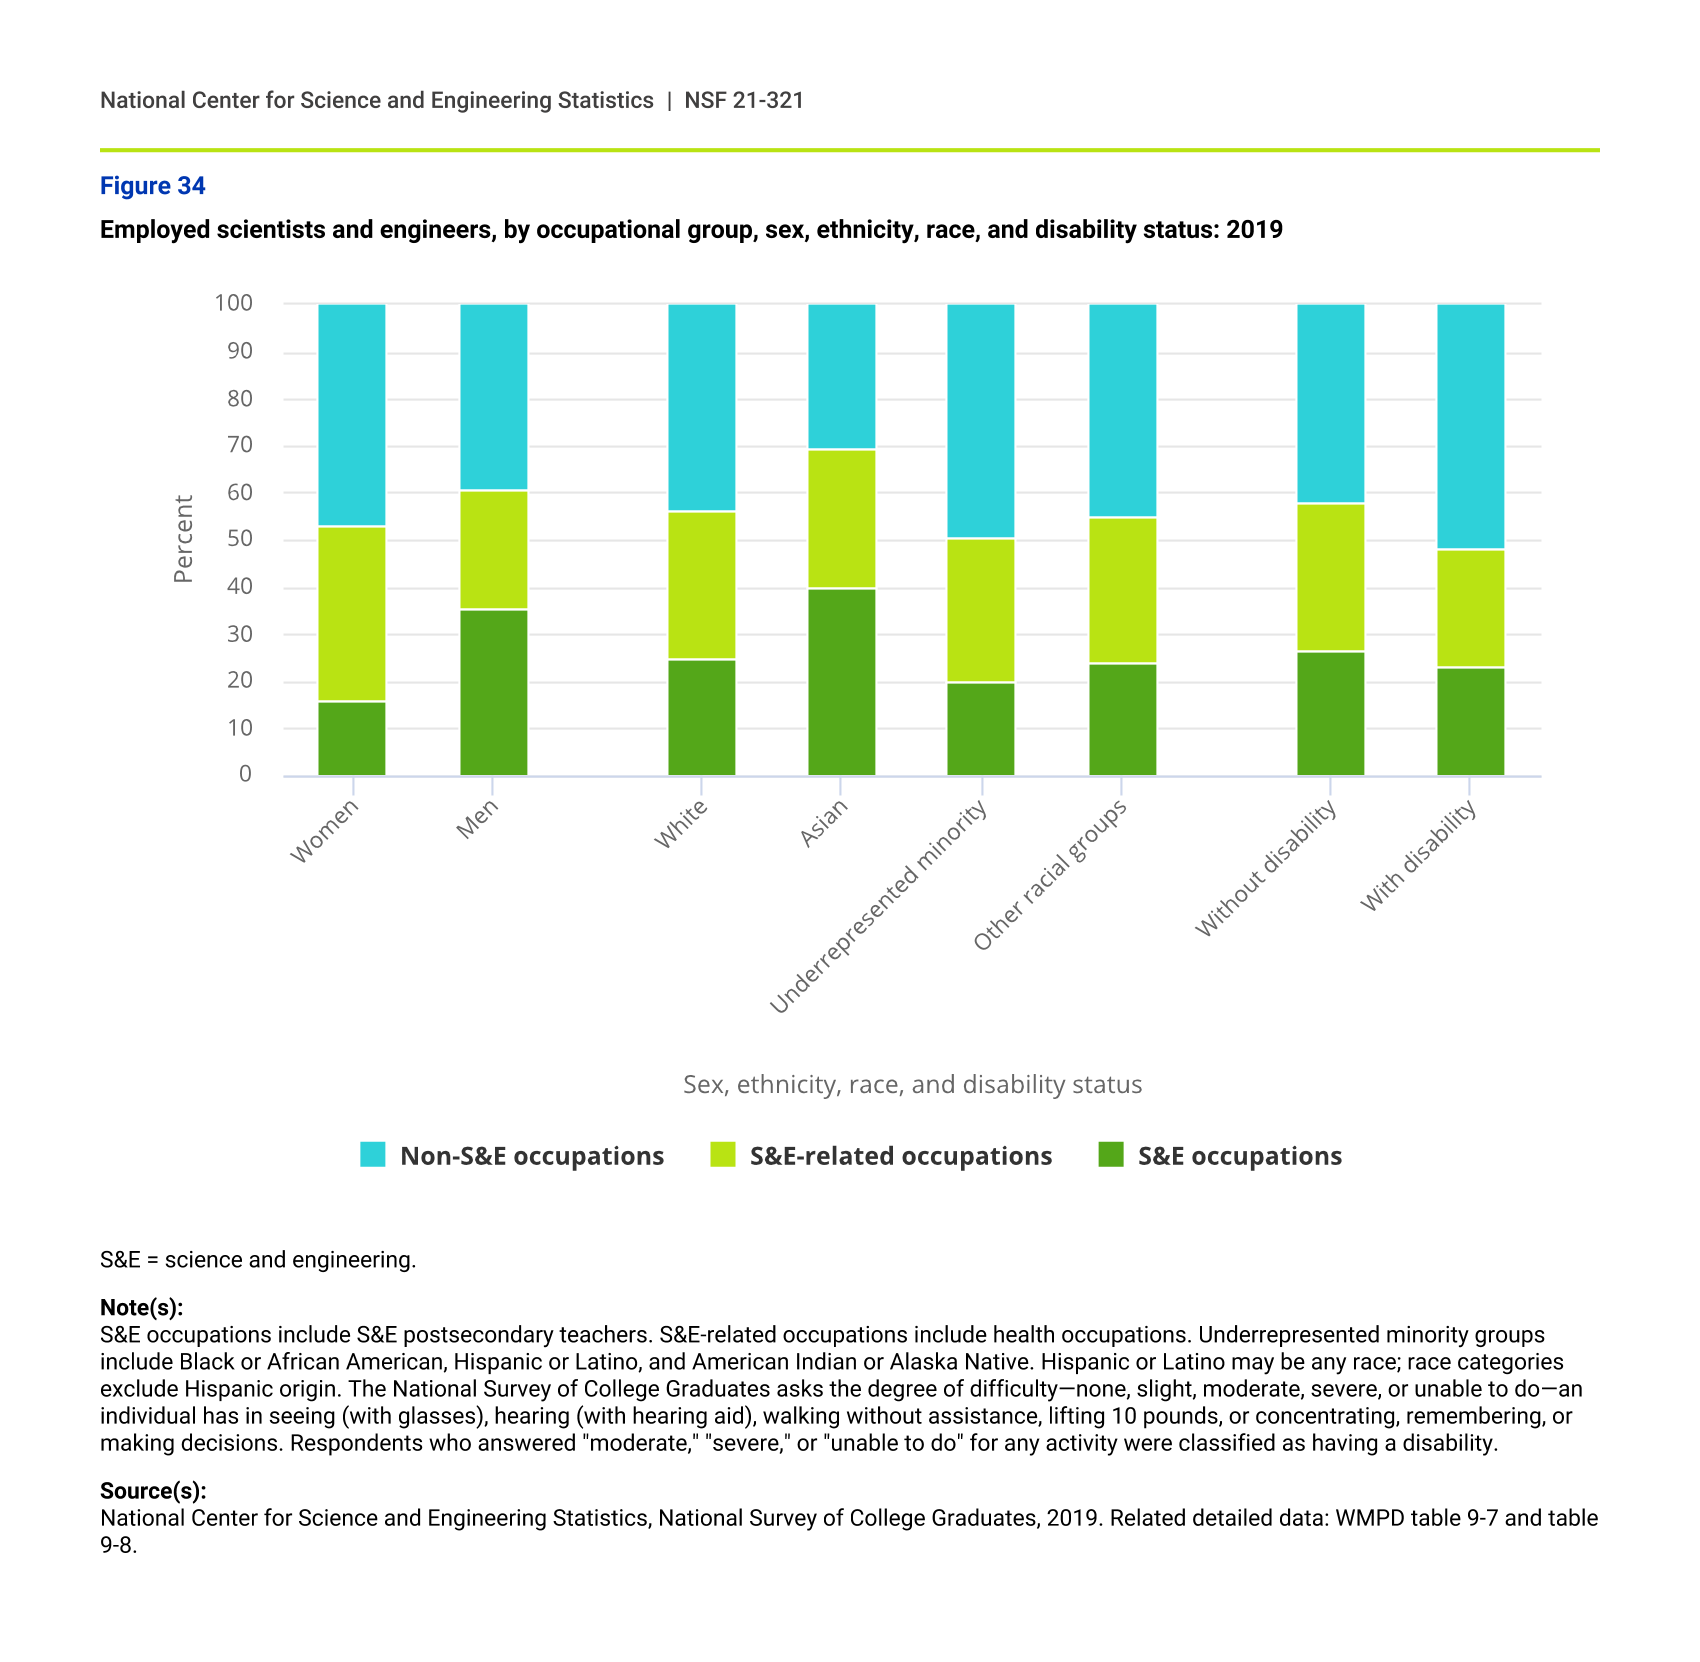
Among scientists and engineers, a larger share of men than women worked in S&E occupations in 2019. However, a larger share of female than male scientists and engineers worked in S&E-related occupations, which include health occupations, and in non-S&E-occupations.
Underrepresented minorities—Hispanics or Latinos, Blacks or African Americans, and American Indians or Alaska Natives—had a lower share of employed workers in S&E occupations than did Whites, Asians, and other racial groups. In contrast, their share of employed workers in S&E-related occupations was similar to that of the other groups. Scientists and engineers with disability had a lower share of employed workers in S&E or S&E-related occupations than did those without disability and a larger share in non-S&E occupations (figure 34).
Employed scientists and engineers, by occupational group, sex, ethnicity, race, and disability status: 2019
| Sex, ethnicity, race, and disability status | S&E occupations | S&E-related occupations | Non-S&E occupations |
|---|---|---|---|
| Women | 15.98 | 37.23 | 46.79 |
| Men | 35.38 | 25.39 | 39.23 |
| White | 24.88 | 31.48 | 43.63 |
| Asian | 39.88 | 29.74 | 30.38 |
| Underrepresented minority | 20.10 | 30.46 | 49.44 |
| Other racial groups | 23.86 | 31.12 | 45.02 |
| Without disability | 26.44 | 31.71 | 41.85 |
| With disability | 22.93 | 25.45 | 51.62 |
S&E = science and engineering.
Note(s):
S&E occupations include S&E postsecondary teachers. S&E-related occupations include health occupations. Underrepresented minority groups include Black or African American, Hispanic or Latino, and American Indian or Alaska Native. Hispanic or Latino may be any race; race categories exclude Hispanic origin. The National Survey of College Graduates asks the degree of difficulty—none, slight, moderate, severe, or unable to do—an individual has in seeing (with glasses), hearing (with hearing aid), walking without assistance, lifting 10 pounds, or concentrating, remembering, or making decisions. Respondents who answered "moderate," "severe," or "unable to do" for any activity were classified as having a disability.
Median salary
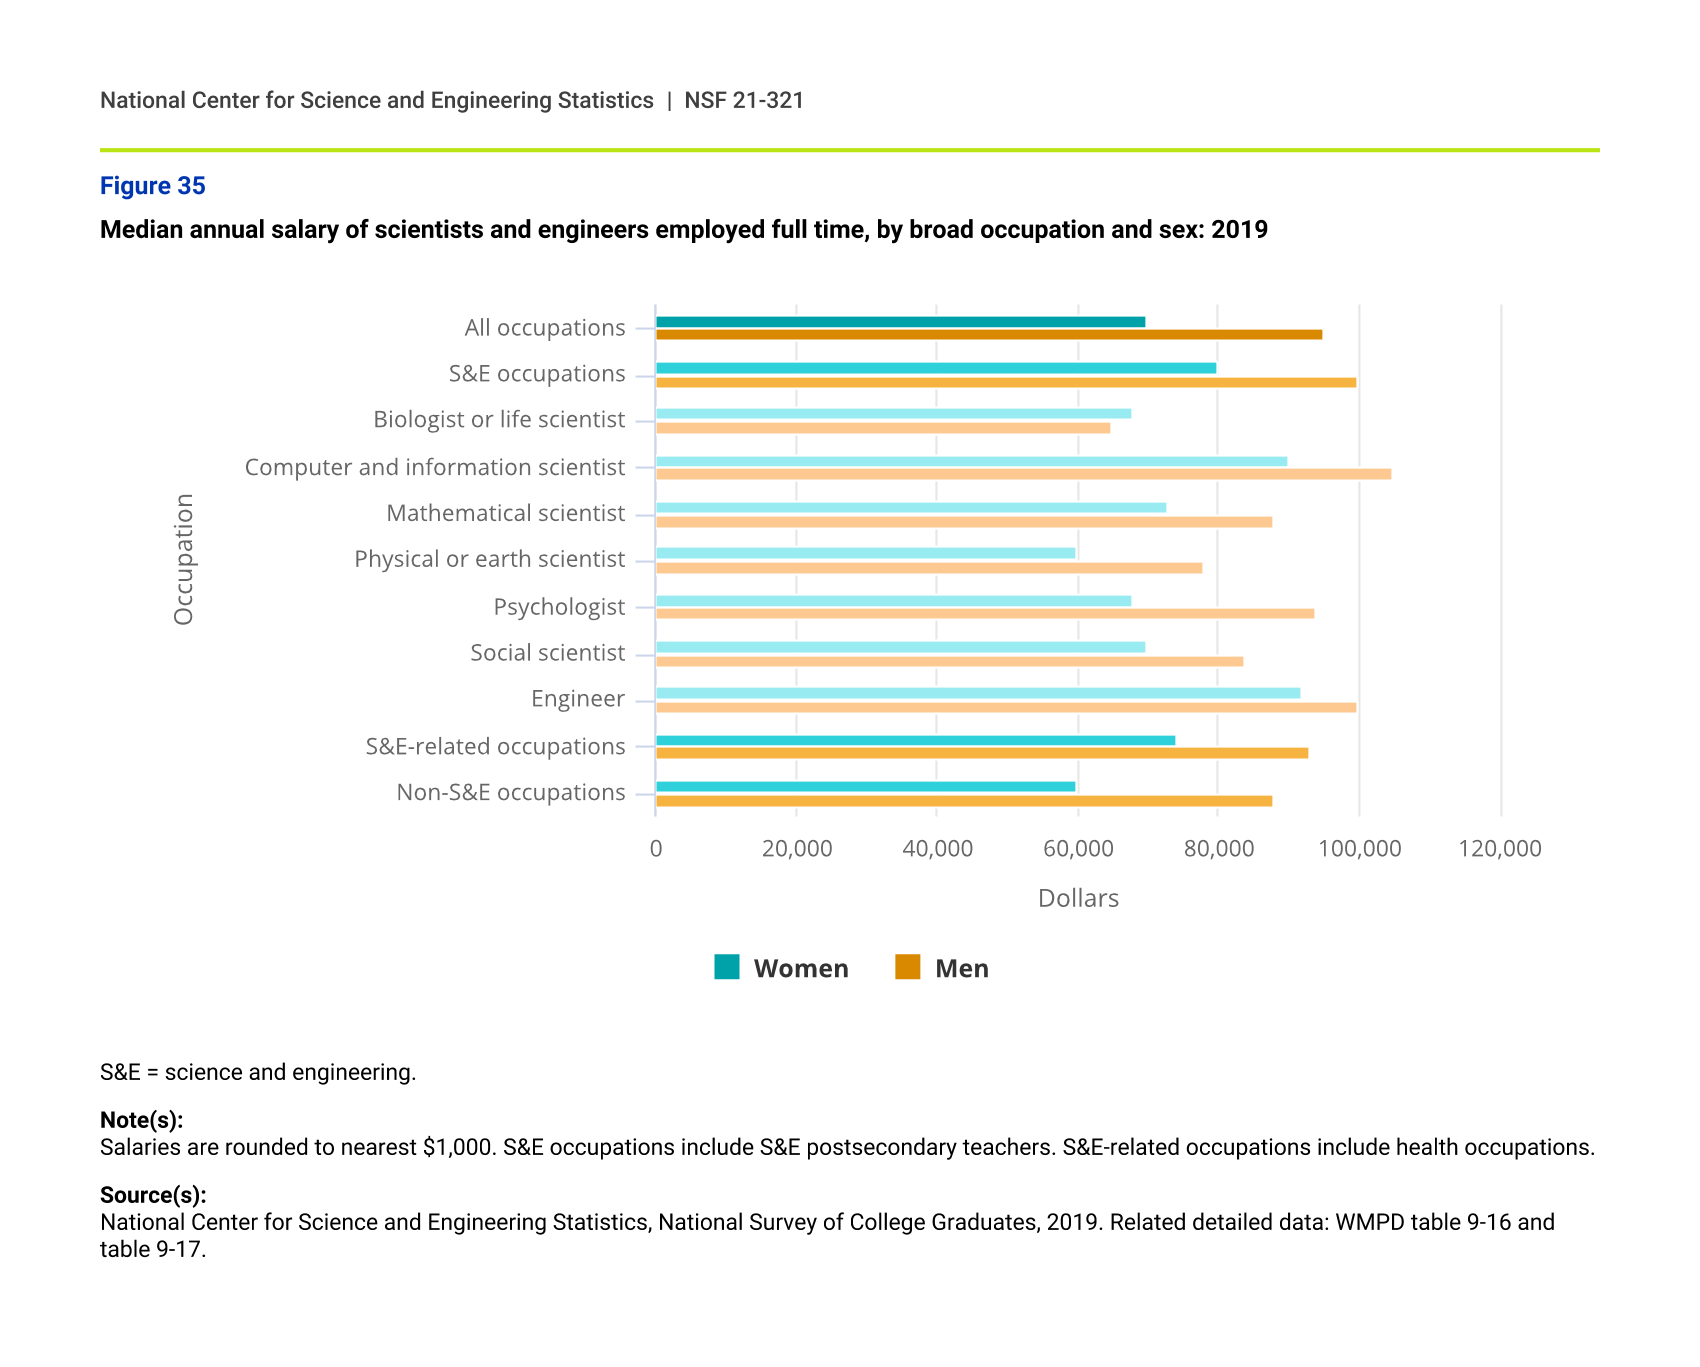
Salary level can be a useful indicator of the benefits of a degree. Median salaries for scientists and engineers vary across many factors, including sex, race and ethnicity, highest degree, field of degree, employment sector, and experience. Some of these factors are not captured in the analysis presented here. However, looking at salary differences can point to possible topics of further research.
Women and men
Among scientists and engineers working full time in 2019, women had lower annual salaries than did men in most broad occupational groups. Overall, women’s median annual salary was $70,000, whereas the median salary for men was $95,000. Even for those employed in the relatively high-paying computer and information scientist occupations, women’s median salary was considerably lower than that of their male counterparts. In addition, female psychologists’ median salary was less than that of male psychologists, even though a majority of the field is female. However, for biological and life science occupations, the median salaries for women and for men were similar (figure 35).
Median annual salary of scientists and engineers employed full time, by broad occupation and sex: 2019
| Occupation | Women | Men |
|---|---|---|
| All occupations | 70,000 | 95,000 |
| S&E occupations | 80,000 | 100,000 |
| Biologist or life scientist | 68,000 | 65,000 |
| Computer and information scientist | 90,000 | 105,000 |
| Mathematical scientist | 73,000 | 88,000 |
| Physical or earth scientist | 60,000 | 78,000 |
| Psychologist | 68,000 | 94,000 |
| Social scientist | 70,000 | 84,000 |
| Engineer | 92,000 | 100,000 |
| S&E-related occupations | 74,000 | 93,000 |
| Non-S&E occupations | 60,000 | 88,000 |
S&E = science and engineering.
Note(s):
Salaries are rounded to nearest $1,000. S&E occupations include S&E postsecondary teachers. S&E-related occupations include health occupations.
Source(s):
National Center for Science and Engineering Statistics, National Survey of College Graduates, 2019. Related detailed data: WMPD table 9-16 and table 9-17.
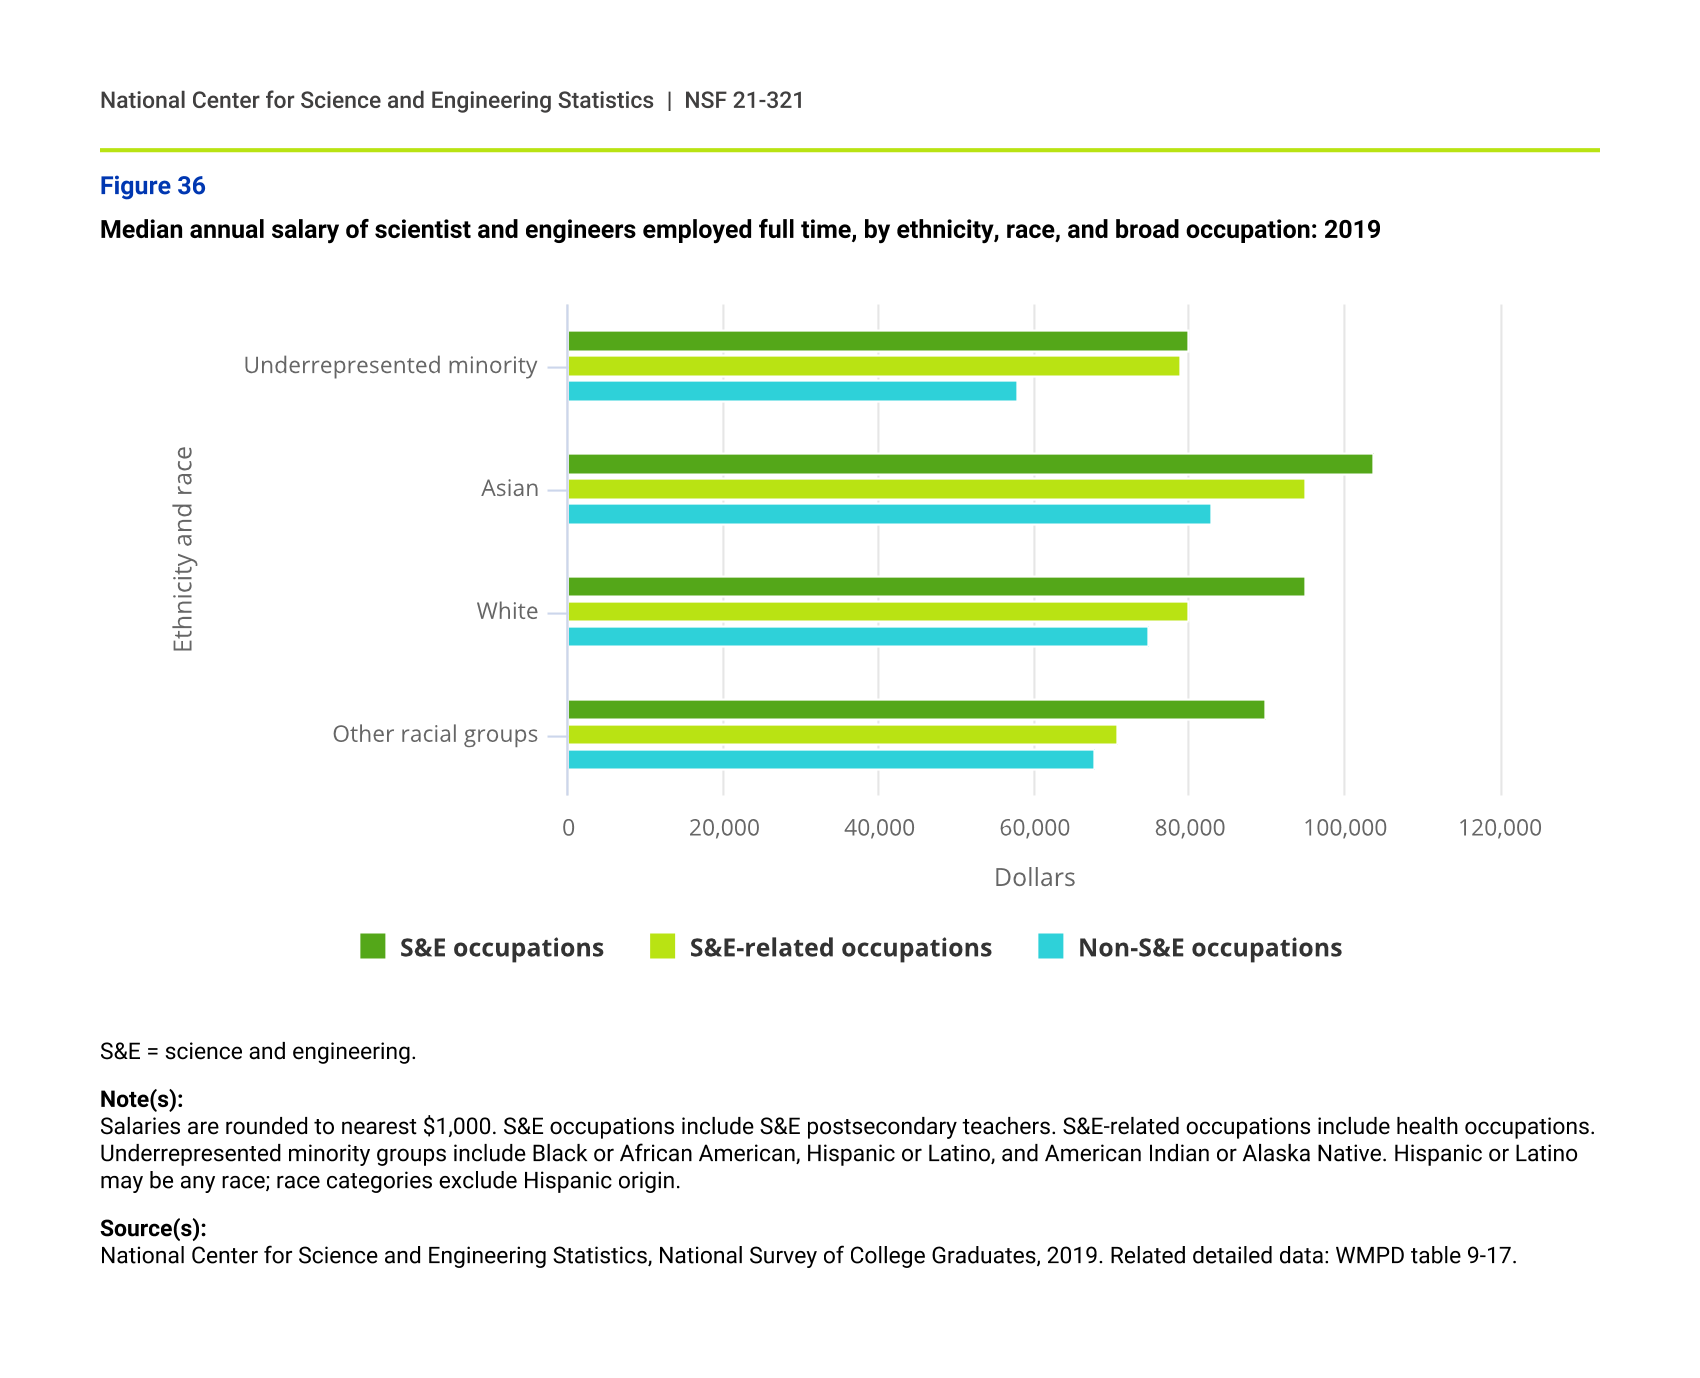
Race and ethnicity
Salaries of scientists and engineers vary considerably across racial and ethnic groups and also across occupations. Asian scientists and engineers had the highest median salary in S&E occupations ($104,000), whereas Whites ($95,000) and other racial groups ($90,000) had similar median salaries and underrepresented minorities had the lowest median salary ($80,000). A factor in lower median salaries in S&E occupations for underrepresented minorities may be that Hispanics or Latinos and Black or African Americans have large shares of degrees in psychology, social sciences, and biological and agricultural sciences, which all have lower median salaries than do occupations in computer or information science or in engineering, both of which had higher representation of Asians (figure 36).
Median annual salary of scientist and engineers employed full time, by ethnicity, race, and broad occupation: 2019
| Ethnicity and race | S&E occupations | S&E-related occupations | Non-S&E occupations |
|---|---|---|---|
| Underrepresented minority | 80,000 | 79,000 | 58,000 |
| Asian | 104,000 | 95,000 | 83,000 |
| White | 95,000 | 80,000 | 75,000 |
| Other racial groups | 90,000 | 71,000 | 68,000 |
S&E = science and engineering.
Note(s):
Salaries are rounded to nearest $1,000. S&E occupations include S&E postsecondary teachers. S&E-related occupations include health occupations. Underrepresented minority groups include Black or African American, Hispanic or Latino, and American Indian or Alaska Native. Hispanic or Latino may be any race; race categories exclude Hispanic origin.
Source(s):
National Center for Science and Engineering Statistics, National Survey of College Graduates, 2019. Related detailed data: WMPD table 9-17.
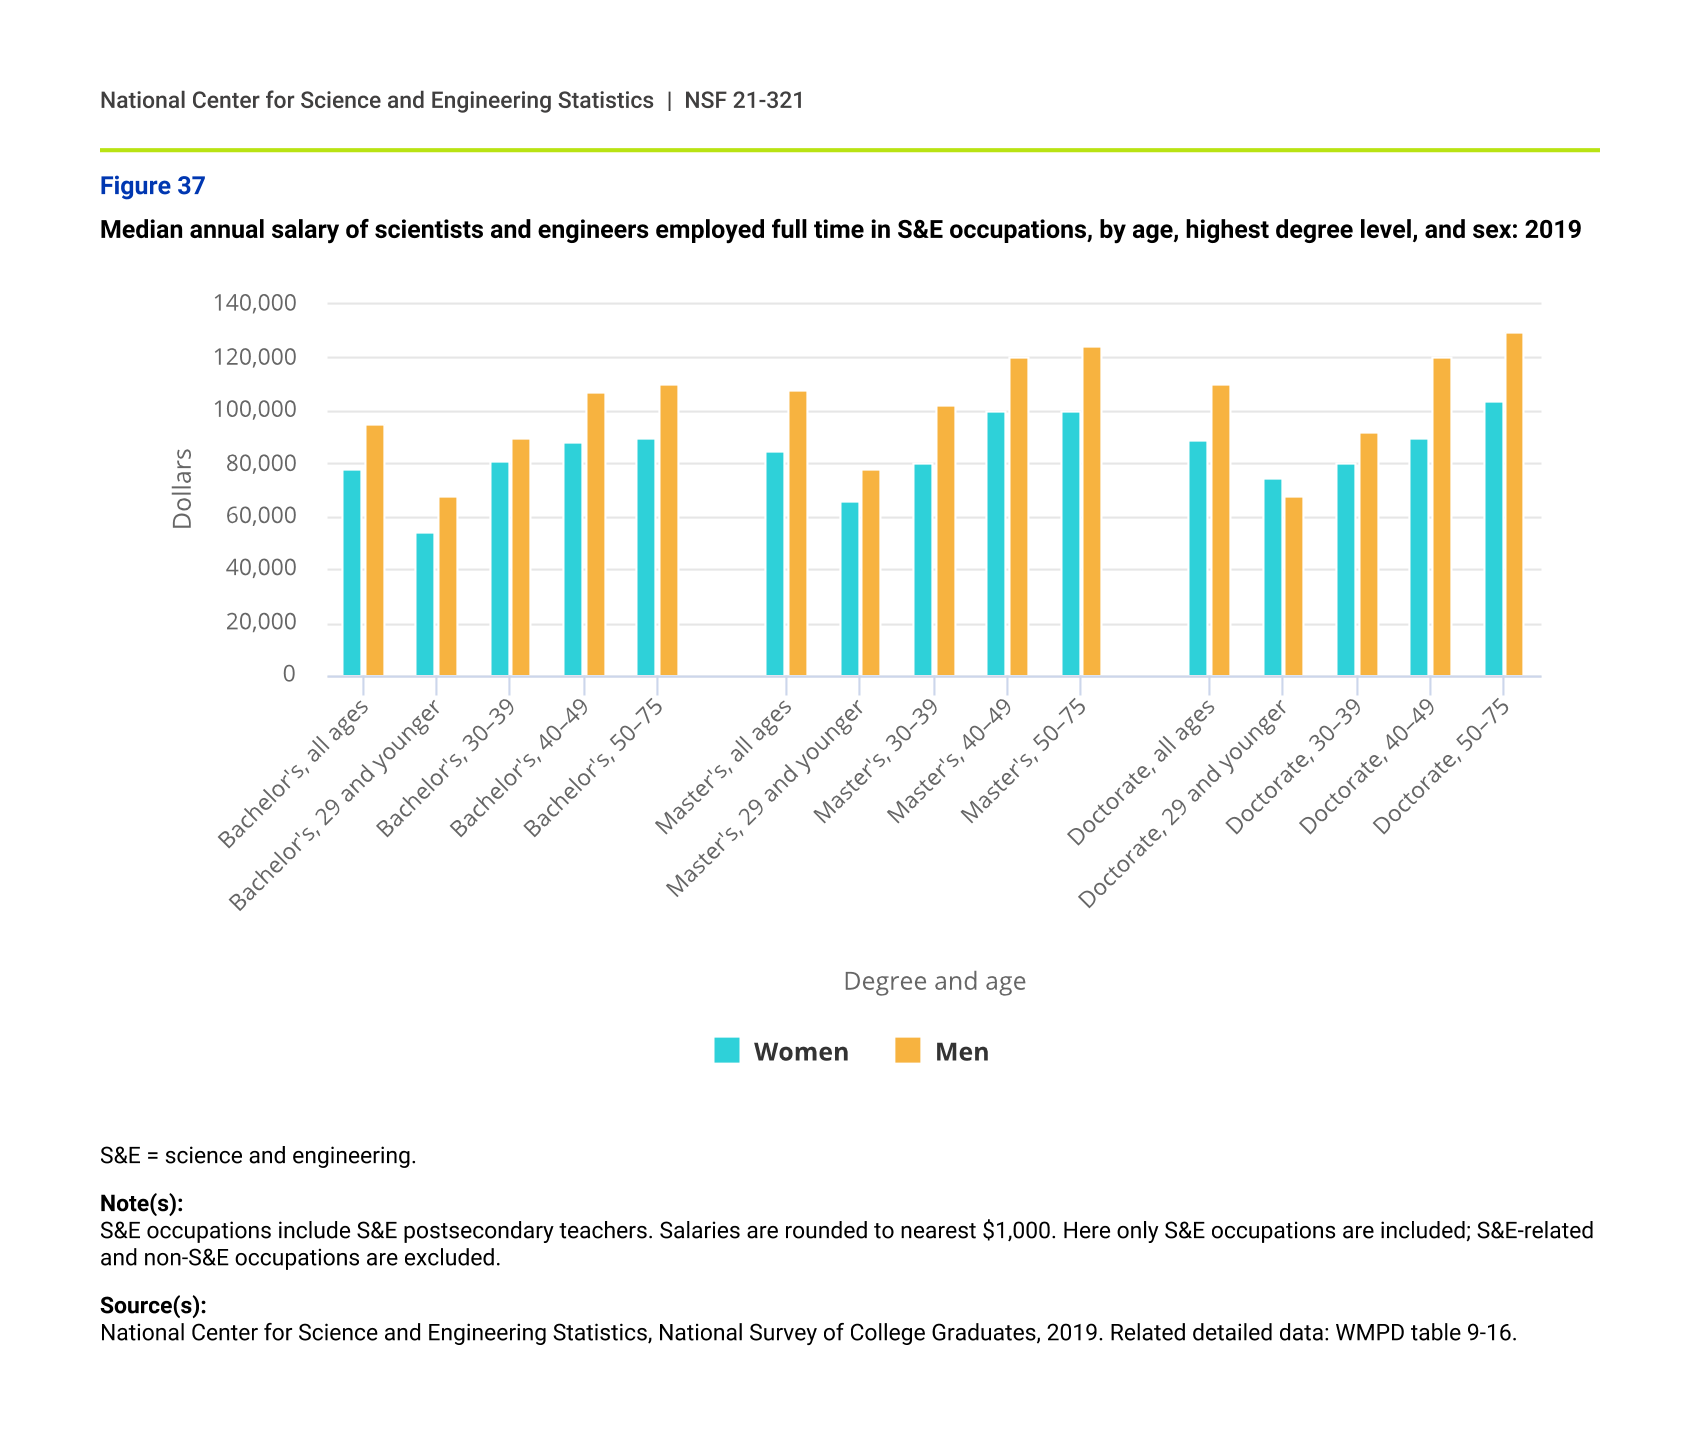
Age groups
Looking at scientists and engineers working full time in S&E occupations in 2019, median salaries generally increased with degree level and with age, and men generally had higher median salaries than women. However, there are some differences. For those with bachelor’s degrees, men had a higher median salary than did women for all age groups except for ages 30–39 where the median salaries were similar. For those with master’s degrees, men had higher median salaries at all age groups. For those with doctorate degrees, men’s median salaries were greater for those ages 40–49 and those ages 50–75; for those age groups under age 40, the median salaries were similar (figure 37). Research is needed to determine whether this difference in salary between men and women is due to the different environment the older cohorts faced with possibly more equal conditions for younger cohorts, whether women’s career paths for the younger cohorts will still result in salary differentials when they attain more tenure in their careers, or whether other factors cause or contribute to the salary differential.
Median annual salary of scientists and engineers employed full time in S&E occupations, by age, highest degree level, and sex: 2019
| Degree and age | Women | Men |
|---|---|---|
| Bachelor's, all ages | 78,000 | 95,000 |
| Bachelor's, 29 and younger | 54,000 | 68,000 |
| Bachelor's, 30–39 | 81,000 | 90,000 |
| Bachelor's, 40–49 | 88,000 | 107,000 |
| Bachelor's, 50–75 | 90,000 | 110,000 |
| Master's, all ages | 85,000 | 108,000 |
| Master's, 29 and younger | 66,000 | 78,000 |
| Master's, 30–39 | 80,000 | 102,000 |
| Master's, 40–49 | 100,000 | 120,000 |
| Master's, 50–75 | 100,000 | 124,000 |
| Doctorate, all ages | 89,000 | 110,000 |
| Doctorate, 29 and younger | 75,000 | 68,000 |
| Doctorate, 30–39 | 80,000 | 92,000 |
| Doctorate, 40–49 | 90,000 | 120,000 |
| Doctorate, 50–75 | 104,000 | 130,000 |
S&E = science and engineering.
Note(s):
S&E occupations include S&E postsecondary teachers. Salaries are rounded to nearest $1,000. Here only S&E occupations are included; S&E-related and non-S&E occupations are excluded.
Source(s):
National Center for Science and Engineering Statistics, National Survey of College Graduates, 2019. Related detailed data: WMPD table 9-16.
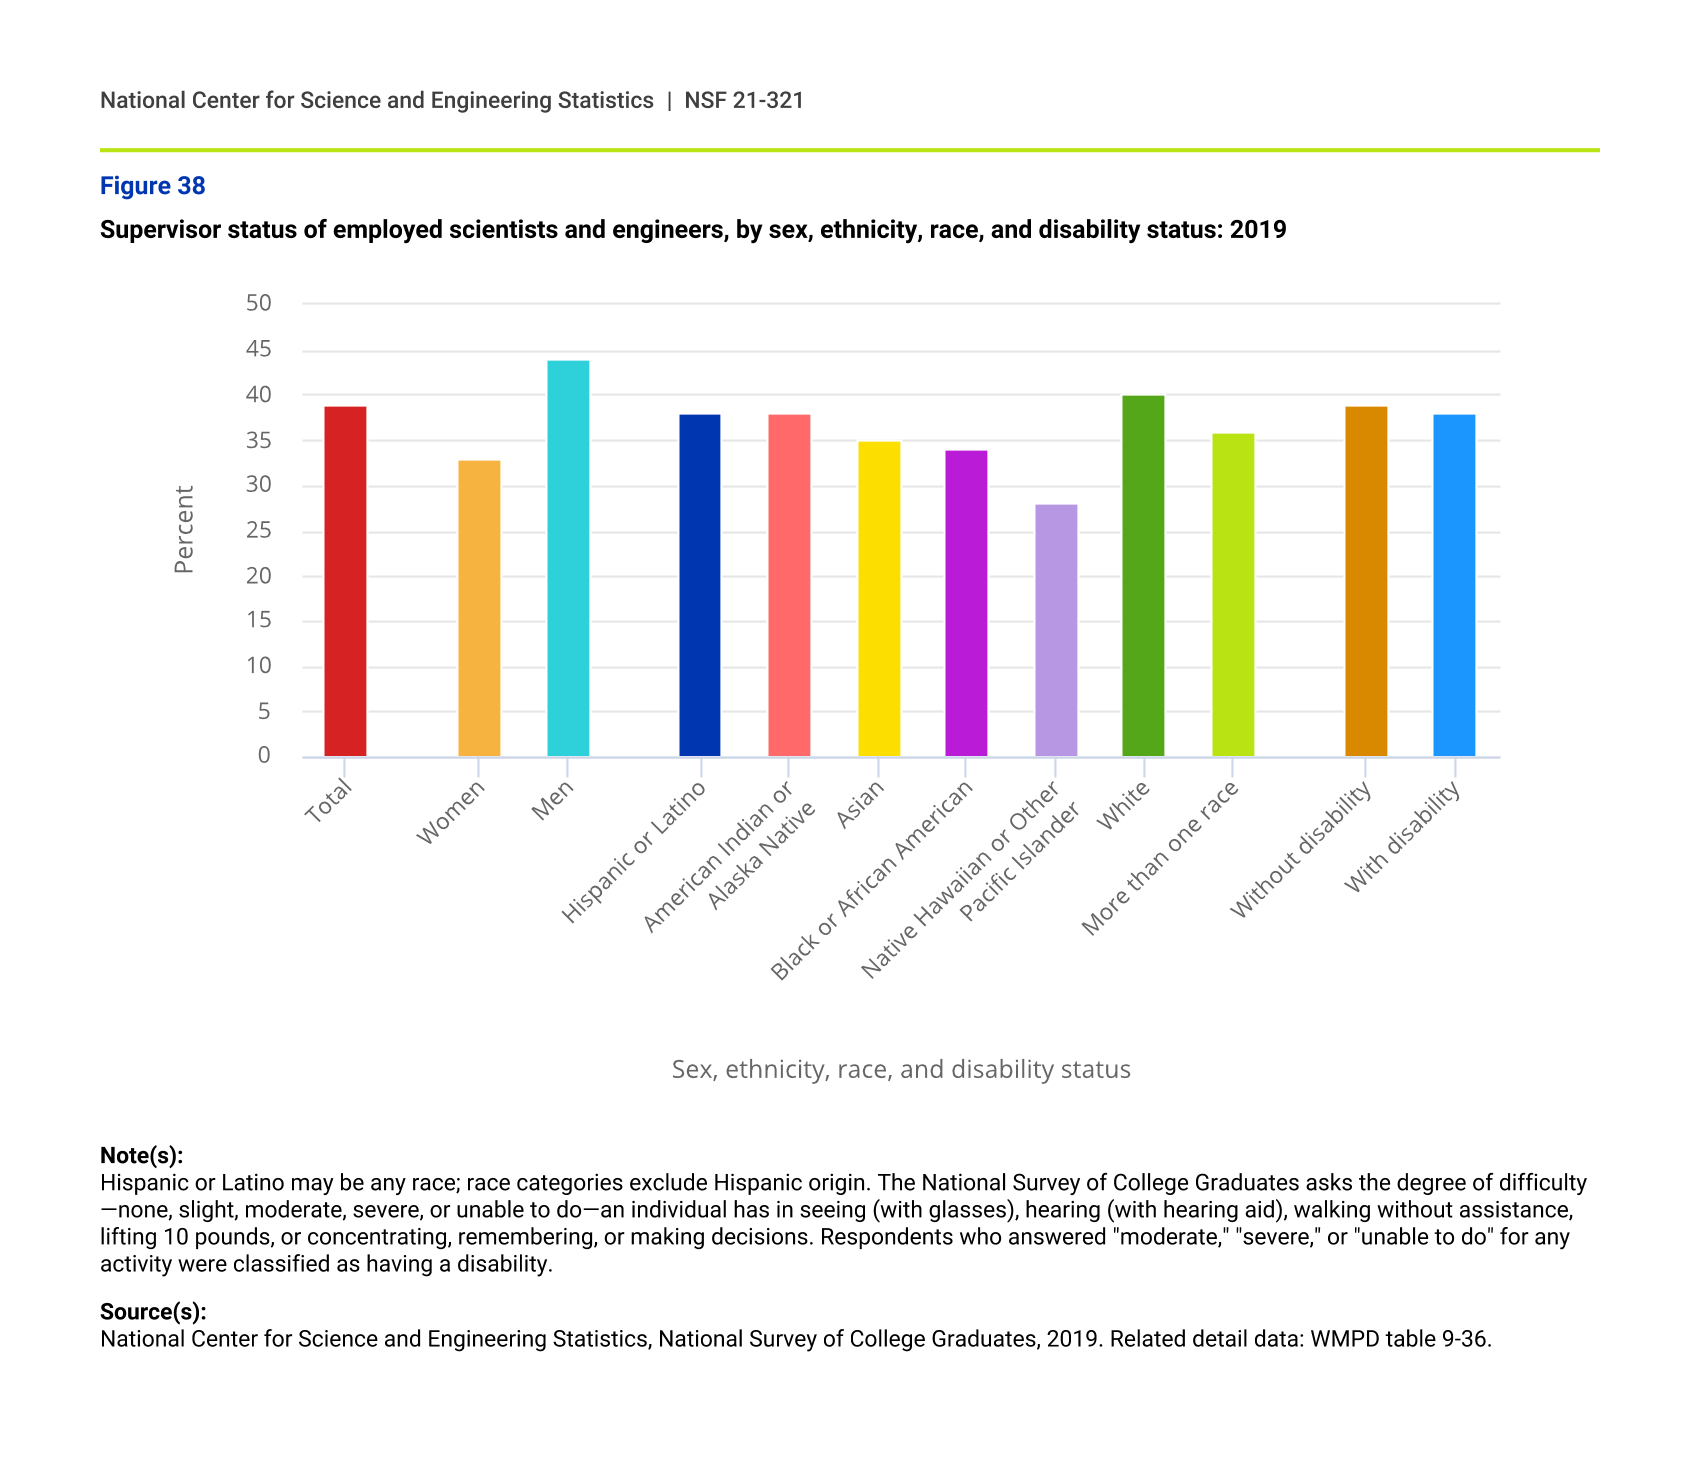
Supervisory status
One characteristic of a career that factors into salary is whether a scientist or engineer holds a supervisory role in their occupation. The share of scientists and engineers who are supervisors in their jobs, regardless of occupational group, differs for various groups. Men reported holding a supervisory role more frequently than did women (44.4% versus 32.7%), and scientists and engineers who are White reported holding a supervisory role more frequently than did other races and ethnicities. However, those with disabilities and those without disabilities have similar shares of scientists and engineers who are supervisors (figure 38).
Supervisor status of employed scientists and engineers, by sex, ethnicity, race, and disability status: 2019
| Sex, ethnicity, race, and disability status | Supervisor status |
|---|---|
| Total | 39 |
| Women | 33 |
| Men | 44 |
| Hispanic or Latino | 38 |
| American Indian or Alaska Native | 38 |
| Asian | 35 |
| Black or African American | 34 |
| Native Hawaiian or Other Pacific Islander | 28 |
| White | 40 |
| More than one race | 36 |
| Without disability | 39 |
| With disability | 38 |
Note(s):
Hispanic or Latino may be any race; race categories exclude Hispanic origin. The National Survey of College Graduates asks the degree of difficulty—none, slight, moderate, severe, or unable to do—an individual has in seeing (with glasses), hearing (with hearing aid), walking without assistance, lifting 10 pounds, or concentrating, remembering, or making decisions. Respondents who answered "moderate," "severe," or "unable to do" for any activity were classified as having a disability.
Source(s):
National Center for Science and Engineering Statistics, National Survey of College Graduates, 2019. Related detail data: WMPD table 9-36.
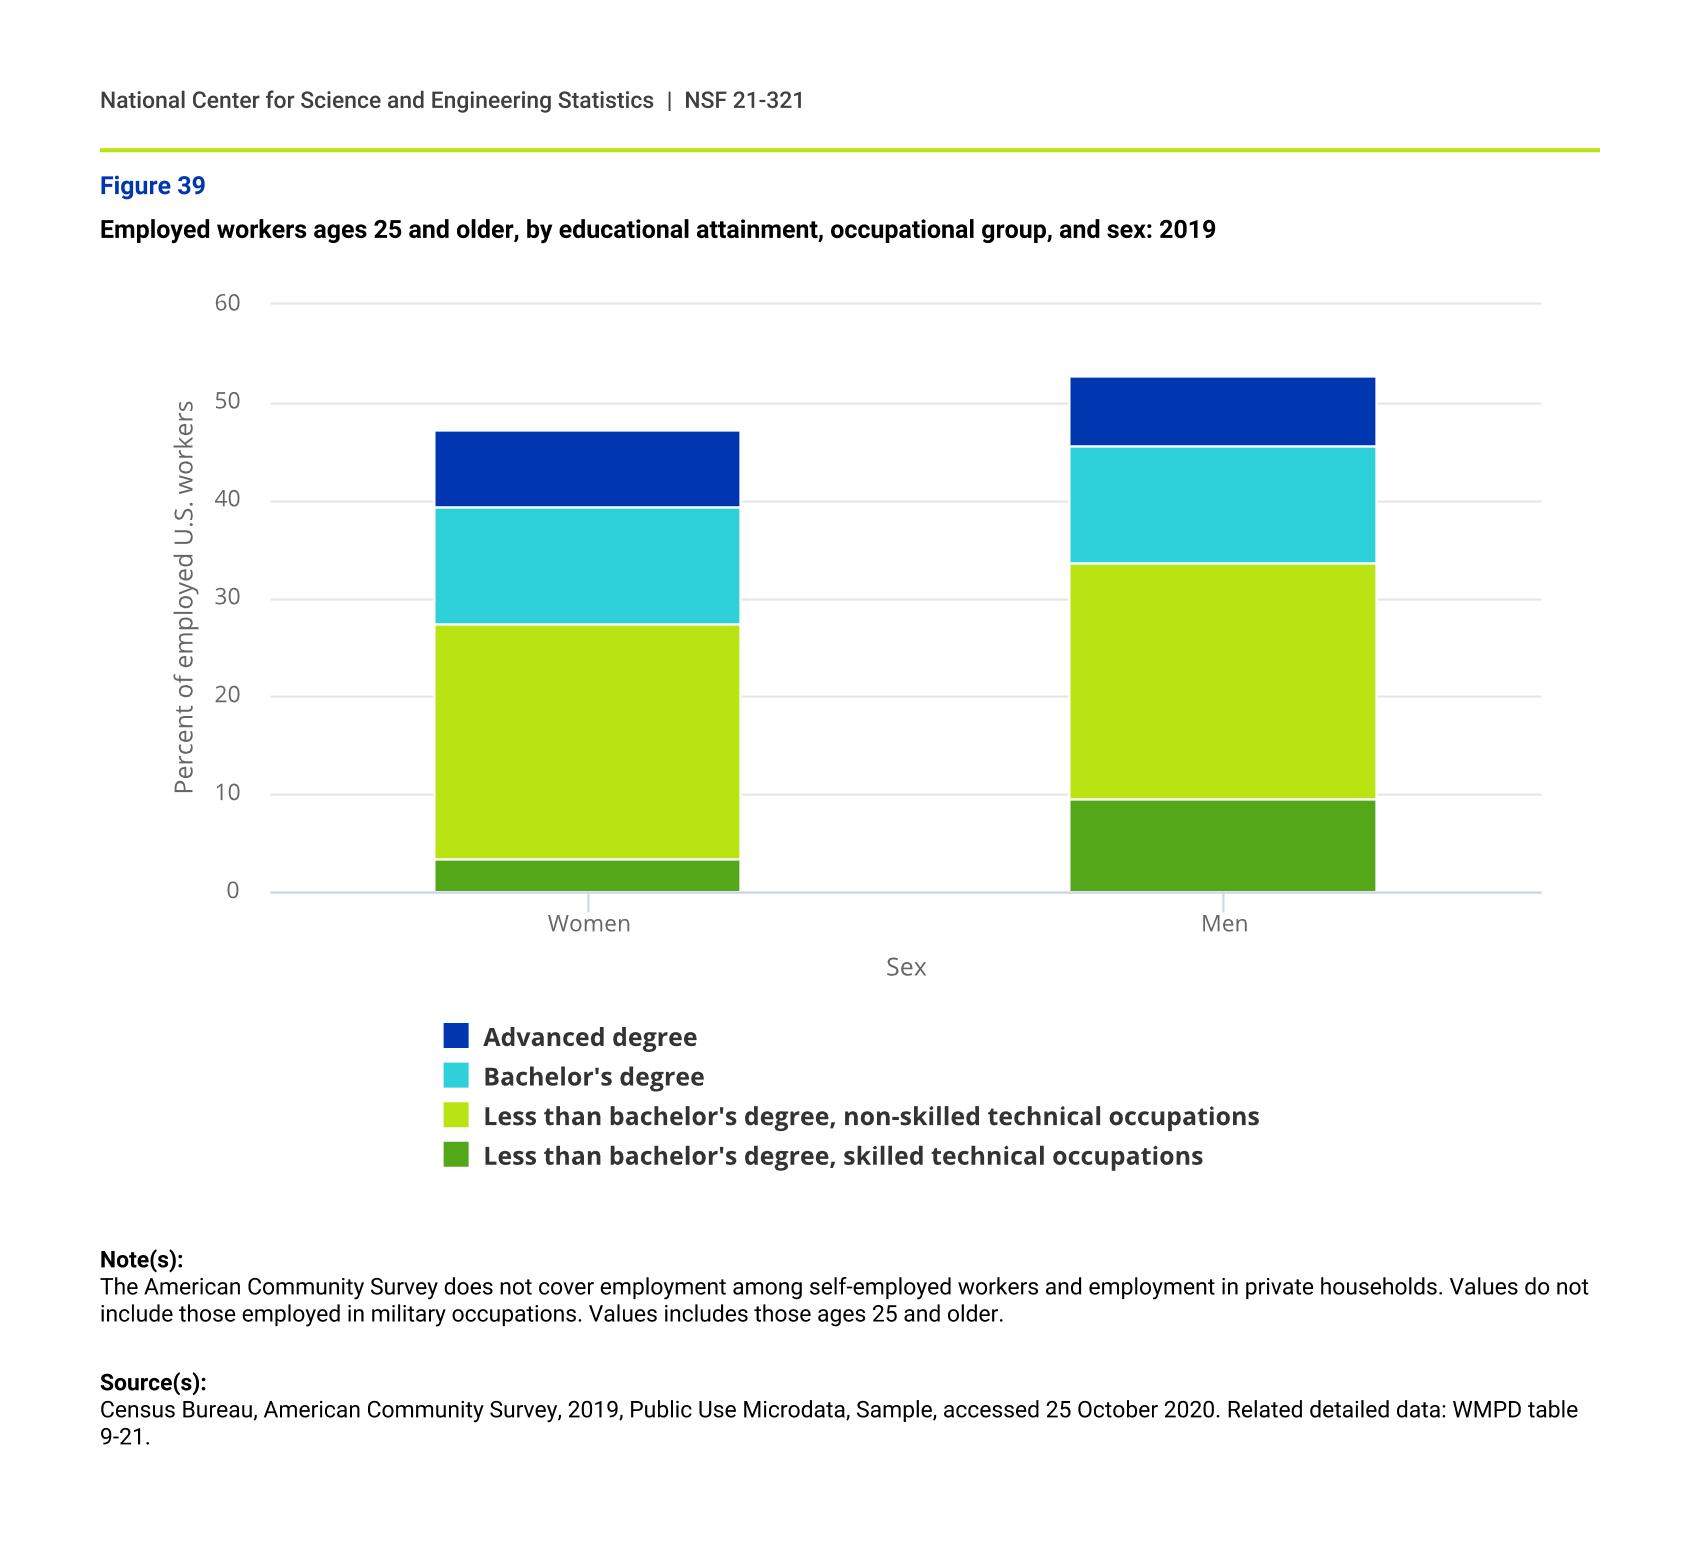
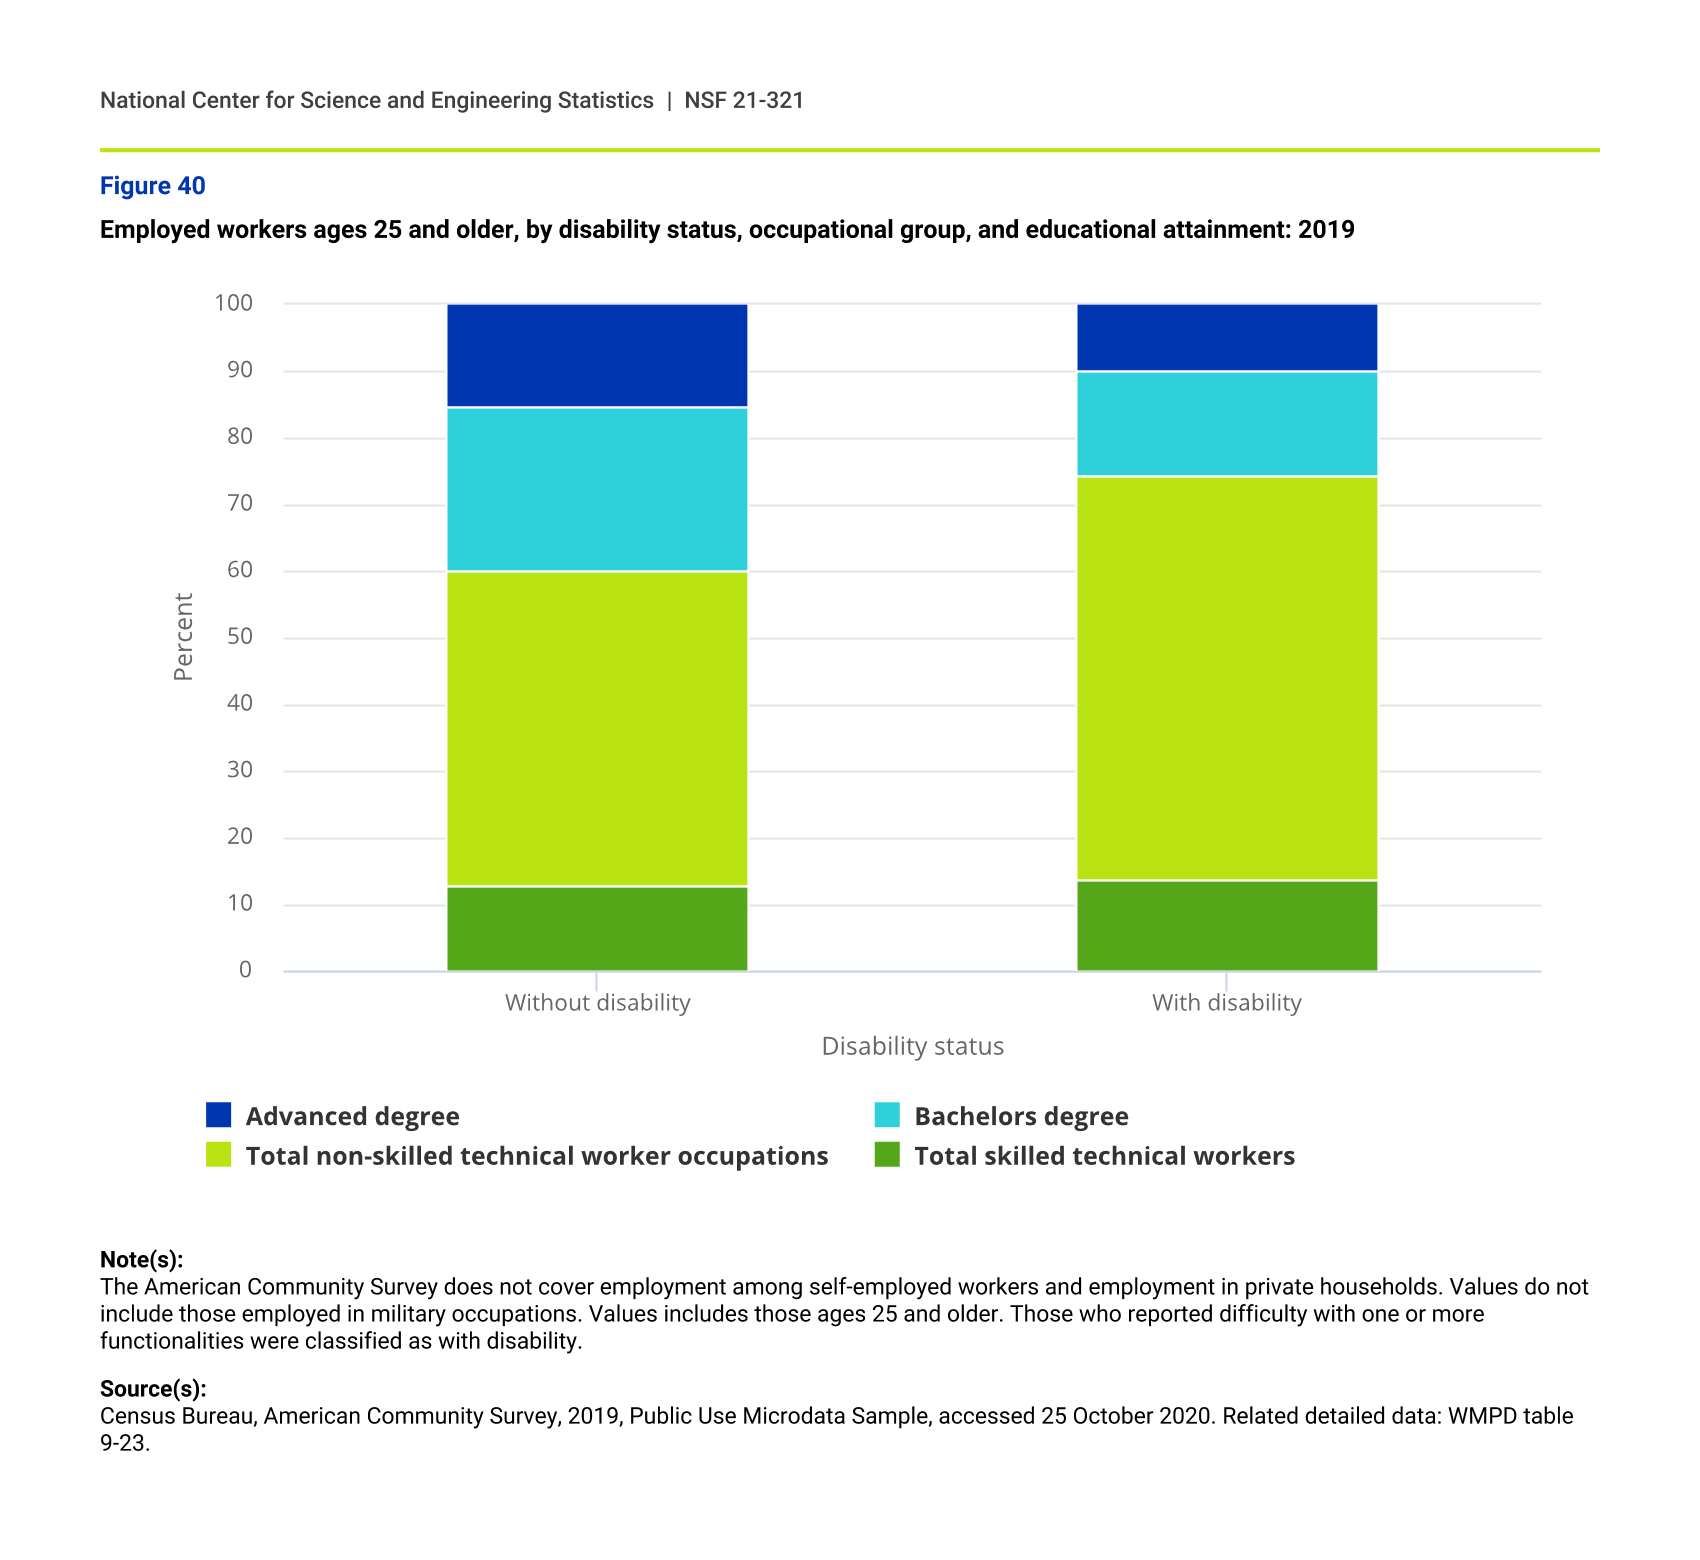
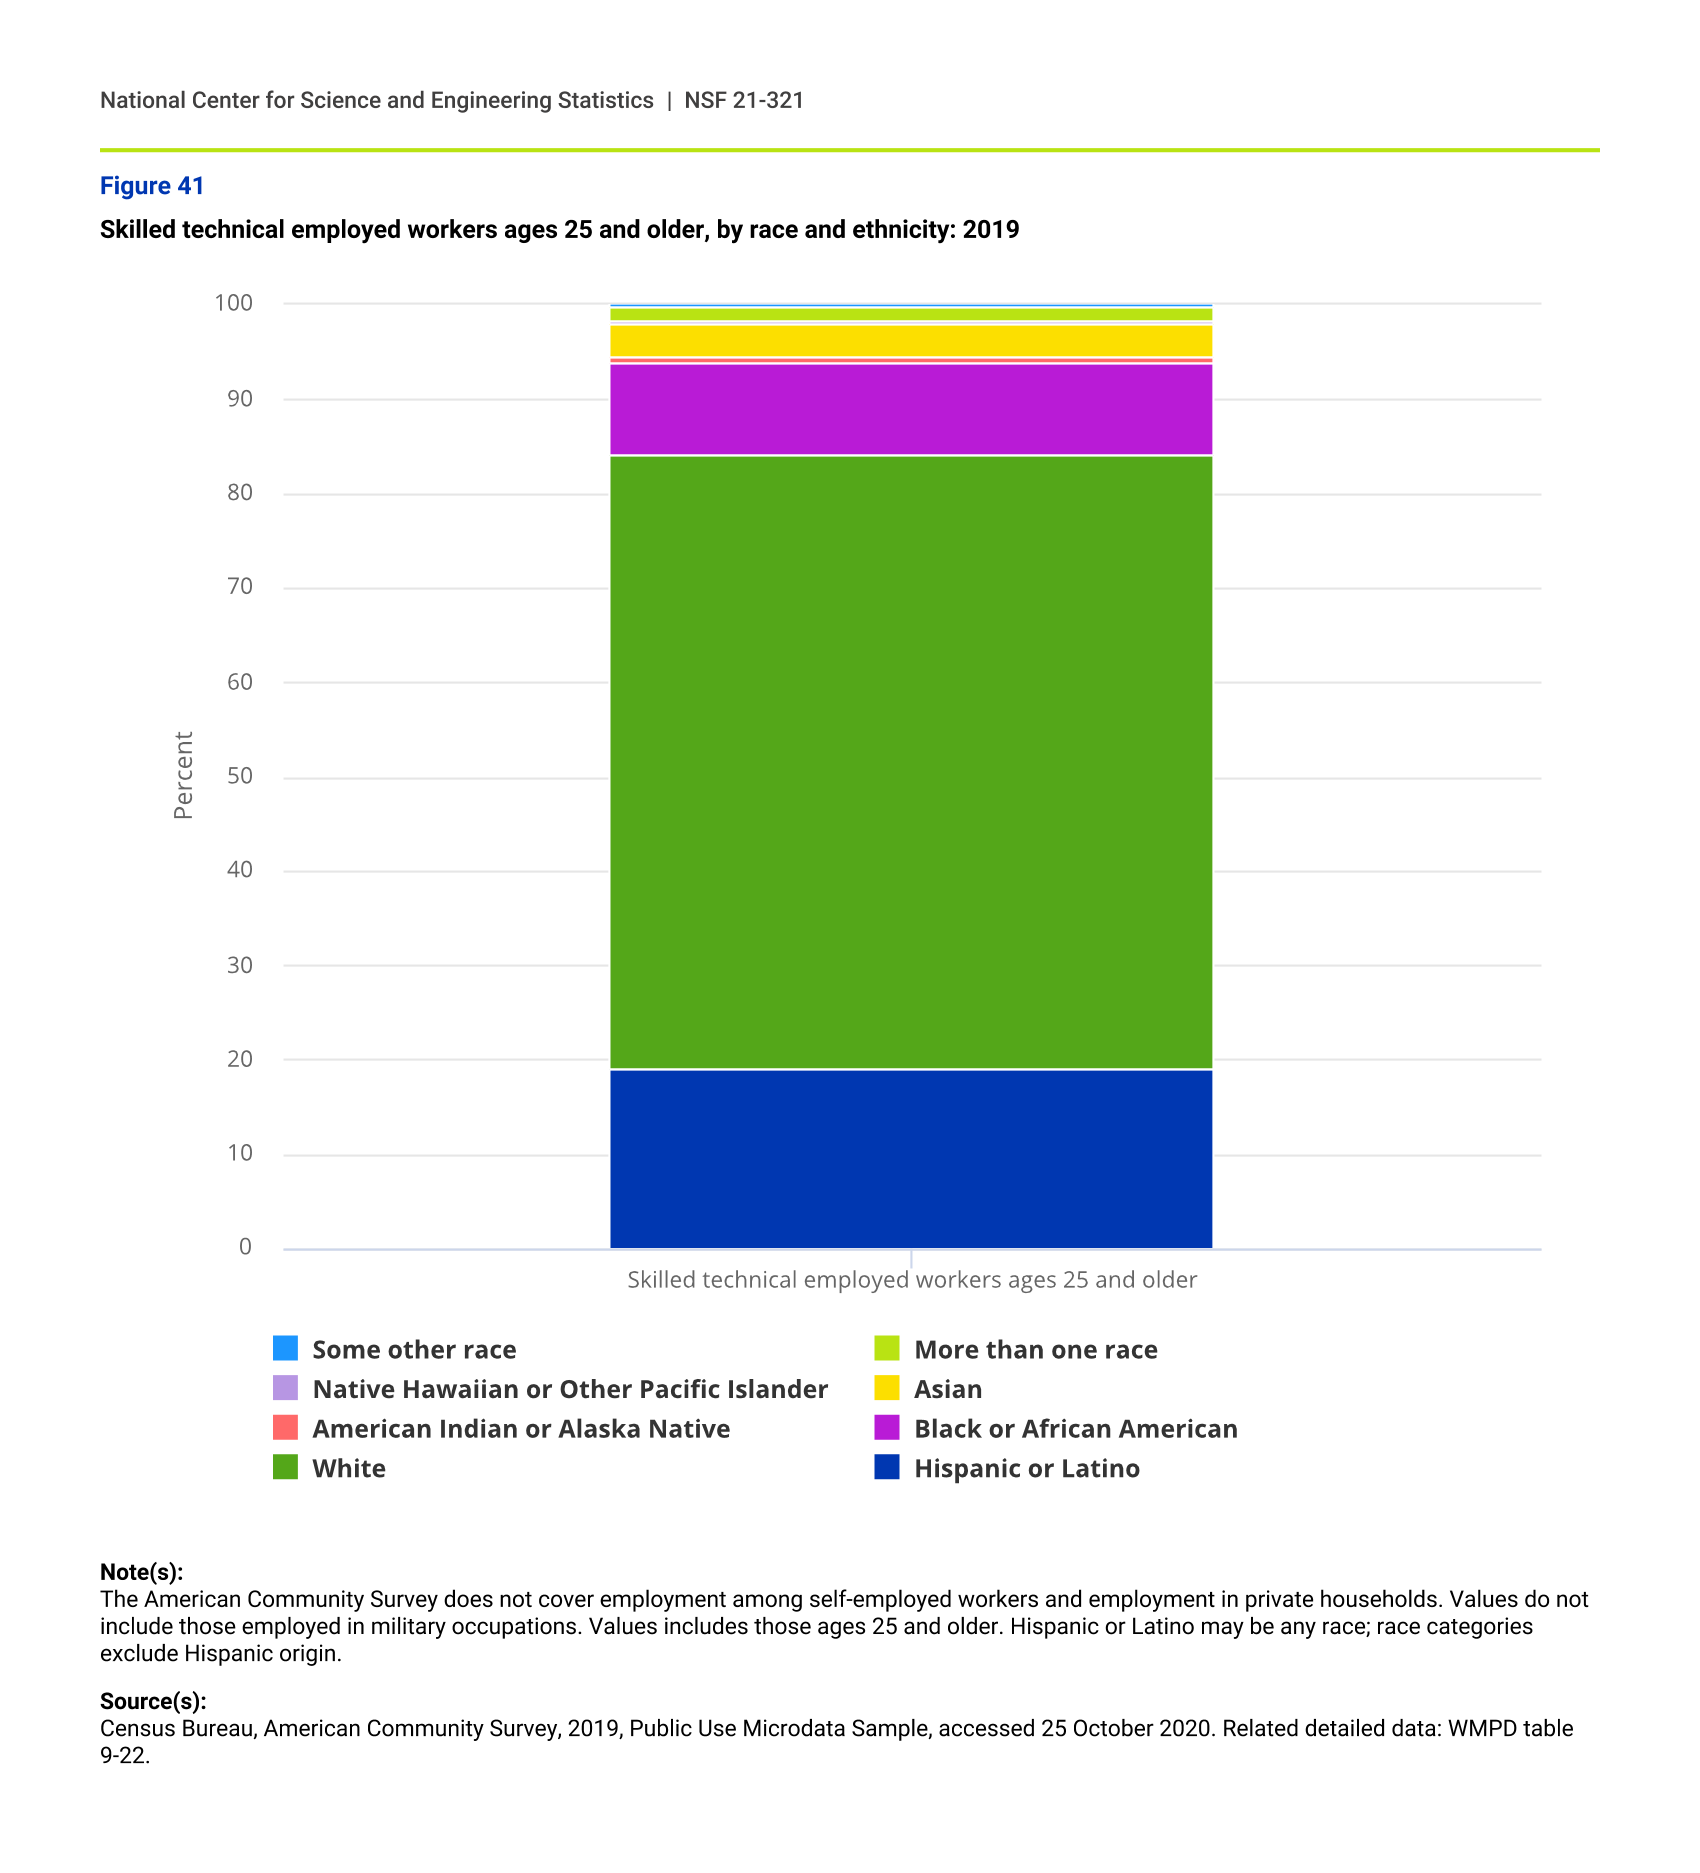
Skilled technical workforce
An emerging area of interest is highly skilled workers in STEM (science, technology, engineering, and mathematics) occupations that do not require a bachelor’s degree or above—the skilled technical workforce (STW). The STW includes those in occupations such as construction and extraction; installation, maintenance, and repair; health care; production; and computer and mathematics. A better understanding of skilled technical workers is needed for policymakers and others in order to build a STEM-capable workforce.
In 2019, the STW numbered about 18 million workers. Women made up about a quarter of the STW, which was 3.4% of those employed in the United States in 2019 (figure 39). Skilled technical workers with disability made up 6.7% of the STW, and 13.9% of all workers with disability were employed in skilled technical jobs (figure 40). Looking within the STW by racial and ethnic groups, Hispanics or Latinos have a similar share (19.0%) of the STW as their share of the working-age population (18.5%). Although Blacks or African Americans make up the third largest share of the STW (9.8%), their representation still lags behind their share of the working-age population (13.0%) (figure 41).
Employed workers ages 25 and older, by educational attainment, occupational group, and sex: 2019
| Sex | Less than bachelor's degree, skilled technical occupations | Less than bachelor's degree, non-skilled technical occupations | Bachelor's degree | Advanced degree |
|---|---|---|---|---|
| Women | 3.35 | 24.07 | 11.95 | 7.90 |
| Men | 9.61 | 23.93 | 12.01 | 7.18 |
Note(s):
The American Community Survey does not cover employment among self-employed workers and employment in private households. Values do not include those employed in military occupations. Values includes those ages 25 and older.
Source(s):
Census Bureau, American Community Survey, 2019, Public Use Microdata, Sample, accessed 25 October 2020. Related detailed data: WMPD table 9-21.
Employed workers ages 25 and older, by disability status, occupational group, and educational attainment: 2019
| Disability status | Total skilled technical workers | Total non-skilled technical worker occupations | Bachelors degree | Advanced degree |
|---|---|---|---|---|
| Without disability | 12.90 | 47.17 | 24.52 | 15.42 |
| With disability | 13.89 | 60.64 | 15.55 | 9.93 |
Note(s):
The American Community Survey does not cover employment among self-employed workers and employment in private households. Values do not include those employed in military occupations. Values includes those ages 25 and older. Those who reported difficulty with one or more functionalities were classified as with disability.
Source(s):
Census Bureau, American Community Survey, 2019, Public Use Microdata Sample, accessed 25 October 2020. Related detailed data: WMPD table 9-23.
Skilled technical employed workers ages 25 and older, by race and ethnicity: 2019
| Employment category | Hispanic or Latino | White | Black or African American | American Indian or Alaska Native | Asian | Native Hawaiian or Other Pacific Islander | More than one race | Some other race |
|---|---|---|---|---|---|---|---|---|
| Skilled technical employed workers ages 25 and older | 19.03 | 65.05 | 9.77 | 0.63 | 3.47 | 0.20 | 1.65 | 0.20 |
Note(s):
The American Community Survey does not cover employment among self-employed workers and employment in private households. Values do not include those employed in military occupations. Values includes those ages 25 and older. Hispanic or Latino may be any race; race categories exclude Hispanic origin.
Source(s):
Census Bureau, American Community Survey, 2019, Public Use Microdata Sample, accessed 25 October 2020. Related detailed data: WMPD table 9-22.