 An official website of the United States government
 Persons with disability
Persons with disability may face barriers to education and employment. Discrimination can include being treated less favorably or lack of reasonable accommodation in school or in the labor market. Of interest here is measuring the representation of persons with disability in science and engineering.
Overview
Scientists and engineers with disability who are in the early stage of their career are of special interest. Incidence of disability increases with age. For example, of all employed science, engineering, and health doctorate holders, 5.0% of those under age 40 have a disability, whereas 9.4% of those ages 40 and over have one. Older scientists and engineers experiencing aging-related disabilities, such as deterioration of sight or hearing, who are already employed, and perhaps already tenured, are less likely to face career barriers.
Summary of findings
Findings for persons with disability are reported throughout this report and are also included below.
- About 10% of women and about 9% of men who are scientists and engineers with at least a bachelor’s degree reported that they are not working due to chronic illness or disability (figure 30). In addition, scientists and engineers with disability have a higher unemployment rate than do those without disability and a higher unemployment rate than the overall U.S. unemployment rate in 2019 (figure 33).
- Among employed scientists and engineers with at least a bachelor’s degree, men had a higher disability rate than did women and underrepresented minorities had a higher rate than did Whites or Asians (figure 32).
- Among employed scientists and engineers with disability, a smaller share worked in science and engineering (S&E) or S&E-related occupations and a larger share worked in non-S&E occupations than those without disability (figure 34).
- The share of employed scientists and engineers with disability who had supervisory status was similar to that of those without disability (figure 38).
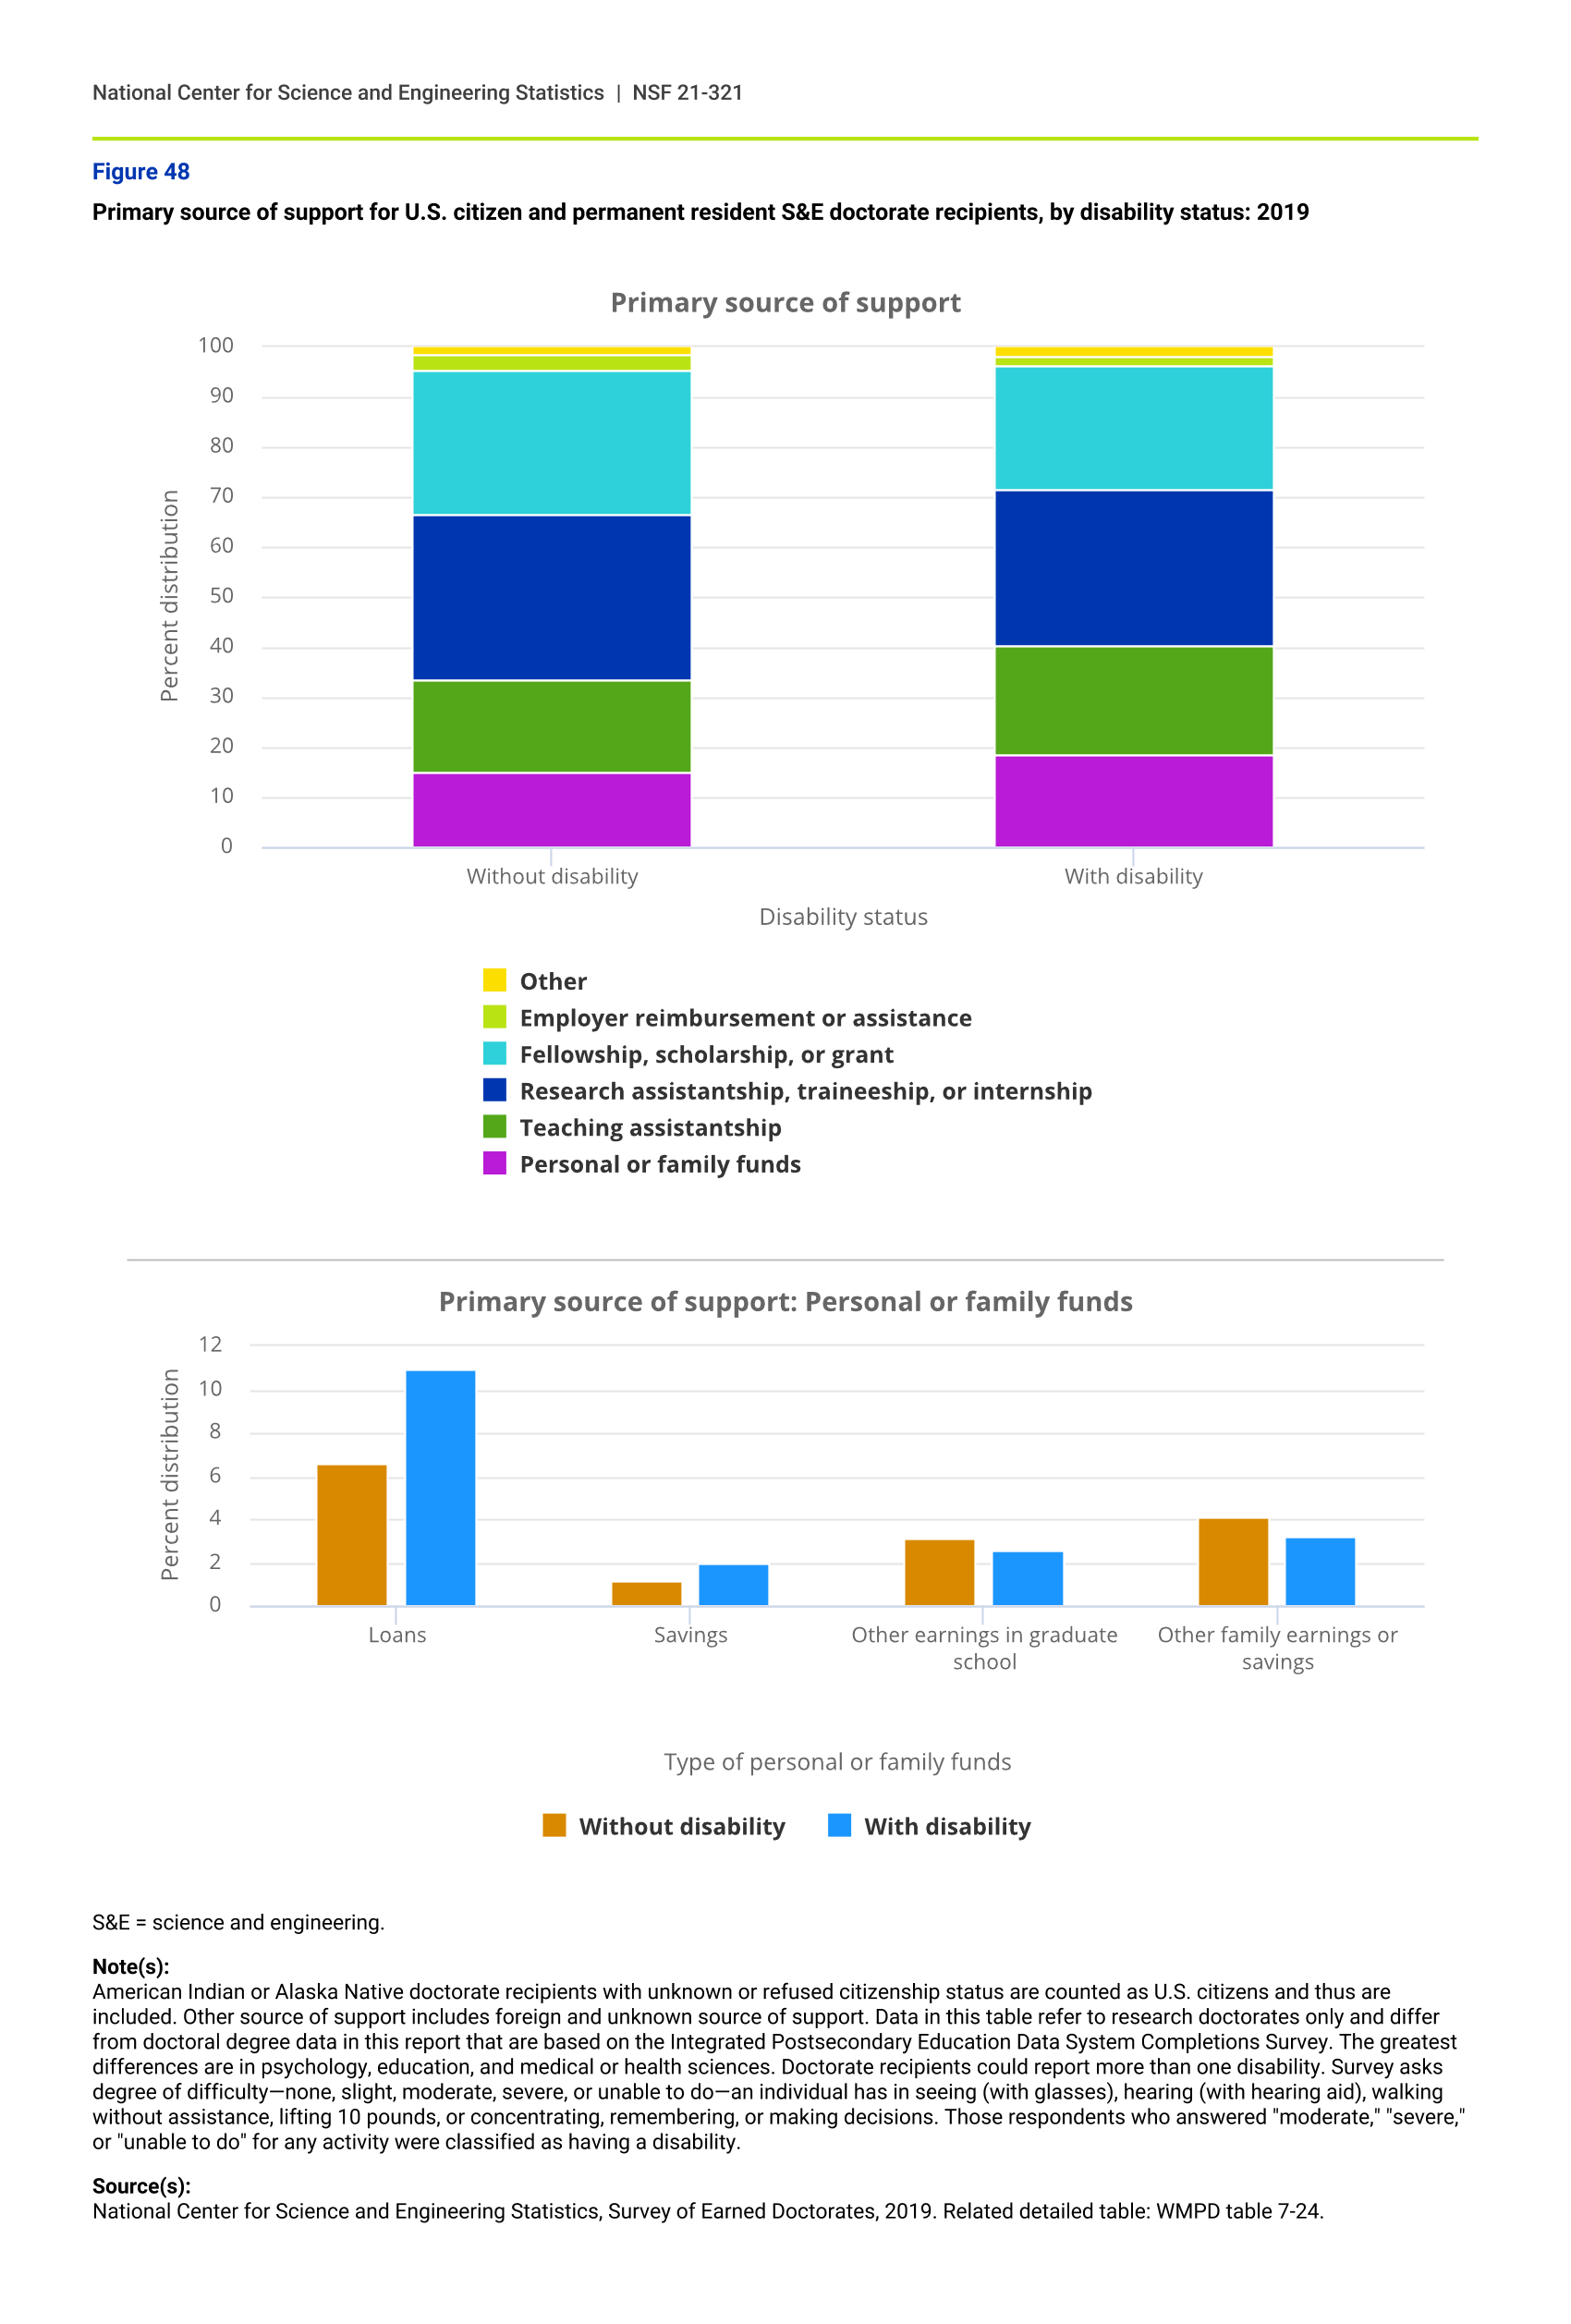
In addition, doctorate recipients in S&E fields in 2019 had a lower disability rate than those in non-S&E fields. However, among doctorate recipients in S&E fields, a larger proportion of those with disability than those without reported that their primary support of their graduate program was personal or family funds, in particular, loans. In addition, a smaller proportion of those with disability reported receiving research assistantships, traineeships, or internships or having fellowships, scholarships, or grants than did their counterparts without disability (figure 48).
These findings indicate that scientists and engineers with disability differ from those without disability across a range of measures. For example, those with disability have a higher rate of unemployment. Further investigation is planned into the educational attainment and employment of those with disability and their career paths to better understand their representation in the U.S. S&E enterprise.
Primary source of support for U.S. citizen and permanent resident S&E doctorate recipients, by disability status: 2019
| Disability status | Personal or family funds | Teaching assistantship | Research assistantship, traineeship, or internship | Fellowship, scholarship, or grant | Employer reimbursement or assistance | Other |
|---|---|---|---|---|---|---|
| Without disability | 15.00 | 18.30 | 33.18 | 28.90 | 3.18 | 1.44 |
| With disability | 18.62 | 21.75 | 31.02 | 24.71 | 2.01 | 1.88 |
| Type of personal or family funds | Without disability | With disability |
|---|---|---|
| Loans | 6.59 | 10.92 |
| Savings | 1.15 | 1.92 |
| Other earnings in graduate school | 3.13 | 2.60 |
| Other family earnings or savings | 4.12 | 3.18 |
S&E = science and engineering.
Note(s):
American Indian or Alaska Native doctorate recipients with unknown or refused citizenship status are counted as U.S. citizens and thus are included. Other source of support includes foreign and unknown source of support. Data in this table refer to research doctorates only and differ from doctoral degree data in this report that are based on the Integrated Postsecondary Education Data System Completions Survey. The greatest differences are in psychology, education, and medical or health sciences. Doctorate recipients could report more than one disability. Survey asks degree of difficulty—none, slight, moderate, severe, or unable to do—an individual has in seeing (with glasses), hearing (with hearing aid), walking without assistance, lifting 10 pounds, or concentrating, remembering, or making decisions. Those respondents who answered "moderate," "severe," or "unable to do" for any activity were classified as having a disability.
Source(s):
National Center for Science and Engineering Statistics, Survey of Earned Doctorates, 2019. Related detailed table: WMPD table 7-24.