 An official website of the United States government
 Field of degree: Women
Of all science and engineering (S&E) degrees awarded in 2018, women earned about half of bachelor’s degrees, 44.7% of master’s degrees, and 41.2% of doctoral degrees. The shares of women earning S&E bachelor’s degrees and master’s degrees both decreased slightly from 2008. However, the share of women earning S&E doctoral degrees increased slightly during this period. Although the share of women earning S&E degrees has been fairly stable over the past 10 years, the proportion of degrees awarded to women in S&E fields varies across and within broad fields of study. Women’s highest degree shares across all three degree levels (bachelor’s, master’s, and doctorate) were in psychology and biological sciences. Agricultural sciences had high shares of women earning bachelor’s and master’s degrees. Computer sciences and engineering had the lowest degree shares of women.
Overview
Women held a majority of the degrees in several S&E fields in 2018. They held a majority of the degrees in psychology, biological sciences, and agricultural sciences at all degree levels—bachelor’s, master’s, and doctoral degrees. In psychology, women received at least 70% of degrees at each level. In biological sciences, women received over 60% of bachelor’s and master’s degrees, and over half of doctoral degrees. In agricultural sciences, women earned over half of bachelor’s and master’s degrees and 47.5% of doctorates. These were the highest rates among the S&E fields. Despite these high rates, there are S&E fields with low female representation, and they are the focus of this theme.
Social sciences
Overall
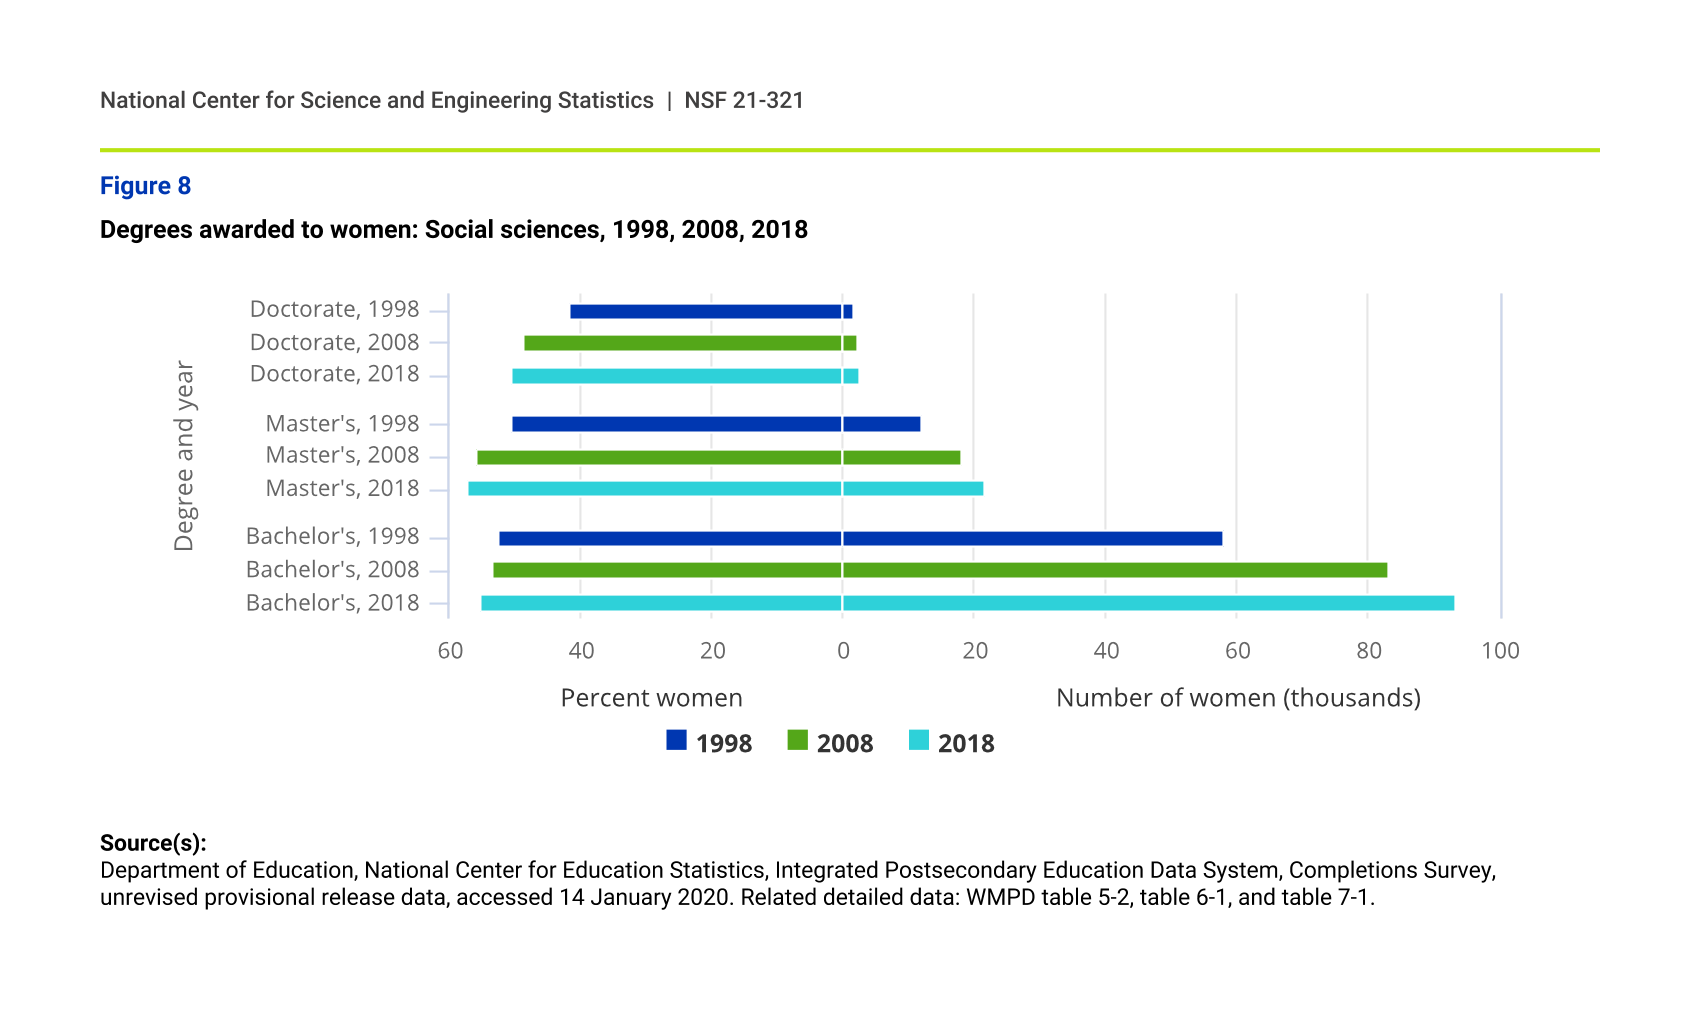
In the field of social sciences, women earned a majority of bachelor’s degrees (55.2%) and master’s degrees (57.0%), and they earned slightly more than half of doctorates. The number of female graduates in social sciences and their share in this field increased over time at all three degree levels (figure 8).
Degrees awarded to women: Social sciences, 1998, 2008, 2018
| Degree and year | Percent women | Number of women (thousands) |
|---|---|---|
| Doctorate, 1998 | 41.63 | 1.68 |
| Doctorate, 2008 | 48.63 | 2.09 |
| Doctorate, 2018 | 50.63 | 2.64 |
| Master's, 1998 | 50.56 | 12.00 |
| Master's, 2008 | 55.76 | 18.11 |
| Master's, 2018 | 57.03 | 21.65 |
| Bachelor's, 1998 | 52.44 | 58.16 |
| Bachelor's, 2008 | 53.48 | 83.25 |
| Bachelor's, 2018 | 55.19 | 93.38 |
Economics
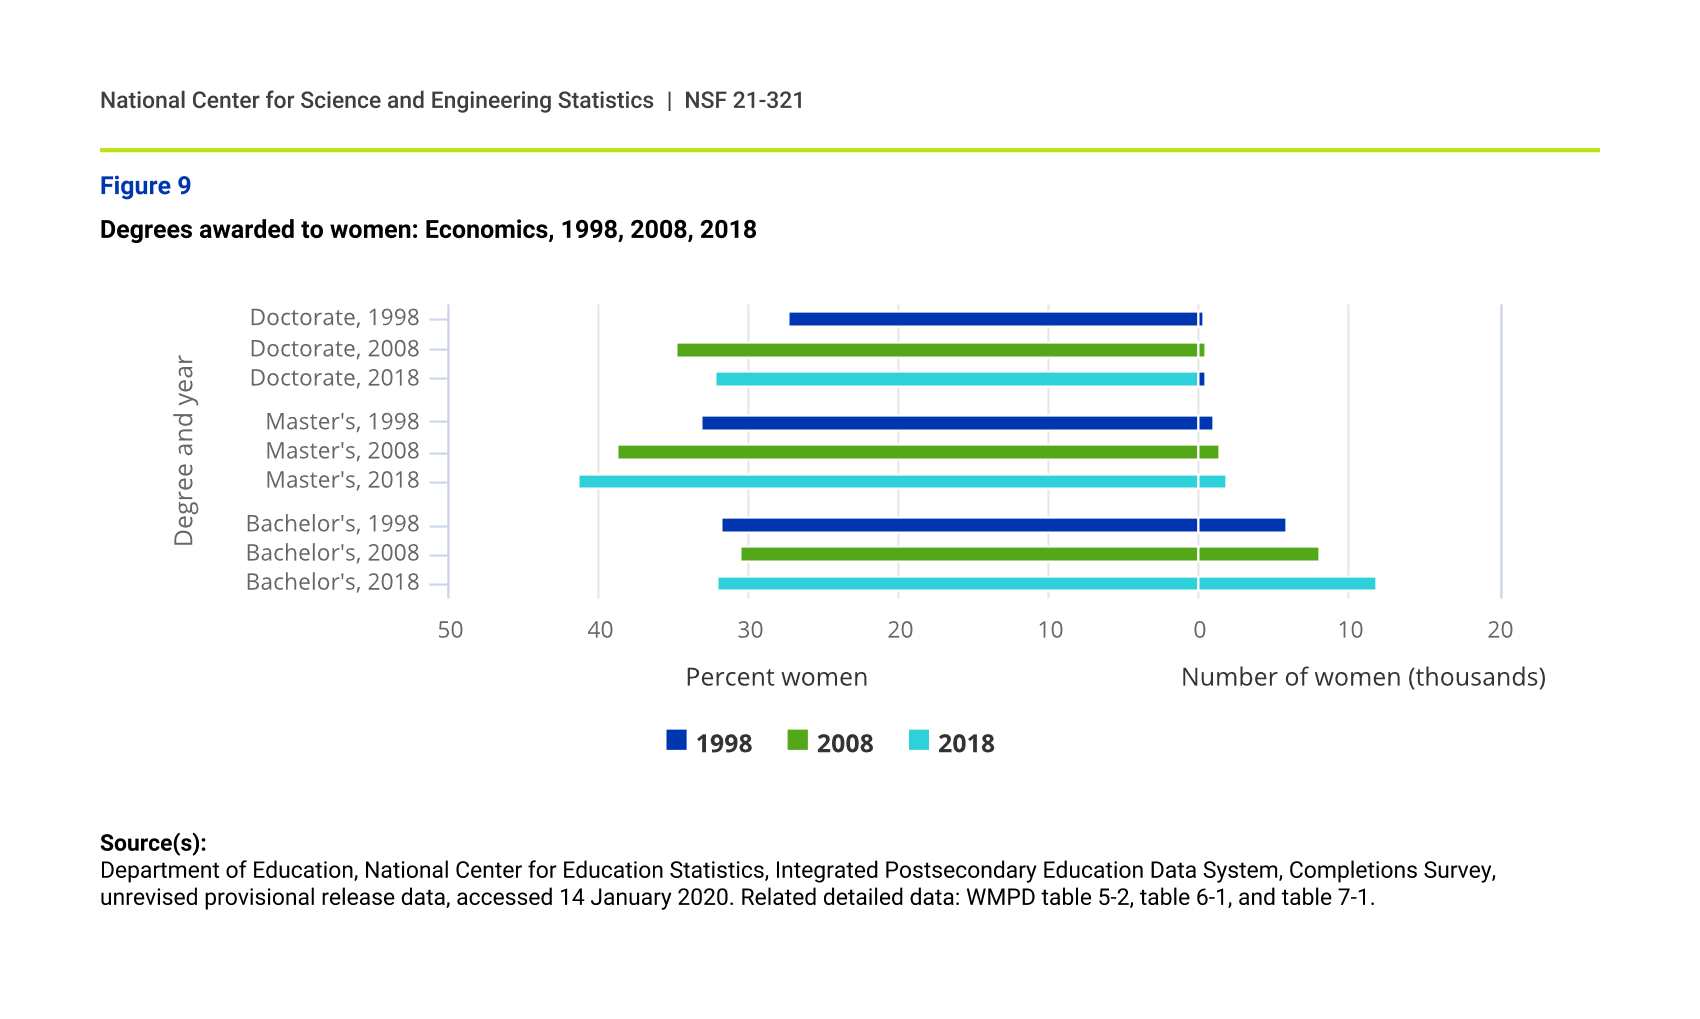
Although women earned near or over half of all degrees in social sciences in 2018, their share of economics degrees at all degree levels continues to be the lowest within the social sciences, with little change in the share at the bachelor’s degree level over the past 2 decades. The lack of movement at the bachelor’s level may constrain future increases at the master’s and doctoral levels. In addition, despite a small increase in the number of women receiving doctoral degrees in economics, women’s share of these degrees has declined over the past 10 years (figure 9).
Degrees awarded to women: Economics, 1998, 2008, 2018
| Degree and year | Percent women | Number of women (thousands) |
|---|---|---|
| Doctorate, 1998 | 27.31 | 0.30 |
| Doctorate, 2008 | 34.81 | 0.41 |
| Doctorate, 2018 | 32.20 | 0.43 |
| Master's, 1998 | 33.20 | 0.94 |
| Master's, 2008 | 38.70 | 1.38 |
| Master's, 2018 | 41.45 | 1.84 |
| Bachelor's, 1998 | 31.75 | 5.79 |
| Bachelor's, 2008 | 30.61 | 8.04 |
| Bachelor's, 2018 | 32.11 | 11.85 |
Computer sciences
Computer sciences has one of the lowest shares of female degree recipients among the broad fields of S&E, despite an increase in the number of women receiving computer sciences degrees over the past 2 decades—the number of women with bachelor’s and doctoral degrees more than doubled, and the number with master’s degrees more than quadrupled. Although the share of women receiving master’s and doctoral degrees increased, the share receiving bachelor’s degrees declined, from 27.0% in 1998 to 19.9% in 2018. The academic pipeline for women earning advanced degrees in computer sciences may be affected, to the extent that graduate enrollment will be affected by a smaller proportion of women receiving a bachelor’s in computer sciences (figure 10).
Degrees awarded to women: Computer sciences, 1998, 2008, 2018
| Degree and year | Percent women | Number of women (thousands) |
|---|---|---|
| Doctorate, 1998 | 16.32 | 0.14 |
| Doctorate, 2008 | 21.99 | 0.37 |
| Doctorate, 2018 | 21.58 | 0.43 |
| Master's, 1998 | 29.11 | 3.43 |
| Master's, 2008 | 26.80 | 4.60 |
| Master's, 2018 | 32.43 | 15.10 |
| Bachelor's, 1998 | 26.98 | 7.58 |
| Bachelor's, 2008 | 17.69 | 6.88 |
| Bachelor's, 2018 | 19.93 | 16.00 |
Engineering
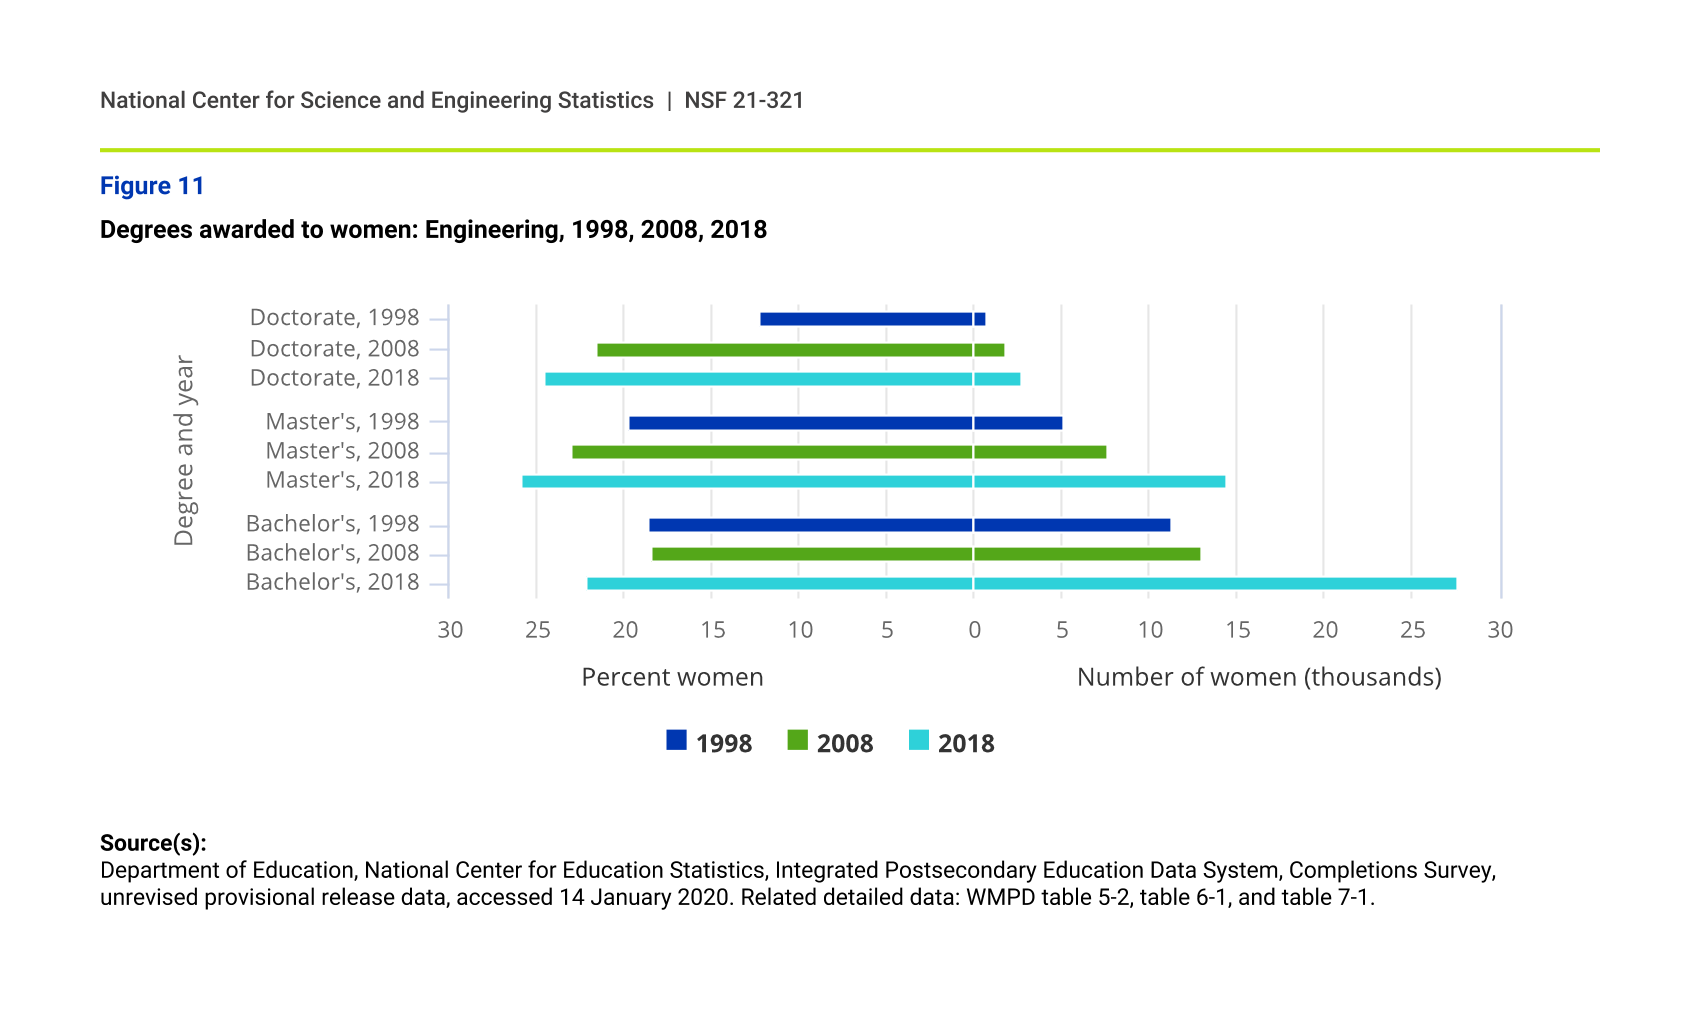
Engineering is another S&E field with one of the lowest shares of female degree recipients. However, both the number and share of women receiving engineering degrees increased at all levels over the past 2 decades. The number of women receiving engineering doctoral degrees is small, about 2,700 in 2018, yet the share of degrees earned by women in this field doubled, from 12.3% to 24.5% since 1998 (figure 11).
Degrees awarded to women: Engineering, 1998, 2008, 2018
| Degree and year | Percent women | Number of women (thousands) |
|---|---|---|
| Doctorate, 1998 | 12.26 | 0.73 |
| Doctorate, 2008 | 21.55 | 1.75 |
| Doctorate, 2018 | 24.53 | 2.69 |
| Master's, 1998 | 19.80 | 5.16 |
| Master's, 2008 | 23.02 | 7.64 |
| Master's, 2018 | 25.78 | 14.43 |
| Bachelor's, 1998 | 18.61 | 11.34 |
| Bachelor's, 2008 | 18.48 | 12.92 |
| Bachelor's, 2018 | 22.20 | 27.60 |
Mathematics and statistics
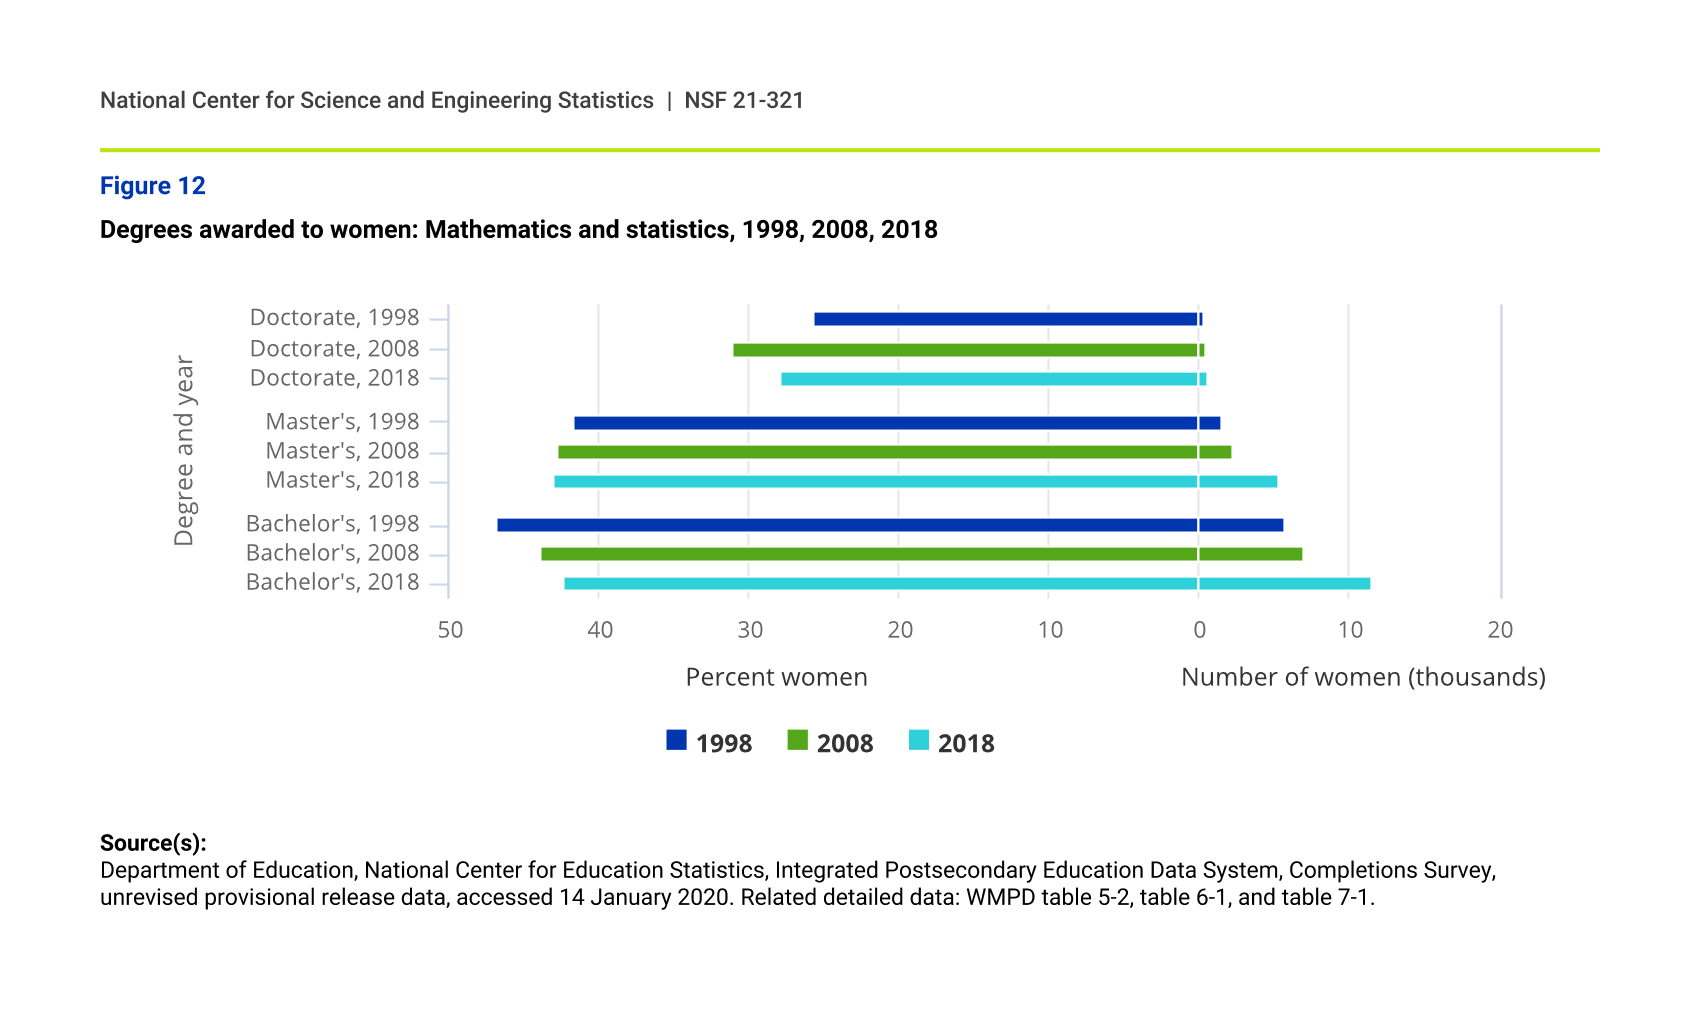
Women earned less than half of mathematics and statistics degrees: their share was over 40% at both the bachelor’s and master’s levels but under 30% at the doctoral level. Over the past 2 decades, the share of women receiving bachelor’s degrees in mathematics and statistics declined and the share of women receiving master’s degrees was stagnant. At the doctoral level, women’s share increased between 1998 and 2008, from 25.7% to 31.1%. The share then declined to 28.0% in 2018, even though there was an increase in the number of women receiving doctoral degrees (figure 12).
Degrees awarded to women: Mathematics and statistics, 1998, 2008, 2018
| Degree and year | Percent women | Number of women (thousands) |
|---|---|---|
| Doctorate, 1998 | 25.74 | 0.32 |
| Doctorate, 2008 | 31.06 | 0.42 |
| Doctorate, 2018 | 27.97 | 0.56 |
| Master's, 1998 | 41.70 | 1.47 |
| Master's, 2008 | 42.84 | 2.21 |
| Master's, 2018 | 43.03 | 5.23 |
| Bachelor's, 1998 | 46.80 | 5.66 |
| Bachelor's, 2008 | 43.92 | 6.96 |
| Bachelor's, 2018 | 42.30 | 11.49 |
Earth and physical sciences
Overall
Women earned fewer than half of the degrees in the broad fields of physical and earth sciences. In 2018, women’s shares of bachelor’s, master’s, and doctoral degrees were 40.6%, 35.6%, and 32.5%, respectively, in physical sciences and 38.4%, 42.6%, and 44.1% in earth sciences. At the bachelor’s level, the share of female degree holders decreased slightly between 2008 and 2018, whereas the master’s share held fairly steady. During the same period, the share of doctoral degrees awarded to women increased, from 30.2% in 2008 to 34.3% in 2018. Among the earth and physical sciences, chemistry had the highest shares of degrees awarded to women: 50.8% at the bachelor’s level, 45.4% at the master’s level, and 39.0% at the doctoral level in 2018. Astronomy’s share of women receiving doctoral degrees in 2018 (38.9%) was just behind chemistry’s share. However, the number of female doctorate recipients in astronomy was small (82 women).
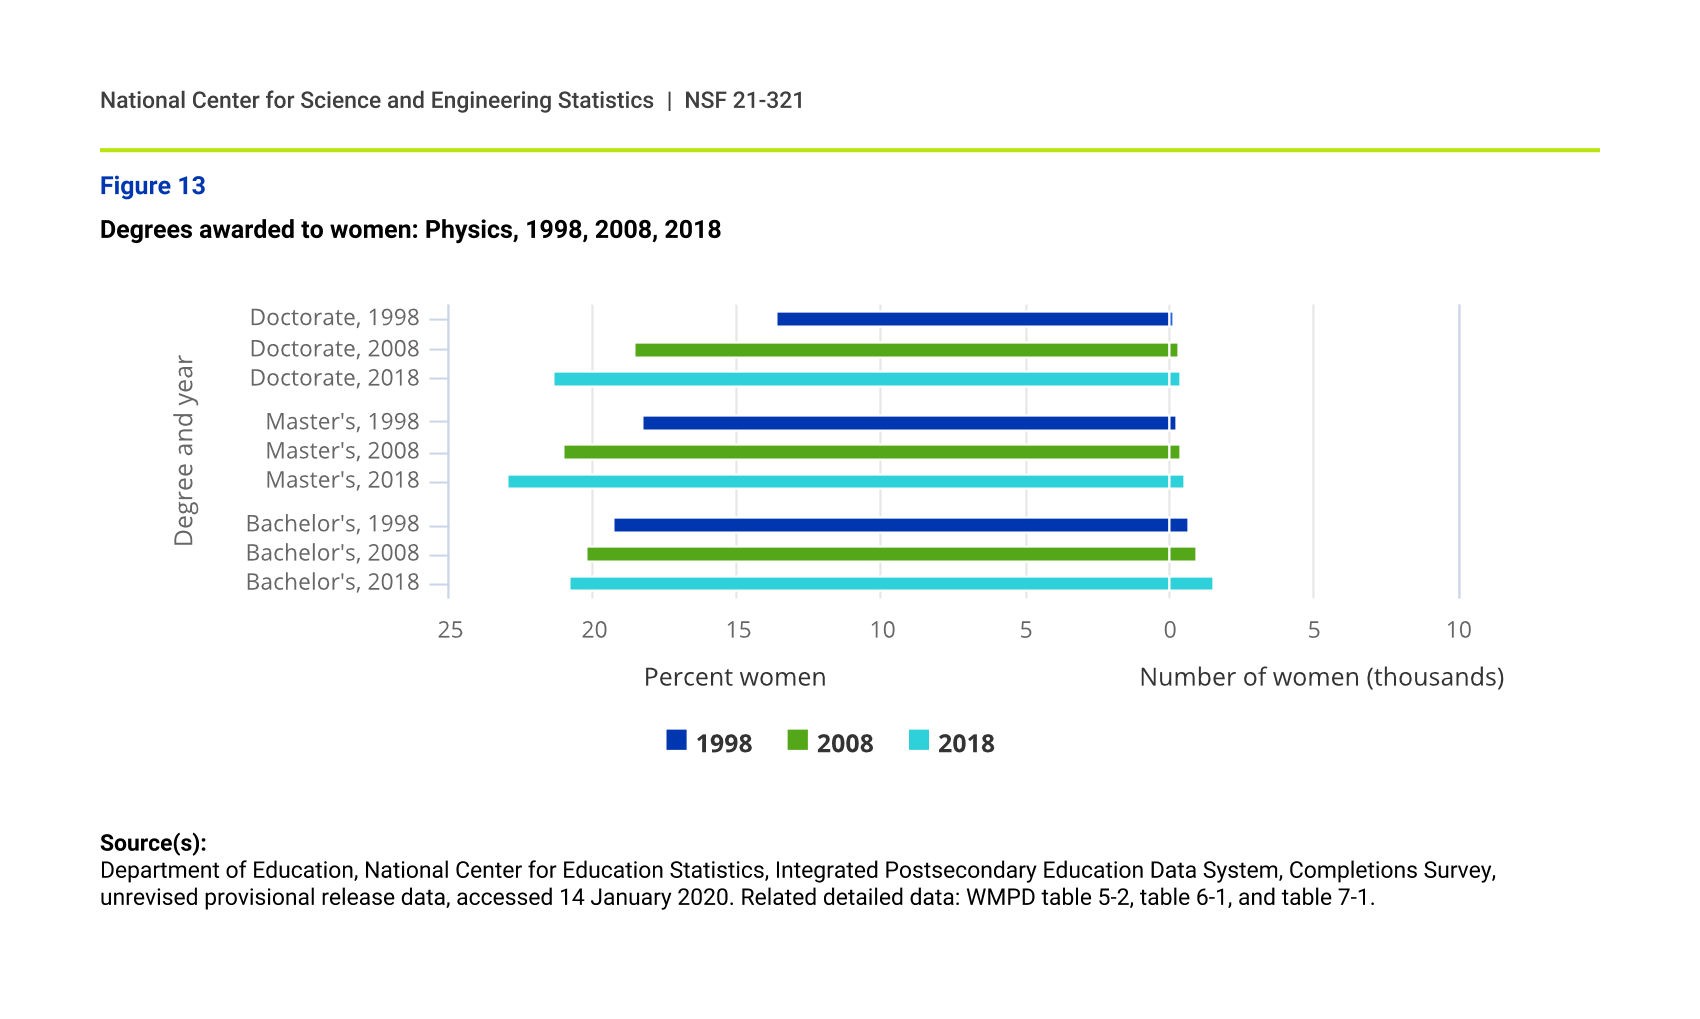
Physics
Physics has the lowest share of female degree recipients within the broad field of physical sciences. Although both the number and share of physics degrees awarded to women increased over the past 2 decades for all three degree levels, the number and share of women in this field remained very small (figure 13).
Degrees awarded to women: Physics, 1998, 2008, 2018
| Degree and year | Percent women | Number of women (thousands) |
|---|---|---|
| Doctorate, 1998 | 13.64 | 0.19 |
| Doctorate, 2008 | 18.58 | 0.28 |
| Doctorate, 2018 | 21.39 | 0.40 |
| Master's, 1998 | 18.29 | 0.25 |
| Master's, 2008 | 21.01 | 0.38 |
| Master's, 2018 | 22.96 | 0.50 |
| Bachelor's, 1998 | 19.29 | 0.67 |
| Bachelor's, 2008 | 20.26 | 0.99 |
| Bachelor's, 2018 | 20.84 | 1.57 |